4802
3D high resolution Black Blood(BB) Multiple Echo(ME) T2* Imaging Technique for Quantitative Ferumoxytol Imaging on Delayed Scans1UCAIR, Department of Radiology and Imaging Sciences, University of Utah, Salt Lake City, UT, United States, 2Department of Neurology, University of Utah, Salt Lake City, UT, United States, 3Department of Veterans Affairs, VASLCHCS, Salt Lake City, UT, United States
Synopsis
The purpose of this work was to develop a 3D BB ME T2* Imaging technique to to allow quantitative ferumoxytol imaging on delayed scans by measuring T2* in intracranial atherosclerotic plaque(ICAD). Post-gadoliniun enhancement in ICAD may be related to endothelial dysfunction or breakdown or secondary to plaque inflammation. Delayed ferumoxytol imaging allows intravascular clearance with retention in the macrophages present in vulnerable atherosclerotic plaque. We developed a 3D BB ME T2* imaging technique to allow quantitative ferumoxytol imaging on delayed scans by measuring T2* in ICAD.
Purpose
Vessel wall MRI(vwMRI) has been used to detect vulnerable plaque features including post-gadoliniun enhancement (PGE) in Intracranial atherosclerotic disease(ICAD), with increased stroke risk independent of stenosis1. PGE may be related to endothelial dysfunction or breakdown, leading to contrast leakage into the vessel wall or secondary to plaque inflammation and recruitment of leaky plaque neovessels2,3. The MRI contrast agent ferumoxytol is taken up by macrophages in vivo and has been studied in carotid atherosclerosis4,5. Ferumoxytol is an ultrasmall superparamagnetic iron-oxide(USPIO), and results in decreased signal on T2*-weighted sequences in areas of accumulation6. Delayed ferumoxytol imaging allows intravascular clearance with retention in the macrophages present in vulnerable atherosclerotic plaque7. The purpose of this work was to develop a 3D Black Blood(BB) Multi Echo(ME) T2* imaging technique to allow quantitative ferumoxytol imaging on delayed scans by measuring T2* in intracranial atherosclerotic plaque.Methods
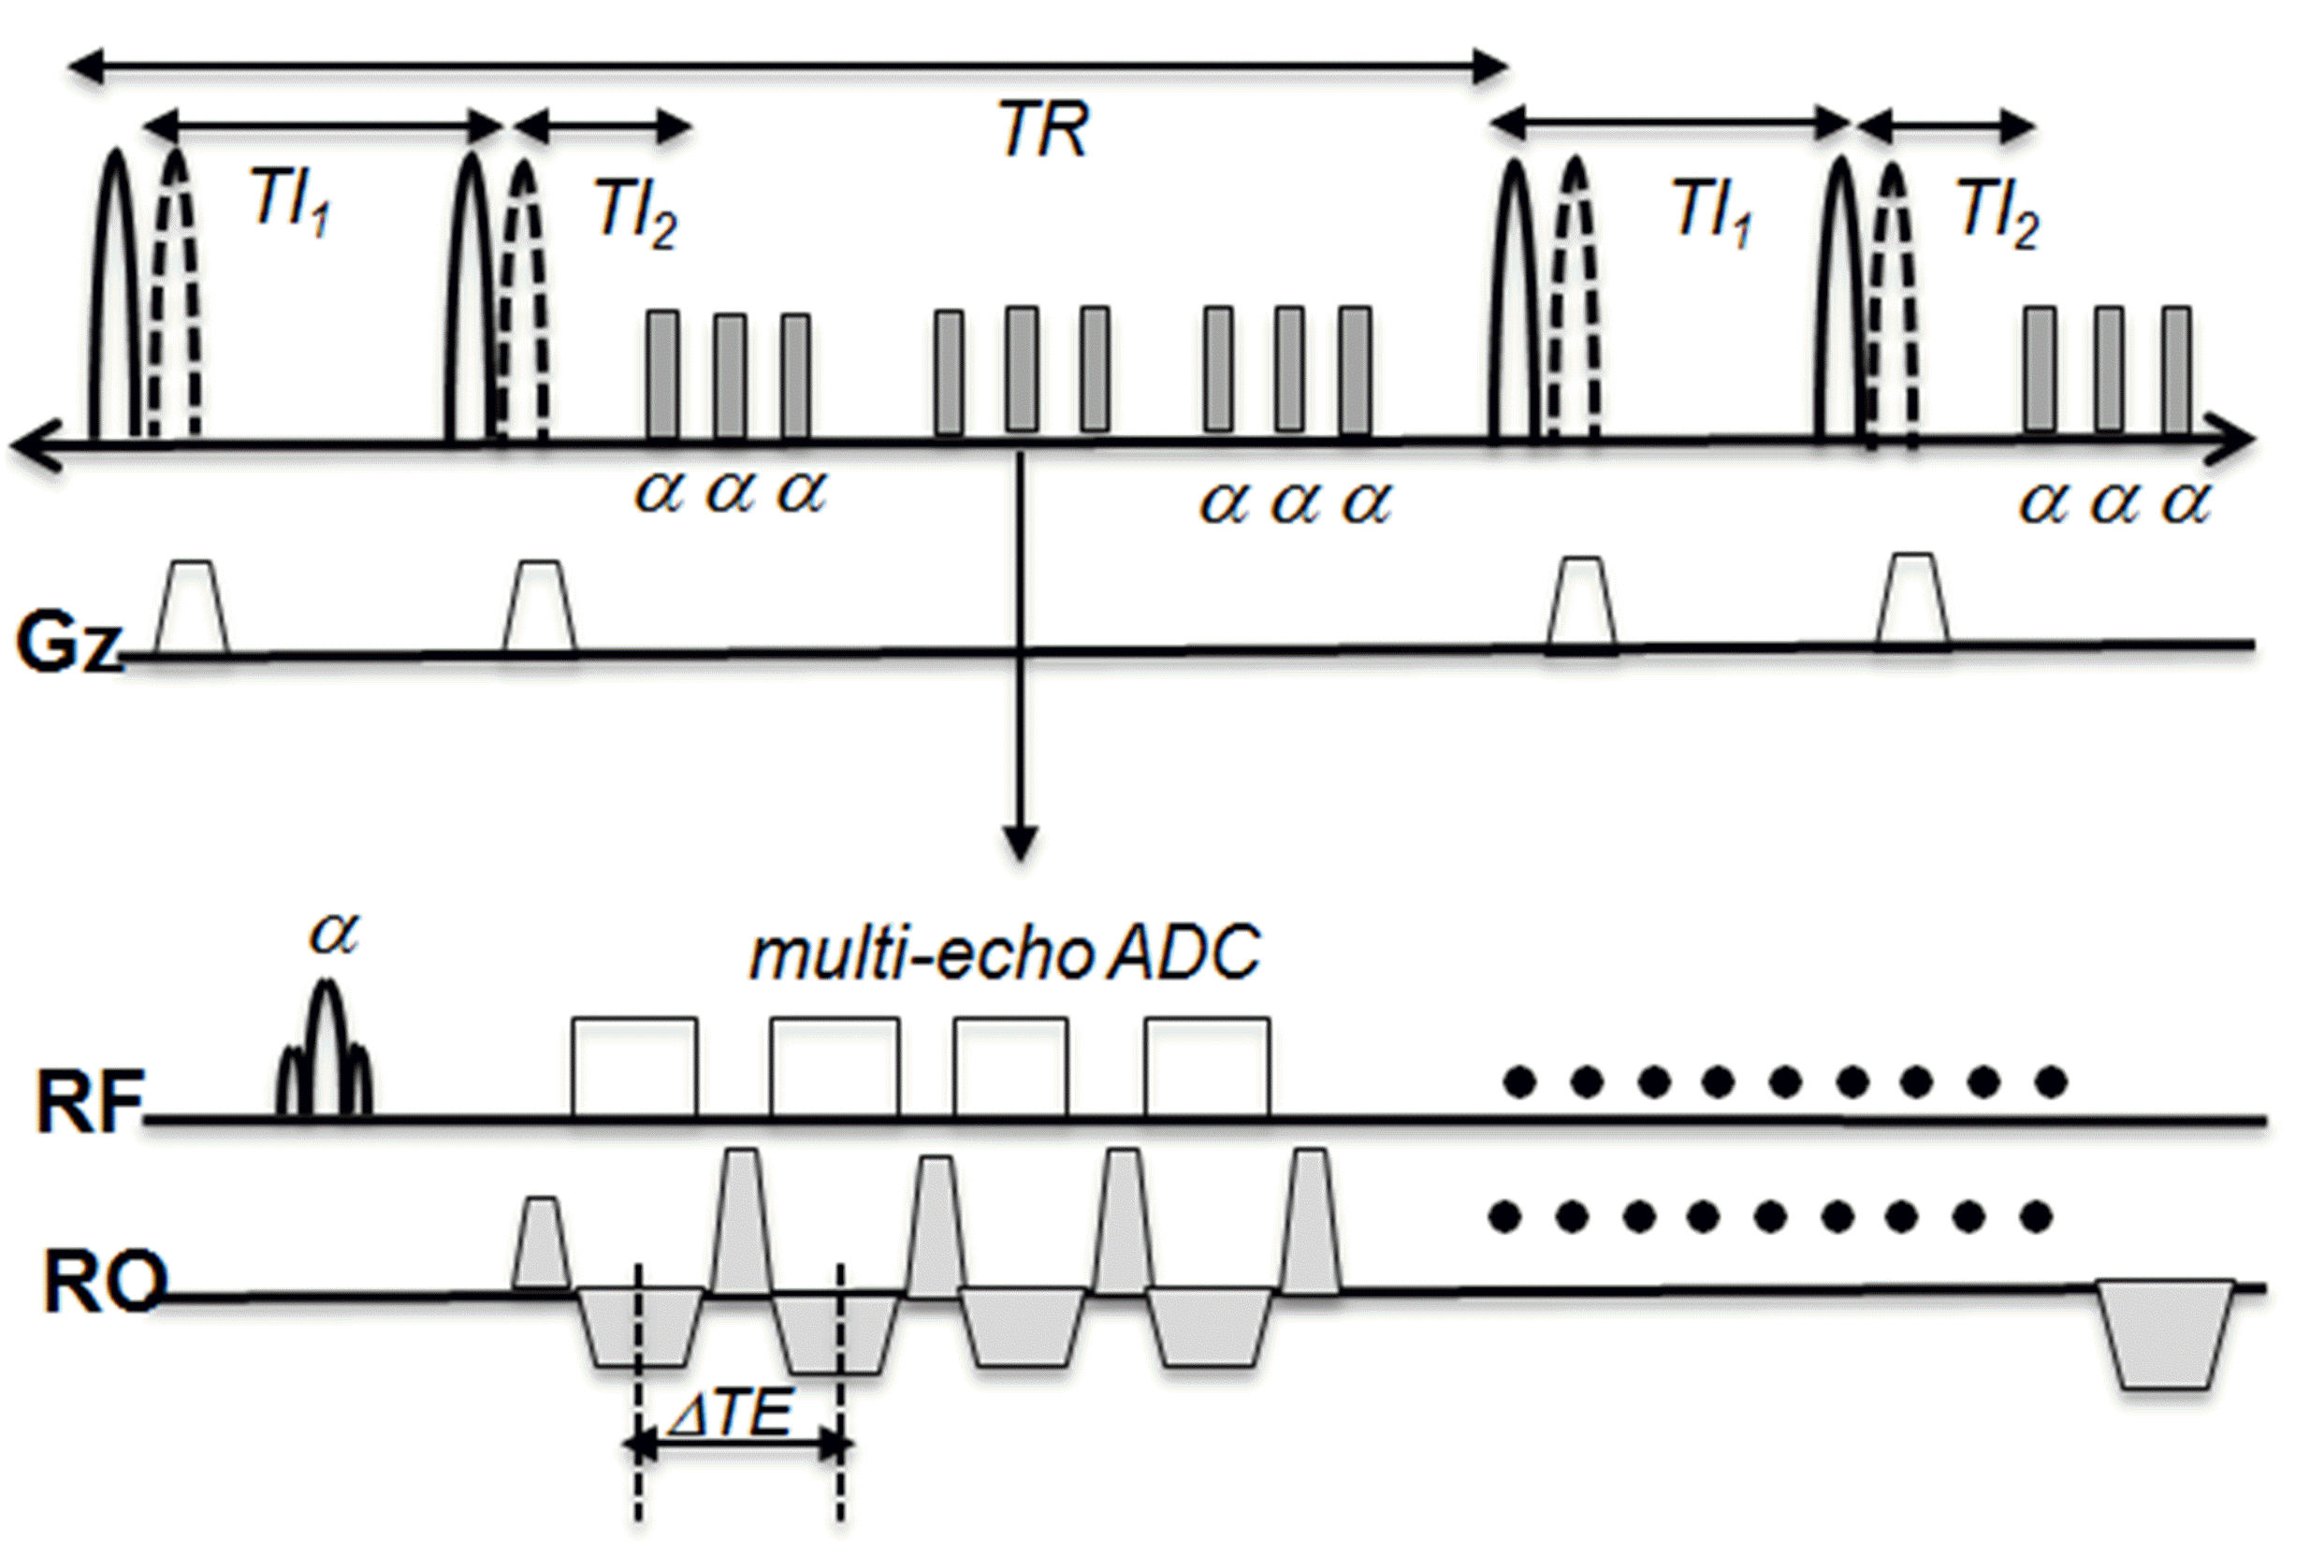
The 3D BB ME T2* imaging sequence was implemented with a quadruple inversion recovery (QIR) preparation8 and segmented spoiled fast low angle shot (FLASH) readout. QIR prep was performed with two sets of nonselective and slice selective hyperbolic secant adiabatic inversion RF pulses to provide uniform blood suppression on the imaging slab. After each QIR preparation, a series of multi echo(ME) FLASH measurements were acquired. Fig 1 demonstrates the pulse diagram. MRI was performed on patients with known ICAD using a Siemens Verio 3T MRI scanner with 20 channel head coil. To locate PGE in vessel wall 3D T1w SPACE with DANTE preparation was performed. 3D ME T2* images were acquired before (baseline) and 72 hours after ferumoxytol injection (72h delay). The imaging parameters for 3D BB ME T2* imaging were: transverse plane, in plane resolution=0.6 mm, slice thickness=1.0 mm, 48 slices/slab, TI1/TI2 =300/200 ms, TEmin/ TEmax /TR =2.8/27.2/800ms, and DTE=3.4ms with 8 echoes. Total imaging time was 4 min 20 sec. T2* maps were created and displayed using homemade Matlab software. T2* was calculated with least-square estimation based on the semi-log linear regression of the signal values from all echoes and their corresponding echo time according to: $$\frac{1}{T2^{\star}}=-\frac{lnS_{l}-lnS_{m}}{TE_{l}-TE_{m}}$$ where Sl, Sm are signal intensity at the echo time TEm, TEl ,respectively.Results
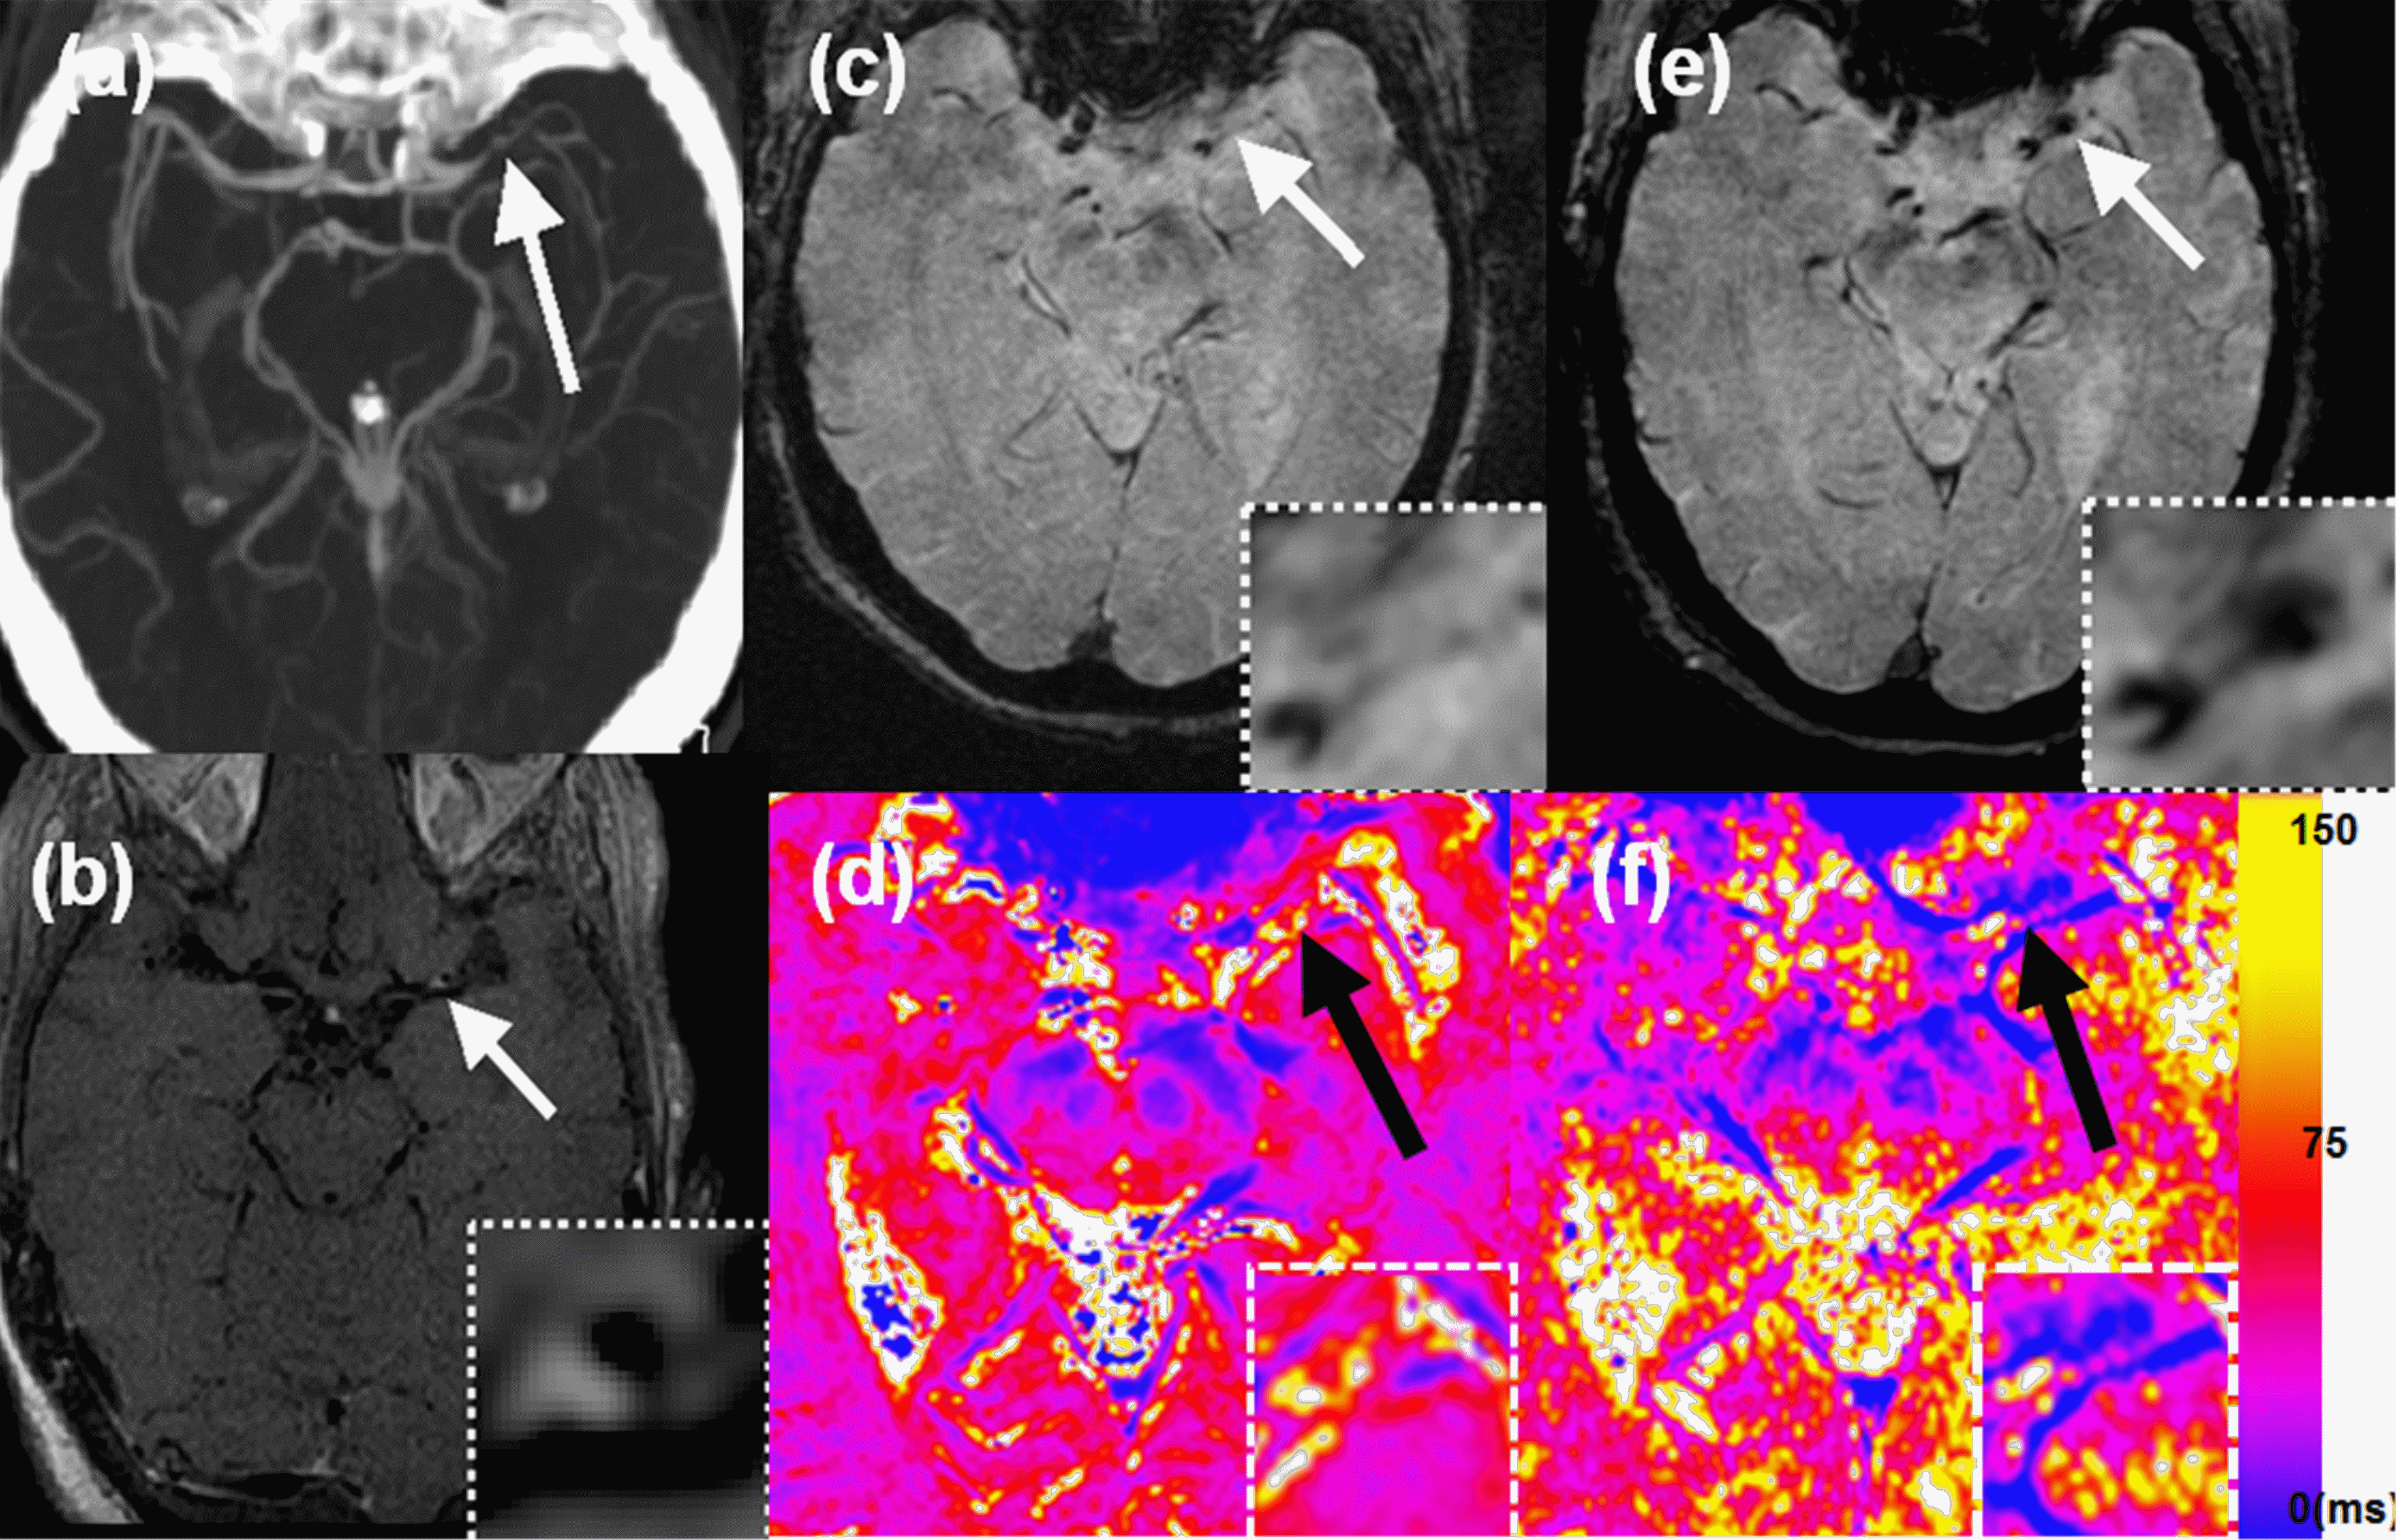
Figure 2 shows results from a 79 year old female patient who was found to have multiple acute infarcts in the left MCA distribution. A CTA MIP (Fig 2a) shows severe left MCA M1 segment stenosis. Transverse 3D SPACE shows PGE in a left MCA stenotic plaque (white arrow) (Fig 2b). T2* images with TE of 16.2 ms are shown on Fig 2e (baseline) and Fig 2f (72h delay). Baseline T2* imaging shows no T2* signal in the left M1 plaque (white arrow, Fig 2c). However, the 72 h delayed T2* image shows hypointense signal (white arrow, Fig 2d). Baseline and 72h delayed T2* maps were calculated from the eight echo T2* images acquired from the baseline and 72h delayed scans. The 72h delayed T2* map (Fig 2d) shows a lower T2* value corresponding to the T2* signal enhanced area. The black arrows on T2* maps show that the ferumoxytol uptake after 72h post injection can be quantified by the difference in T2* values measured from baseline and 72h delayed scans. Mean T2* values of baseline and 72h delayed on the left M1 plaque were measure as 57.27±9.25 ms (Fig 2e) and 25.23±6.15 ms (Fig 2f), respectively.Discussion
Previous studies of iron nanoparticle uptake have used 2D techniques, which are adequate for larger caliber arteries, larger plaques and more linear segments such as the carotid6,7. For the unique challenges inherent to ICAD, we developed a 3D BB ME T2* sequence that has excellent blood suppression. QIR preparation is a T1 insensitive blood suppression technique and has been used for 2D post-contrast vwMRI. The larger slab size in 3D acquisition, the more difficult it is to perfect the QIR and this may result in imperfect blood suppression. When a relatively thin slab (48 mm) is used with 3D acquisition and QIR preparation, we found good blood suppression on 72h delay MRI. Delayed ferumoxytol T2* imaging has been used for semi-quantitative measurement of uptake, but it can easily over- or under-estimate the uptake caused by the differences in subject and coil positioning between baseline and delayed scan which can influence the T2* signal intensities9. To minimize those factors, R2*(1/T2*) can be used to assess the localization and amount of uptake more directly and with high sensitivity.Conclusion
3D BB ME T2* imaging can detect and quantify USPIO uptake in symptomatic ICAD, which may provide important mechanistic implications for the pathophysiology of PGE.Acknowledgements
: Supported by R01 HL127582, RSNA Research Scholar Grant RSCH1414, AMAG Pharmaceuticals, American Heart Association 17SDG33670114, Siemens Medical Solutions, the Clinical Merit Review Grant from the Veterans Administration health Care System.References
1. de Havenon A, Chung L, Park M, et al. Intracranial vessel wall MRI: a review of current indications and future applications. Neurovascular Imaging 2016;2(10).
2. Celletti FL, Waugh JM, Amabile PG, et al. Vascular endothelial growth factor enhances atherosclerotic plaque progression. Nature medicine 2001;7(4):425-429.
3. Libby P, Ridker PM, Maseri A. Inflammation and atherosclerosis. Circulation 2002;105(9):1135-1143.
4. Trivedi RA, Mallawarachi C, U-King-Im J-M, et al. Identifying inflamed carotid plaques using in vivo USPIO-enhanced MR imaging to label plaque macrophages. Arterioscler Thromb Vasc Biol 2006;26:1601–6.
5. Tang TY, Howarth SPS, Miller SR, et al. The ATHEROMA (Atorvastatin Therapy: Effects on Reduction of Macrophage Activity) Study: Evaluation Using Ultrasmall Superparamagnetic Iron Oxide-Enhanced Magnetic Resonance Imaging in Carotid Disease. J Am Coll Cardiol 2009;53:2039–50.
6. Weinstein JS, Varallyay CG, Dosa E, et al. Superparamagnetic iron oxide nanoparticles: diagnostic magnetic resonance imaging and potential therapeutic applications in neurooncology and central nervous system inflammatory pathologies, a review. J Cereb Blood Flow Metab Off J Int Soc Cereb Blood Flow Metab 2010;30:15–35.
7. Alam SR, Stirrat C, Richards J, et al. Vascular and plaque imaging with ultrasmall superparamagnetic particles of iron oxide. J Cardiovasc Magn Reson 2015;17:1–9.
8. Yarnykh VL, Yuan C. T1-insensitive flow suppression using quadruple inversion-recovery. Magn Reson Med. 2002 Nov;48(5):899-905.
9. Fayad ZA, Razzouk, Briley-Saebo KC et al. Iron oxide magnetic resonance imaging for atherosclerosis therapeutic evaluation: still rusty?. J Am Coll Cardiol. 2009 Jun 2; 53(22): 2051–2052.
Figures