4801
Analyzation and Optimization of Simultaneous Non-Contrast Angiography and intraPlaque Hemorrhage (SNAP) Magnetic Resonance Angiography in Intracranial Vascular Imaging1Center for Biomedical Imaging Research, Department of Biomedical Engineering, School of Medicine, Tsinghua University, Beijing, China, 2Tsinghua University Yuquan Hospital, Beijing, China, 3Vascular Imaging Laboratory, Department of Radiology, University of Washington, Seattle, WA, United States
Synopsis
In this study, we used theoretical simulation and in-vivo scan validation to explore the relationship between intracranial SNAP-MRA signal and blood flow velocity to explain why the performance of SNAP-MRA may vary greatly between healthy people and patients with neurodegenerative diseases. We also found the way to re-optimize the scan parameters (TI and flip angle) to enhance the SNAP-MRA signal and acquire high quality intracranial SNAP-MRA.
Purpose
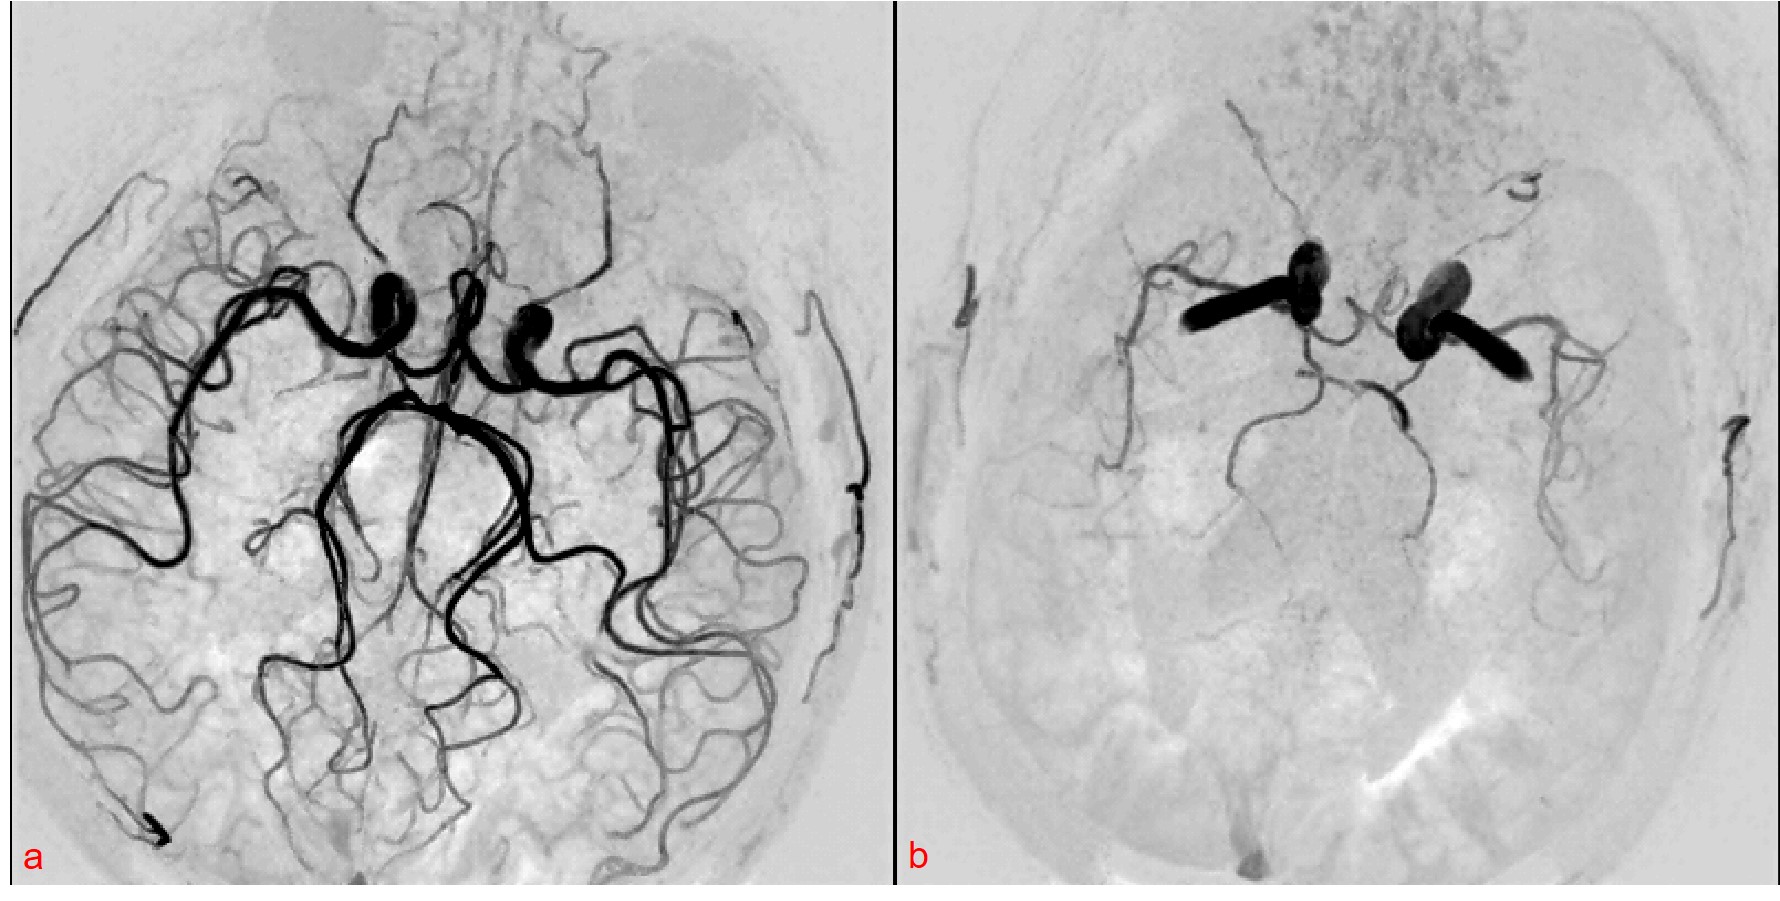
Simultaneous Non-contrast Angiography and intraPlaque imaging (SNAP)1 is a carotid artery imaging technique which can provide a full 3D luminal magnetic resonance angiography (MRA) and an intrinsically registered 3D intraplaque hemorrhage (IPH) image in a single scan1. The SNAP-MRA can provide intracranial vascular images with effective background suppression offered by the phase-sensitive reconstruction technique3, and its potential in intracranial vascular stenosis detection has been shown2. However, we found that sometimes the performance of intracranial SNAP-MRA may vary greatly between healthy people and patients with neurodegenerative diseases (Fig. 1). The blood flow velocity may be the potential cause and it was mentioned without theoretical analysis in previous studies1, 4. Moreover, the scan parameters (TI and flip angle) in the commonly used SNAP sequence were optimized for maximized carotid IPH-vessel wall and vessel wall-lumen contrasts1, while in intracranial SNAP-MRA we are more concerned about the intensity of blood signal. This study aims to explore the relationship between SNAP-MRA signal and blood flow velocity and re-optimize the intracranial SNAP-MRA sequence parameters to enhance the SNAP-MRA signal using theoretical simulation and in-vivo scan validation.Methods
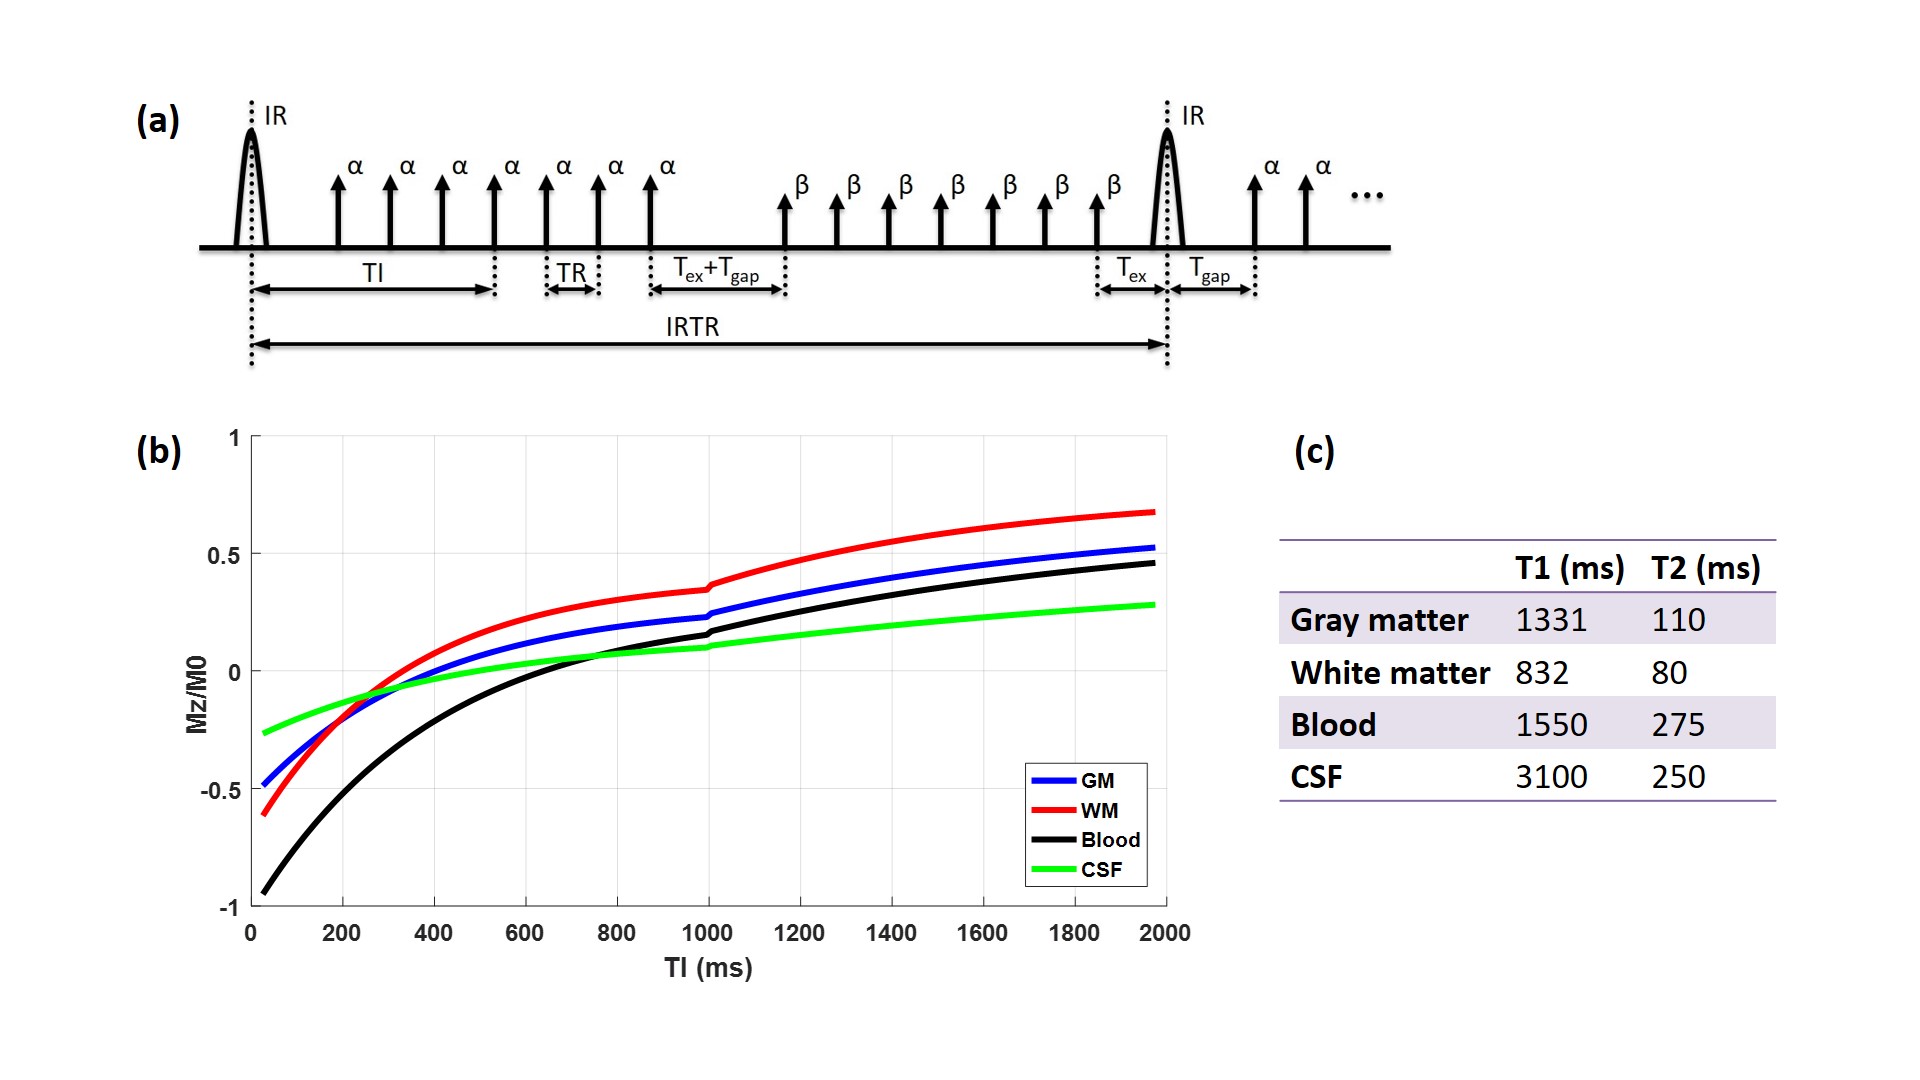
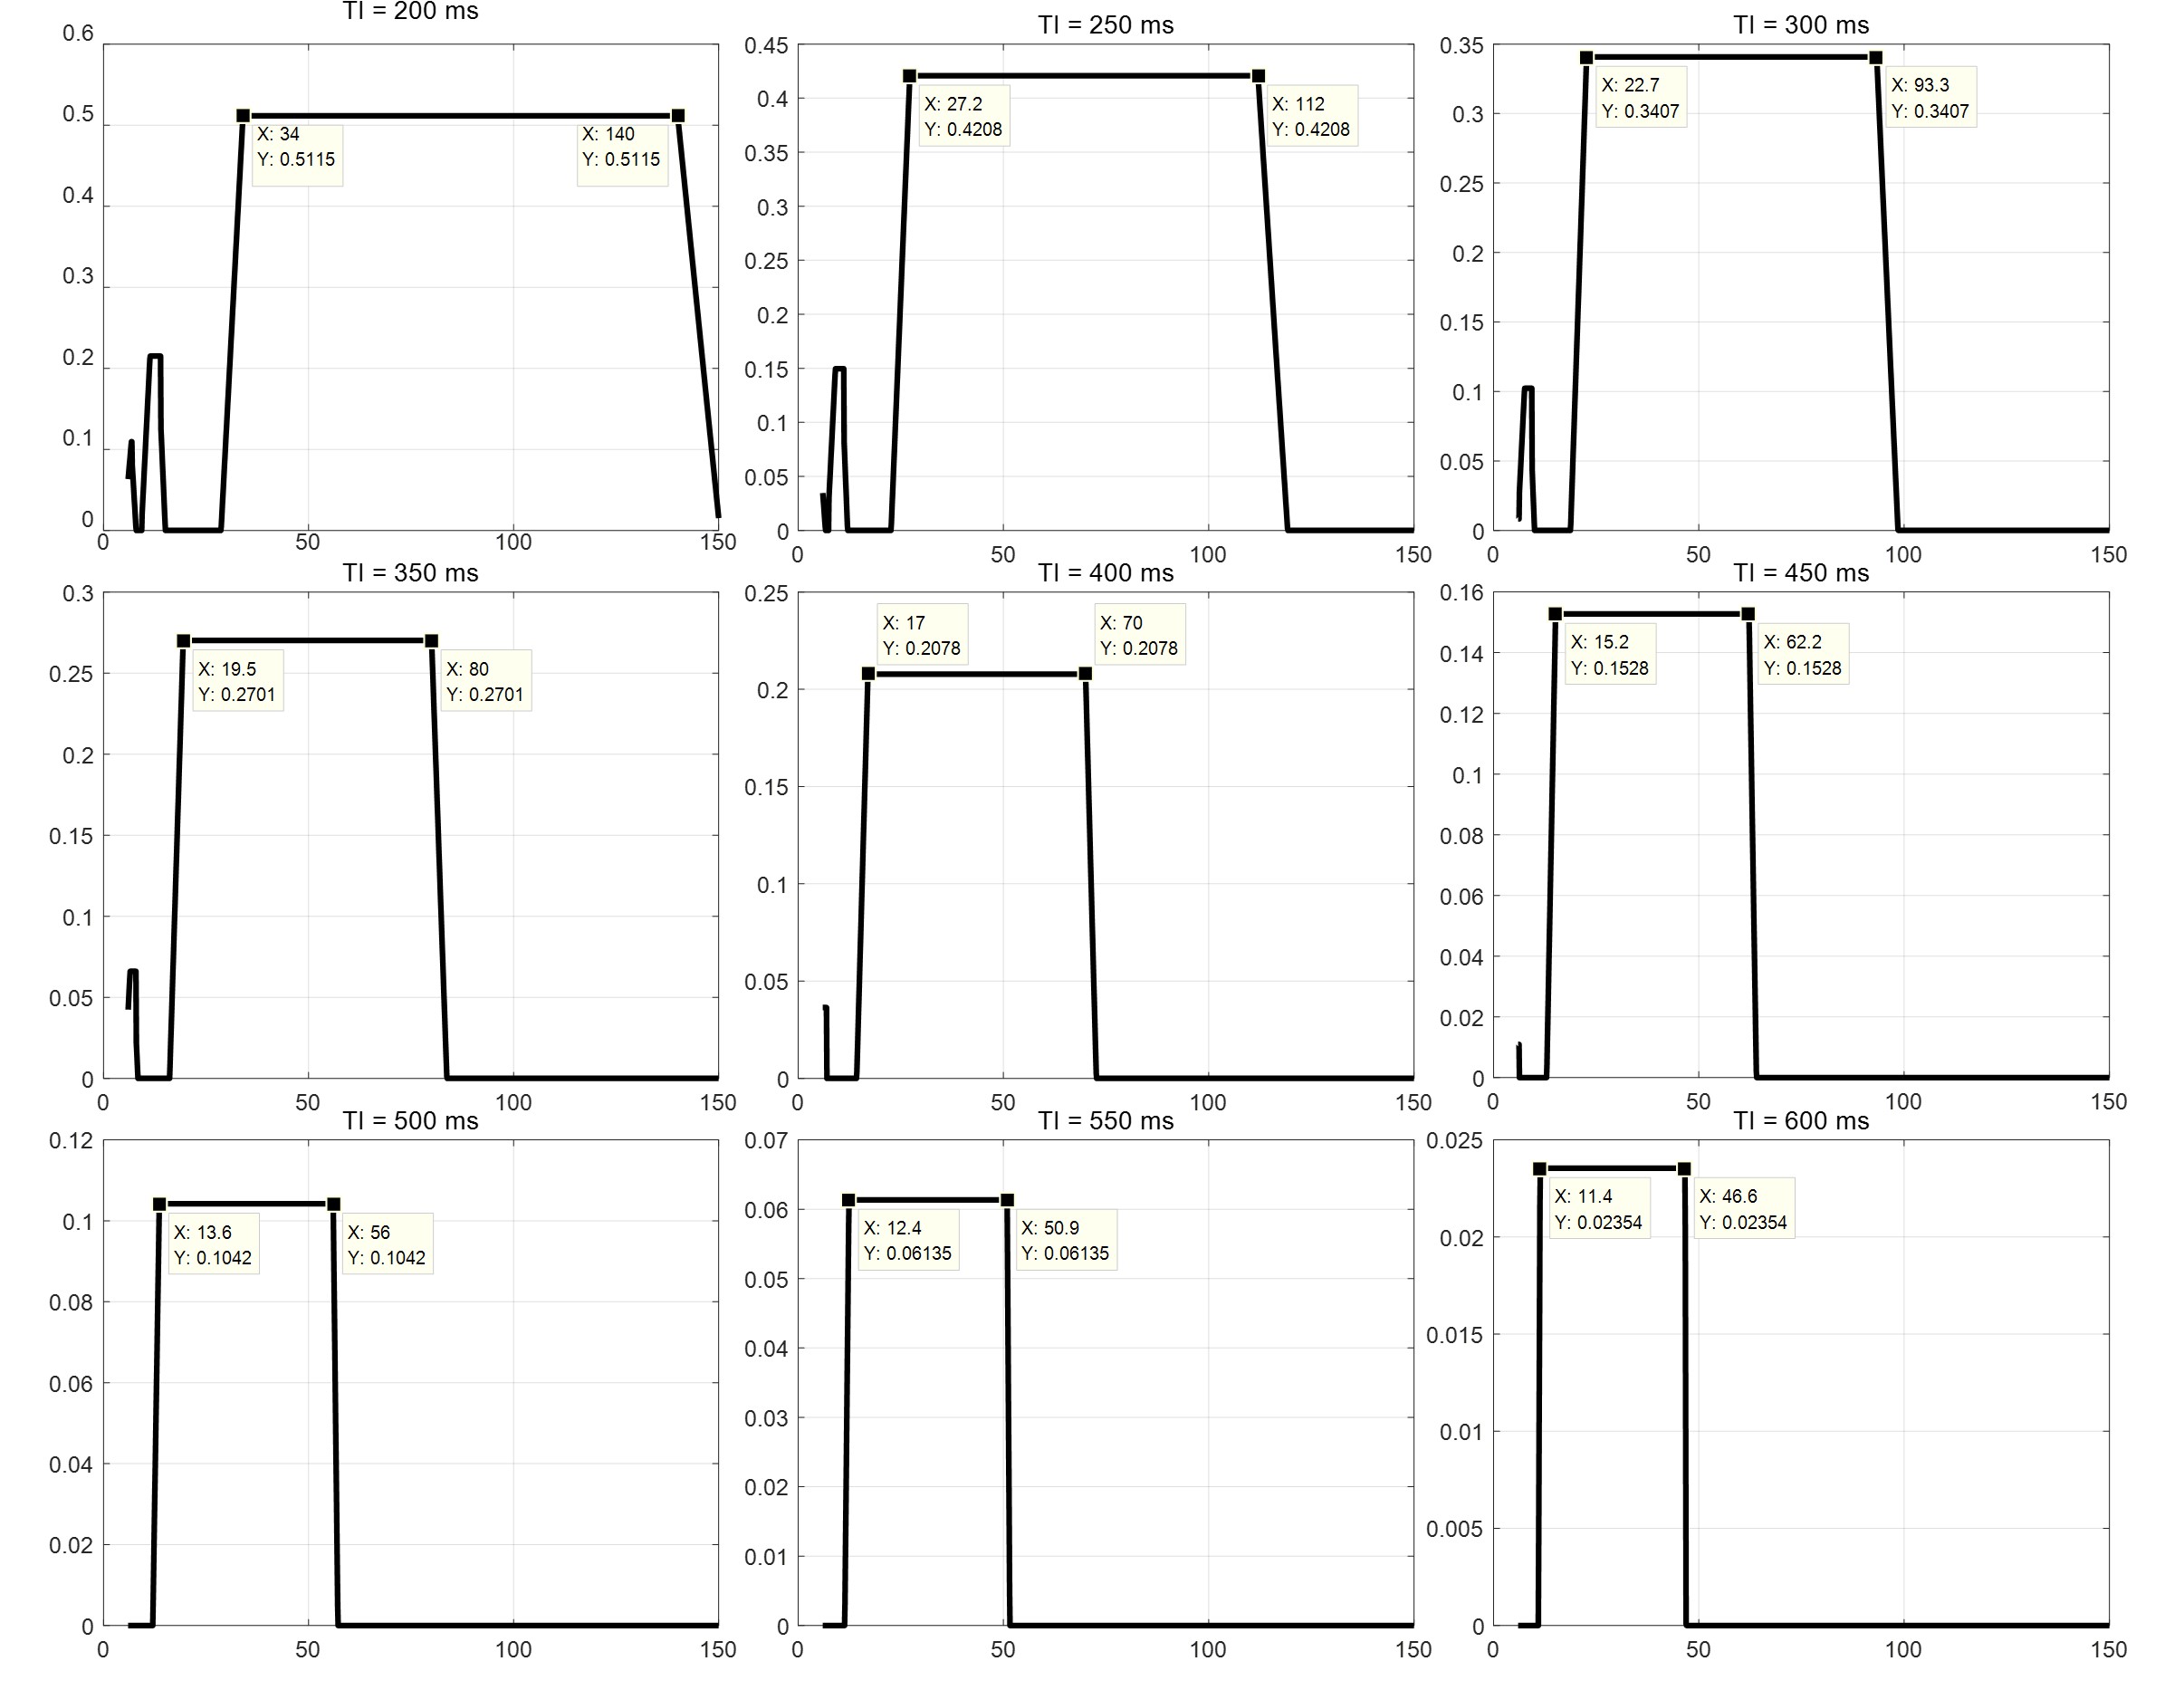
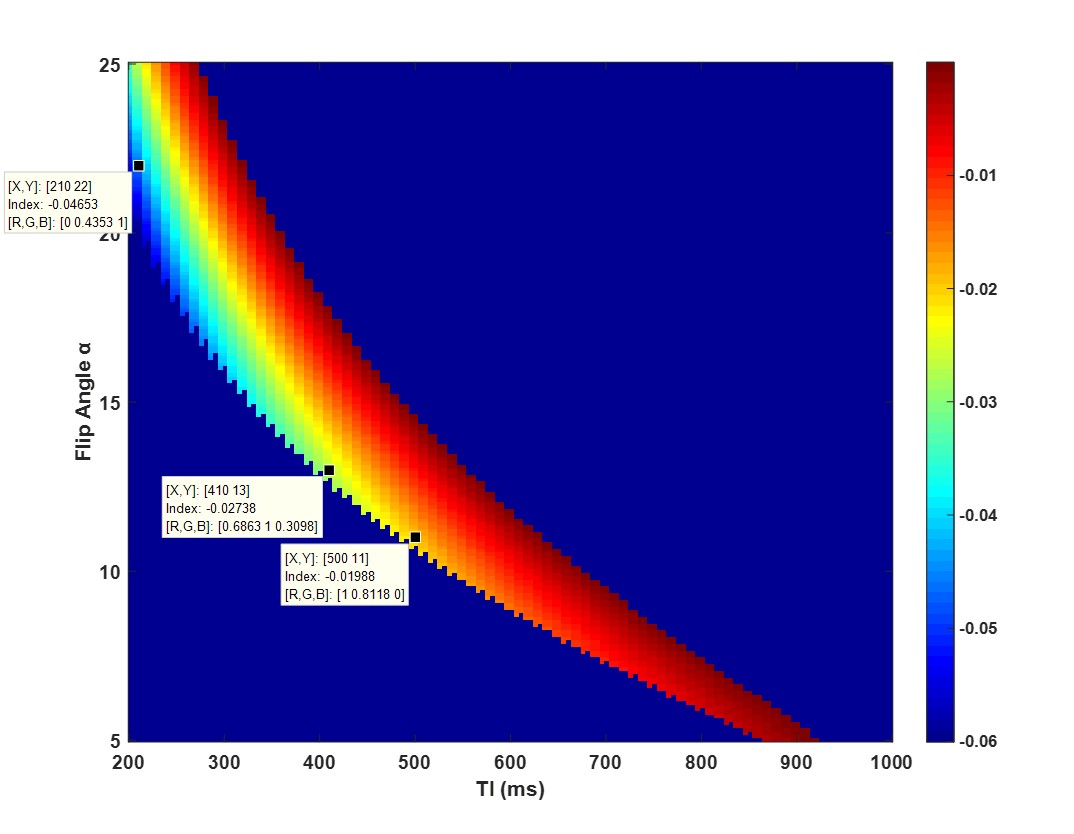
Simulation In the simulation conducted in Matlab (R2016a, Mathworks, Natick, MA), we fixed some sequence parameters (shown in Fig. 2a): TR=10 ms, Tgap=15 ms, Tex=5 ms, β=5°, IRTR=4*TI, IR slab thickness TIR=62 cm, imaging slab thickness Tsl=6 cm. The T1 and T2 for different tissues5, 6 are listed in Fig. 2c. Firstly we simulated the ideal SNAP signal evolution for the brain (Fig. 2b) with conventional scan parameters: TI=500 ms, α=11°. The following simulations were based on assumptions that blood flow is advection with a constant velocity, and the MR signal right after TI was regarded as the SNAP signal. We selected several different TI values ranging from 200 ms to 600 ms, and calculated the corresponding SNAP-MRA signal intensity with blood flow velocity ranging from 5 cm/s to 150 cm/s. For sequence optimization, TI values between 200-1000 ms and α between 5-25° were attempted.
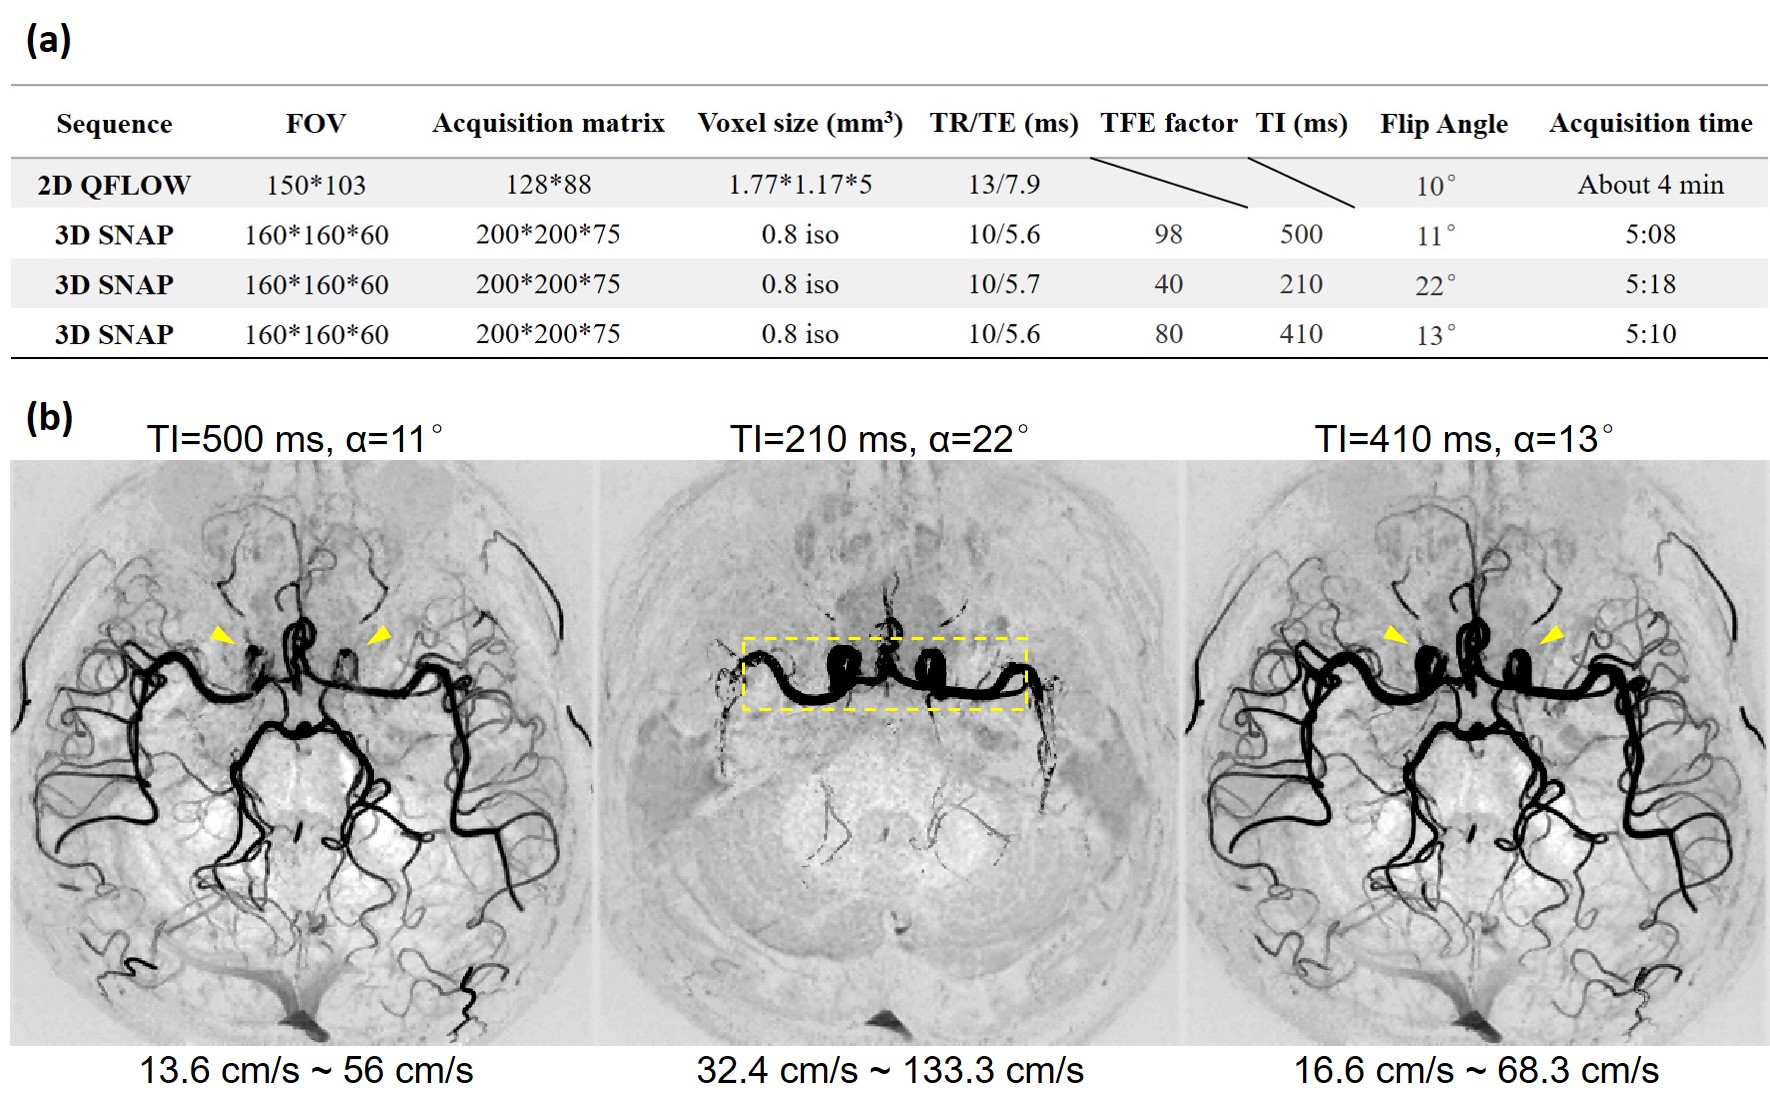
In-vivo validation The scans were performed on a Philips 3.0T Achieva TX MR scanner (Philips Healthcare, Best, The Netherlands) using an 32-channel SENSE head coil. Data were acquired from one healthy volunteer. Multiple SNAP sequences with different TI and α were scanned. A PPU-triggered 2D QFLOW sequence based on phase-contrast imaging was scanned to measure the actual blood flow velocity. The detailed scan parameters were listed in Fig. 5a. SNAP images were zero-padded in all directions to achieve 0.4 mm isotropic resolution. The SNAP-MRA images after phase-sensitive reconstruction and maximum intensity projection (MIP) were compared with each other to validate the conclusions of the simulation.
Results and Discussion
The simulation results of SNAP-MRA signal at different blood flow velocities are shown in Fig. 3. As the fast blood flow outside the IR slab may flow into the image slab without being inversed and the slow blood flow may be inversed for more than once before imaging, only the blood flow with velocities within an “interval” can generate a steady signal. The range of the “velocity interval” can be written as:
$$V\geq\frac{T_{IR}+T_{sl}}{2\cdot(IRTR+TI)}=\frac{62cm+6cm}{10\cdot{TI}}=\frac{6.8cm}{TI}\qquad{and}{\qquad}V\leq\frac{T_{IR}-T_{sl}}{2\cdot{TI}}=\frac{62cm-6cm}{2\cdot{TI}}=\frac{28cm}{TI}$$
which is consistent with previous work1, 4. Blood flow velocity outside the “velocity interval” will result in images like Fig. 1b. The simulation result of SNAP-MRA signal with different scan parameters (Fig. 4) shows that the SNAP-MRA signal can be enhanced by selecting a smaller TI and flip angle within a reasonable range.
The in-vivo SNAP-MRA images are shown in Fig. 5b. The 2D QFLOW sequence showed that the blood flow velocity through MCA was 17.3 cm/s. When TI=220 ms, this velocity is outside the “velocity interval” and its corresponding image contains few vessel branches like Fig. 1b. The image intensity of the third image is obviously higher than that of the first image and shows better image details (yellow arrowheads). Image intensity from the same ROI (yellow dotted box) of three images were added up respectively and compared, resulting in 1: 2.29: 1.42, which is highly consistent with the simulation results (marked in Fig. 4, 1: 2.34: 1.38).
Many previous works7-10 have found cerebral hemodynamic changes in neurodegenerative diseases. By scanning with appropriate parameters, intracranial SNAP-MRA can screen people with abnormal cerebral blood flow velocity, making it be potential in diagnosing of neurodegenerative diseases like Alzheimer’s disease and Parkinson’s disease.
Conclusion
This study shows the effects of blood flow velocity, TI and flip angle on intracranial SNAP-MRA. To acquire high quality intracranial SNAP-MRA images, TI should be determined according to the blood flow velocity, and flip angle can be determined subsequently for high SNAP-MRA signal intensity.Acknowledgements
No acknowledgement found.References
[1] Wang J, Börnert P, Zhao H, et al. Simultaneous noncontrast angiography and intraplaque hemorrhage (SNAP) imaging for carotid atherosclerotic disease evaluation[J]. Magnetic resonance in medicine, 2013, 69(2): 337-345.
[2] Wang J, Guan M, Yamada K, et al. In Vivo Validation of Simultaneous Non-Contrast Angiography and intraPlaque Hemorrhage (SNAP) Magnetic Resonance Angiography: An Intracranial Artery Study[J]. PloS one, 2016, 11(2): e0149130.
[3] Kellman P, Arai A E, McVeigh E R, et al. Phase-sensitive inversion recovery for detecting myocardial infarction using gadolinium-delayed hyperenhancement[J]. Magnetic resonance in medicine, 2002, 47(2): 372-383.
[4] Wang J, Ferguson M S, Balu N, et al. Improved carotid intraplaque hemorrhage imaging using a slab-selective phase-sensitive inversion-recovery (SPI) sequence[J]. Magnetic resonance in medicine, 2010, 64(5): 1332-1340.
[5] Noeske R, Seifert F, Rhein K H, et al. Human cardiac imaging at 3 T using phased array coils[J]. Magnetic resonance in medicine, 2000, 44(6): 978-982.
[6] Wansapura J P, Holland S K, Dunn R S, et al. NMR relaxation times in the human brain at 3.0 tesla[J]. Journal of magnetic resonance imaging, 1999, 9(4): 531-538.
[7] Nobili F, De Carli F, Frisoni G B, et al. SPECT predictors of cognitive decline and Alzheimer's disease in mild cognitive impairment[J]. Journal of Alzheimer's Disease, 2009, 17(4): 761-772.
[8] Binnewijzend M A A, Kuijer J P A, Benedictus M R, et al. Cerebral blood flow measured with 3D pseudocontinuous arterial spin-labeling MR imaging in Alzheimer disease and mild cognitive impairment: a marker for disease severity[J]. Radiology, 2013, 267(1): 221-230.
[9] Klohs J, Rudin M, Shimshek D R, et al. Imaging of cerebrovascular pathology in animal models of Alzheimer's disease[J]. Frontiers in aging neuroscience, 2014, 6.
[10] Kara F, van Dongen E S, Schliebs R, et al. Monitoring blood flow alterations in the Tg2576 mouse model of Alzheimer's disease by in vivo magnetic resonance angiography at 17.6 T[J]. Neuroimage, 2012, 60(2): 958-966.
Figures