4792
A powerful Matlab software platform for assessment of streamlined methods involved in quantification of MR myocardial perfusion1Univ Lyon, INSA‐Lyon, Université Claude Bernard Lyon 1, UJM-Saint Etienne, CNRS, Inserm, CREATIS UMR 5220, U1206, F-69621, Villeurbanne, France, Villeurbanne, France, 2Univ Lyon, INSA‐Lyon, UJM-Saint Etienne, Université Claude Bernard Lyon 1,CNRS, Inserm, CREATIS UMR 5220, U1206, F-42023, SAINT-ETIENNE, France, Saint-Etienne, France
Synopsis
Quantification of myocardial perfusion by MRI requires a wise combination of advanced and complex techniques from images acquisition, segmentation, deconvolution and/or modelling prior deriving perfusion indexes estimations. Accuracy/reproducibility of measures are crucial for medical diagnostic but rely on the optimization of many algorithms. Hence, the latter techniques at each step shall be made available to the community, challenged and improved for optimal state-of-the-art implementation. We propose a software platform that can easily integrate any methods addressing issues or limitations at each step of the process, integrating sharpened tools for precise assessment of individual step to global pipeline performances.
Background and purpose
CMR perfusion Imaging is a powerful technique to identify visually ischemia and recently, has proven its capability to quantify myocardial perfusion1,2. However quantification requires several complex steps from image acquisition to the deconvolution and/or modeling. Their combination in a reconstruction pipeline will allow calculation of perfusion or tissues indexes . Numerous methods have been published without a reference implementation or consensus on their performances, making difficult to evaluate the global performance and achieving more reproducible and useful research in turn fastening transfer to clinical routine. We developed a platform enabling to easily build a customized pipeline by integrating any technique and providing a large panel of tools to assess, compare, and visualize results at each steps of the workflow. Moreover, its flexibility enables to integrate external tools.Software description
The platform provides a user interface composed of thumbs referred as activities dedicated for specific works listed below:
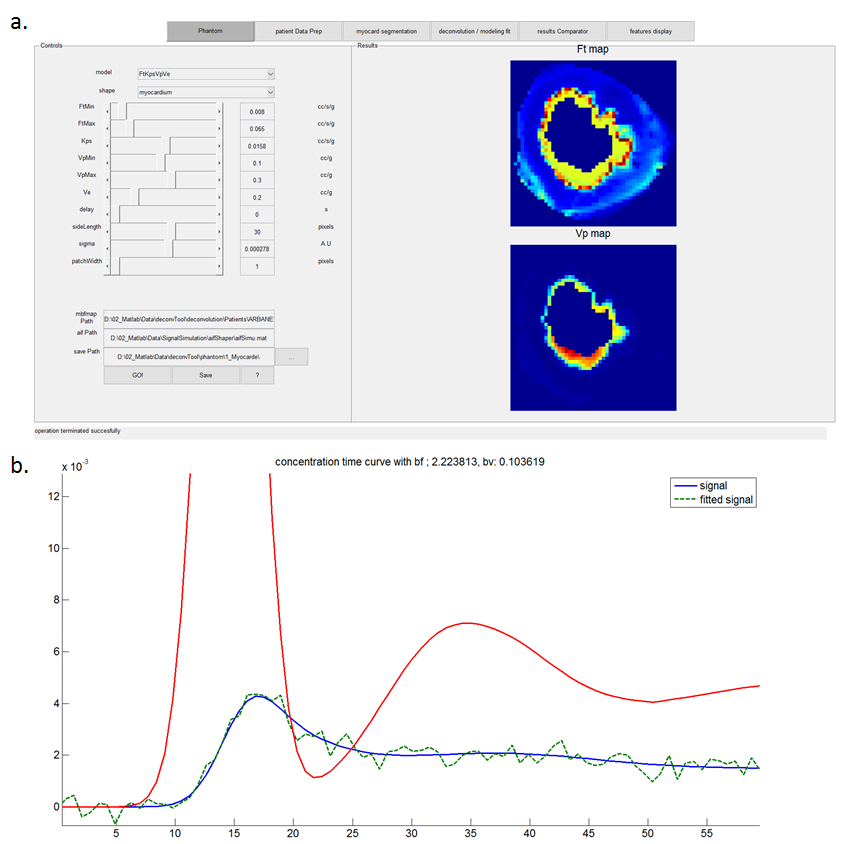
Phantom generation:
This workbench enables to generate a set of perfusion time intensity/concentration curves from a user defined modelling, a range of perfusion indexes, delay and SNR. The dataset shape is by default squared but can be realistic being full of interest for spatio-temporal based methods3. As many models are available, and many of them have already been developed and validated by Physiome, our platform is connected to jSim4 to use its simulation engine, generating dataset with a strong precision guarantee.
Patient data Preparation:
This workbench is dedicated to pre-processing of clinical datasets acquired with dual-delay saturation recovery TurboFlash sequence5 before processing of perfusion indexes extraction. It includes: coil heterogeneity correction, automated Arterial Input Function (AIF) extraction, manual definition of myocardium, conversion on time intensity curves (TIC) to time concentration curve, semi-automatic AIF fit, and finally the image series display were user can visually check time concentration curve of any voxel of the myocardium.
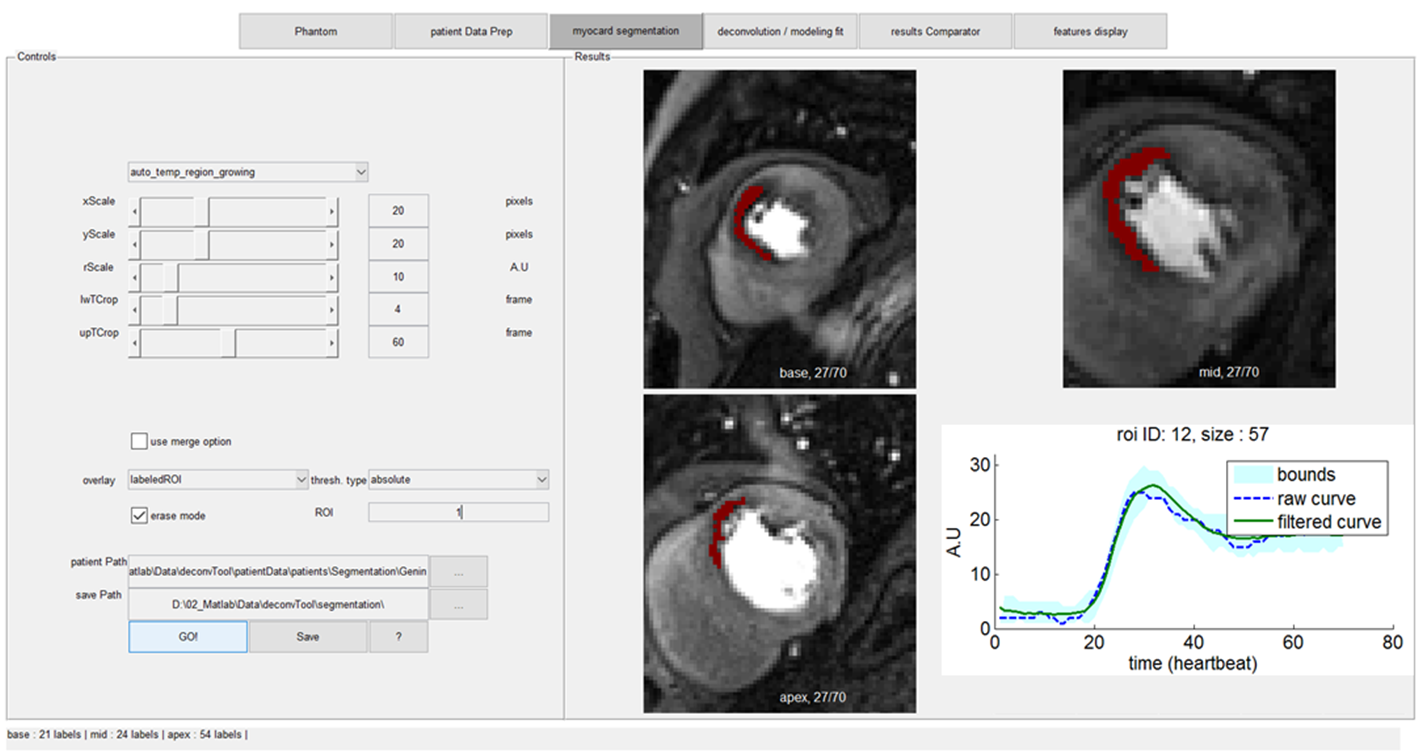
Myocardium segmentation:
Lesion classification enables myocardial tissue segmentation including simple methods such as bullseye representation6, but also more advanced methods like automated region growing and Spatio Temporal Mean Shift7.
Segmentation results are then displayed, and it is possible to easily check the segmentation mask region by region over image series and even to manually correct possible imperfections, due to under/over segmentation errors of automated algorithms.
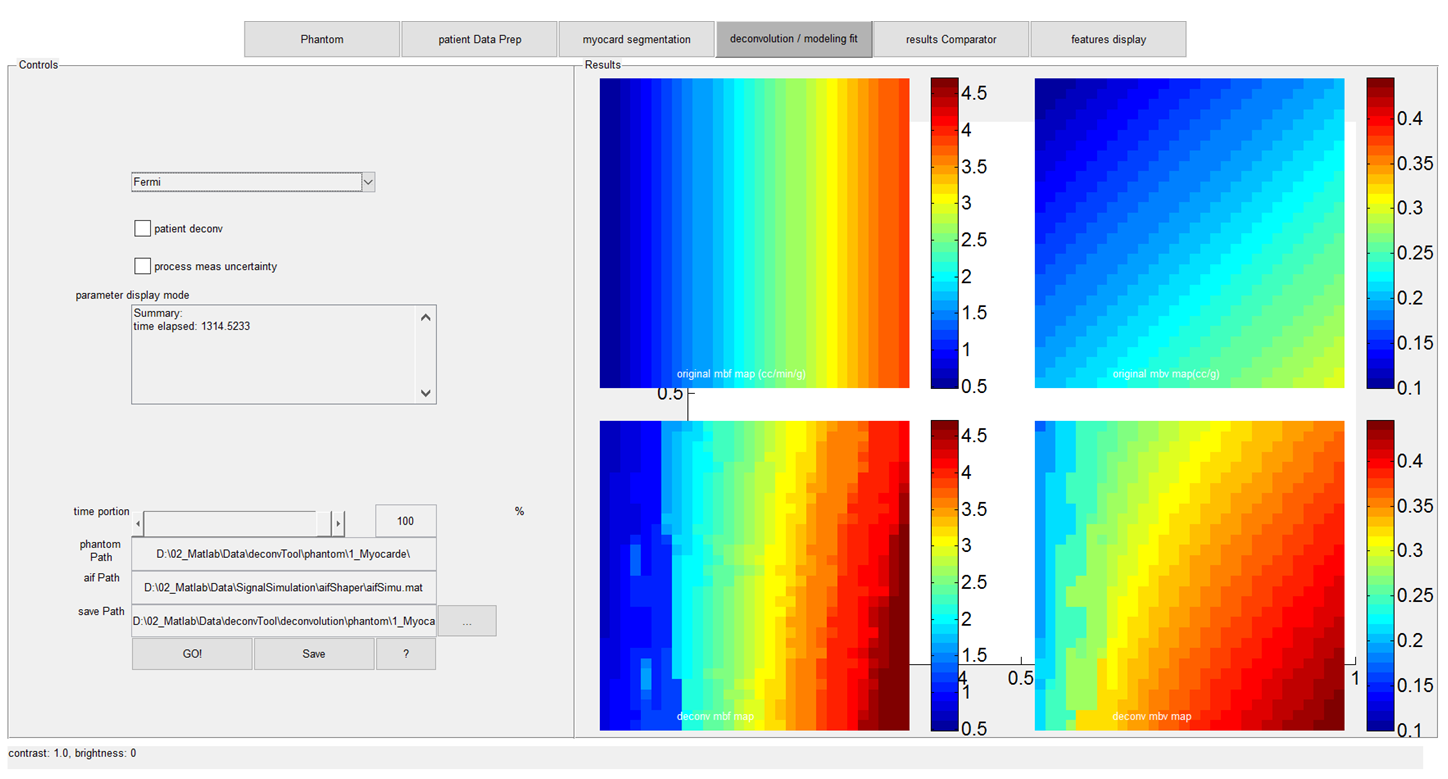
Data deconvolution/modeling fit:
This thumb provides a large number of linear shift invariant (LSI) techniques for processing perfusion parameters estimation. Among proposed approaches are Fermi function, and spatio-temporal5 approaches but also modelling fit that can be combined with a previous LSI processing to save processing time and constrain modelling. Because of large amount of data this step is often time consuming but was widely reduced by parallel processing implementation. Architecture was designed to process either synthetic data, produced by phantom generation workbench for assessing techniques performances or on clinical dataset having been preprocessed with “patient data preparation” workbench. Furthermore, in the case of clinical dataset, if segmentation step was processed, the ROI average signal is also deconvolved.
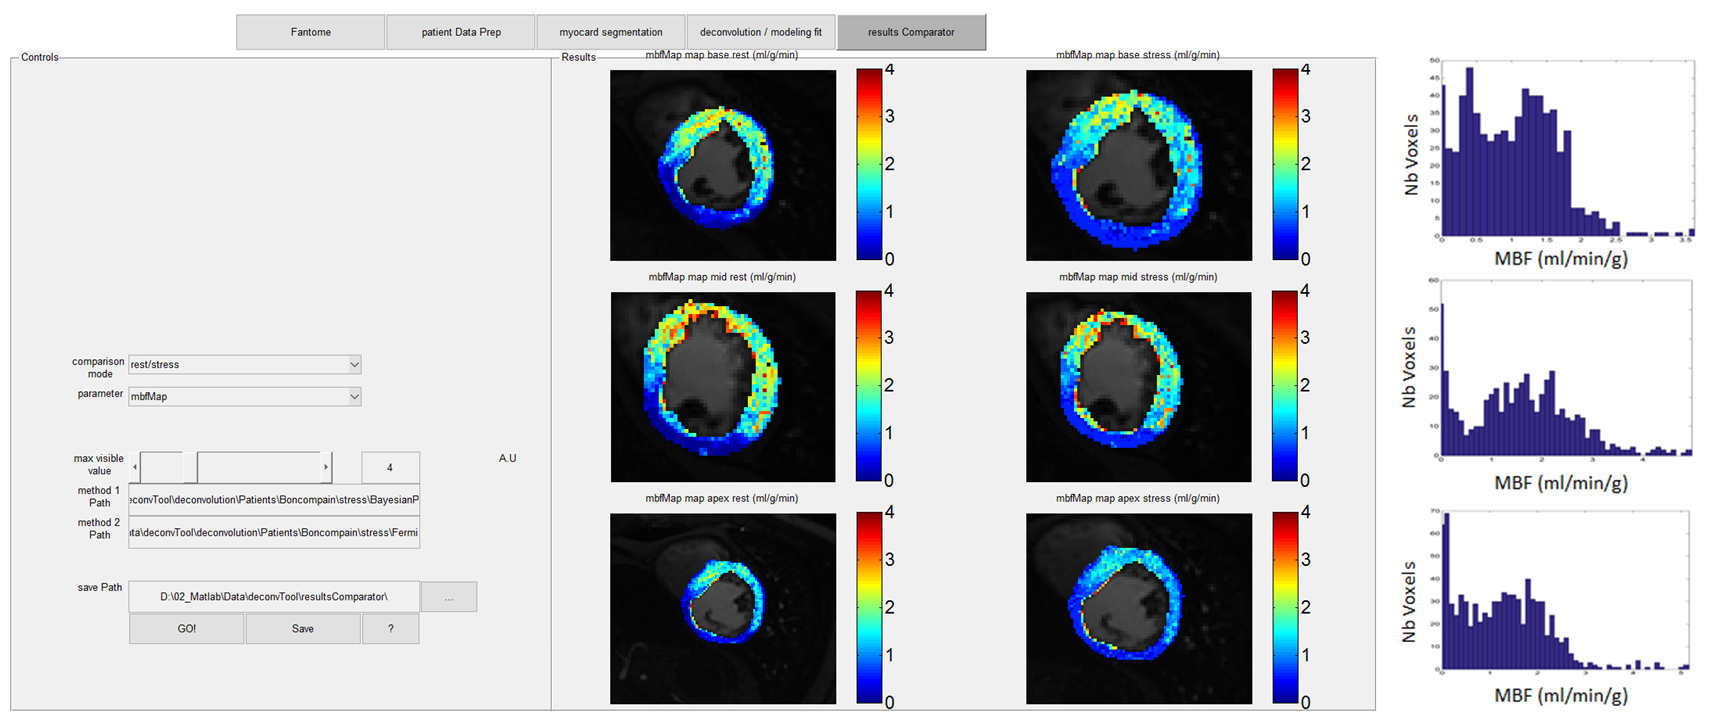
Results Viewer:
Even if previous workbenches provide useful tooltips, perfusion data observation requires more tools to sharpen comprehension. These observations can be enabled by the result viewer. Results produced by previous workbenches can be analyzed at this step for various purposes:
- Methods comparison: the perfusion indexes estimated maps by 2 different methods can be displayed alongside and plotted on Bland-Altman graphs.
- Rest-stress: if measurement was carried out on both rest and stress acquisition series, it is possible to display slices results side by side. As in this case the dynamics indexes values can be very different it is also possible to adapt color map helping for comprehension.
- Histogram plots: perfusion indexes can also be displayed as histograms
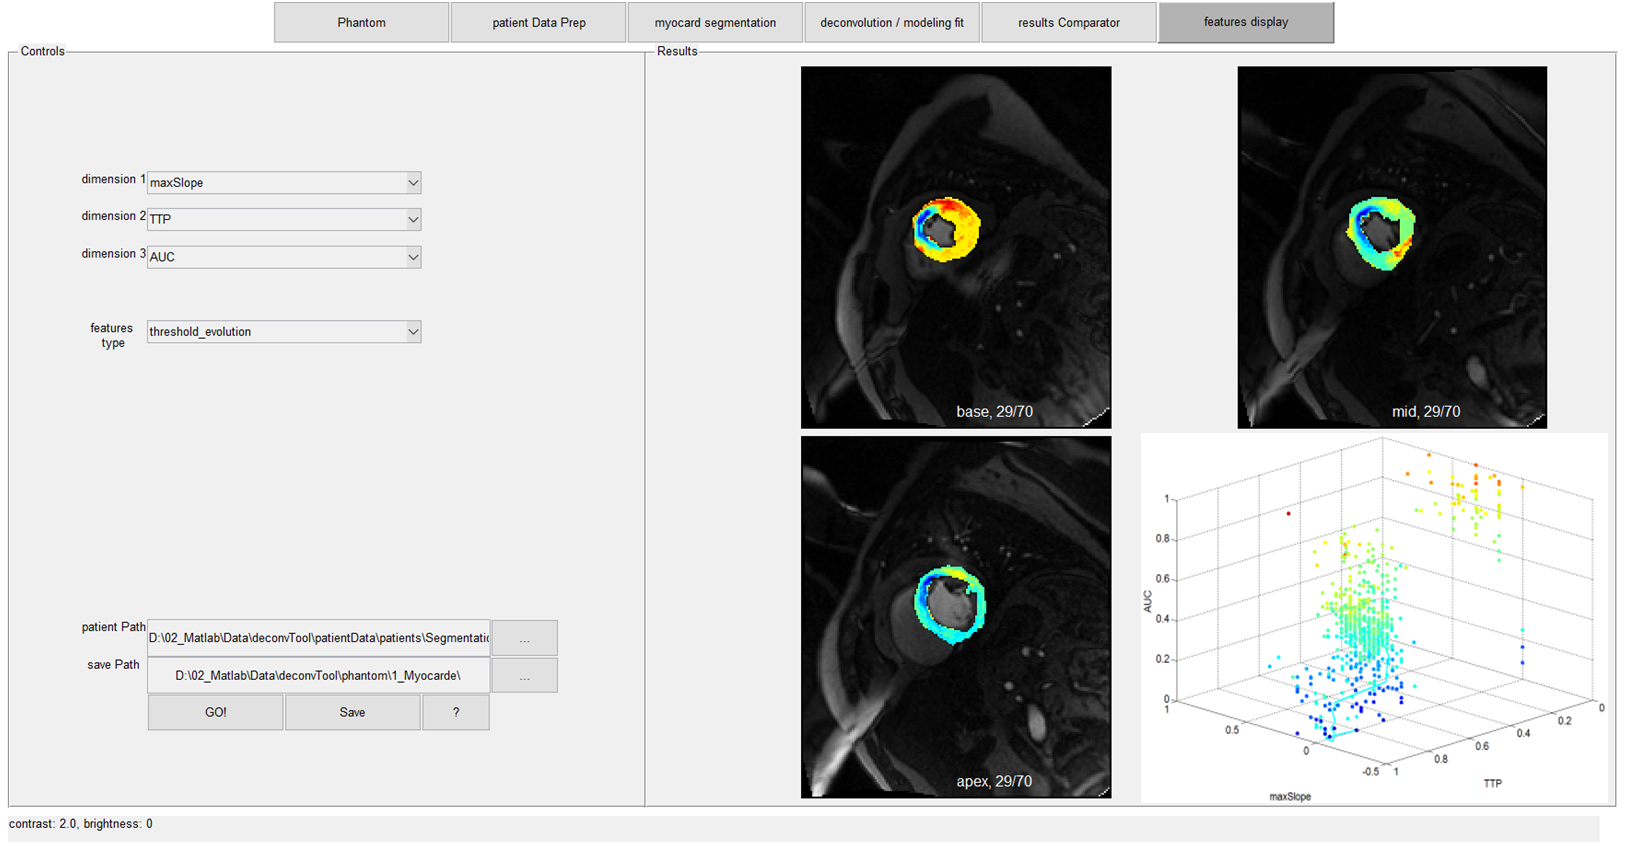
Features display:
In addition to the results viewer, we provide an original way to display features of TIC in a dedicated features space. Available features are: Time To Peak, Peak Value, Maximum Slope, Area Under the Curve, ROI Surface, Maximum Slope Position. The features can be calculated from myocardium voxels or from user defined ROI TIC. This visualization approach is worth for patient myocardial perfusion understanding.
Discussion
This vendor agnostic solution can be used on any DICOM data and provides useful sharpened tools for comprehension of complex phenomenon involved in myocardial perfusion. It enables to build a customized perfusion indexes quantification pipeline and numerous ways to evaluate its performance, but also offers original observation possibilities, improving heart disease knownledge, while fostering collaborative research in the field of quantitative CMR perfusion and tissue analysisAcknowledgements
No acknowledgement found.References
1. Lee D, Johnson N. Quantification of Absolute Myocardial Blood Flow by Magnetic Resonance Perfusion Imaging, JACC : Cardiovascular imaging .2, n° 6 , 2009 2. Engblom H, Xue H, Akil S, et al. Fully quantitative cardiovascular magnetic resonance myocardial perfusion ready for clinical use: a comparison between cardiovascular magnetic resonance imaging and positron emission tomography Journal of Cardiovascular Magnetic Resonance (2017) 19:78 3. Frindel C, Robini M, and Rousseau D, A 3-D spatio-temporal deconvolution approach for MR perfusion in the brain, Medical Image Analysis 18, 144–160, 2014 4. Butterworth E, Jardine BE, Raymond GM, et al. JSim, an open-source modeling system for data analysis F1000Research 2014, 2:288 5. Gatehouse P, Elkington A, Ablitt N et al. Accurate Assessment of the Arterial Input Function during High-Dose Myocardial Perfusion Cardiovascular Magnetic Resonance. . Journal of Cardiovascular Magnetic Resonance Imaging 2004;20:39-45 6. Cerqueira M, Weissman N, Dilsizian V, et al. Standardized myocardial segmentation and nomenclature for tomographic imaging of the heart: A statement for healthcare professionals from the Cardiac Imaging Committee of the Council on Clinical Cardiology of the American Heart Association, Circulation, vol. 105, no. 4, pp. 539–542, 2002 7. Mure S, Grenier T, Meier D., Guttmann C, et al. Unsupervised spatio-temporal filtering of image sequences. A mean-shift specification, Pattern Recognition Letters, vol. 68, Part 1, p. 48 - 55, 2015.Figures