4791
Python graphical user interface with deep learning-based segmentation for cardiac LV analysis1Samsung Medical Center, Sungkyunkwan University School of Medicine, Seoul, Republic of Korea, 2Department of Computer Science and Engineering, Sogang University, Seoul, Republic of Korea
Synopsis
The purpose of this study is to develop a deep learning algorithm for myocardial segmentation and apply it to a Python graphical user interface for cardiac MR image processing and analysis. We used a U-net architecture to simultaneously segment endocardial and epicardial borders. For training data, we used publicly available data and our internal data, both of which are from cardiac cine imaging. When the trained model was used in our Python GUI, myocardial segmentation exhibited moderate accuracy in cine data as well as in perfusion data.
Introduction
Recently, deep learning-based segmentation algorithms have been developed for automatic cardiac left ventricle (LV) image analysis1,2. Most of the deep learning libraries have been implemented in Python programming language (e.g., Tensorflow, Keras, and Theano). Myocardial segmentation involves the tedious work of annotating endocardial and epicardial borders. Hence, the development of an automatic and accurate segmentation algorithm is important for quantitative analysis of cardiac data. The objective of this study is to develop a Python graphical user interface software that supports 1) user-interactive analysis of cardiac cine, perfusion, LGE, and T1 mapping data and 2) automatic myocardial segmentation based on deep learning.
Methods
Data acquisition: Dicom datasets were acquired on a 1.5T scanner (Siemens Avanto, Erlangen, Germany). For test data, we used cardiac MR data from 20 patients (15M/5F, age 55 ± 8 years, 10 patients with hypertrophic cardiomyopathy, 8 patients with coronary artery disease, and 2 patients with chest discomfort). We considered 4 sequences in the development of our user interface: cine, perfusion, LGE, and T1 mapping.
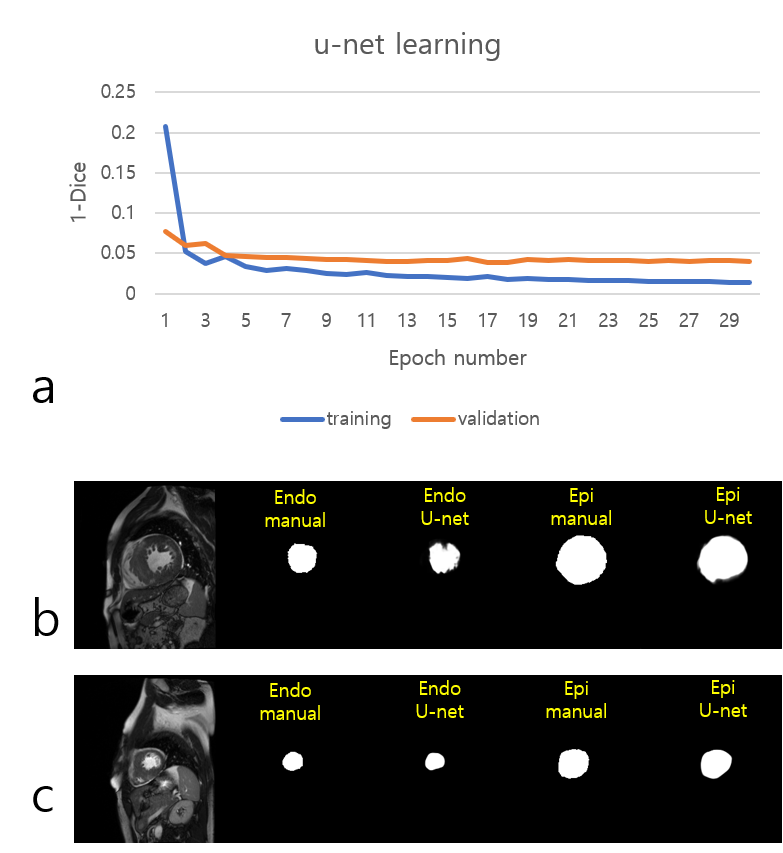
Deep learning-based segmentation: We adopted a u-net3 architecture for simultaneous segmentation of epicardial and endocardial masks. For u-net training, the publicly available York data4 (n=33) and our internal data (n=15) were used. After data augmentation using grid deformation, the total number of images was 6963, including the entire slice range (from apical to basal) and systolic/diastolic frames. 39 subjects were used for training and 9 subjects were used for validation. The combined use of the data helped increase the volume of our training data and reduce the time for data labeling. The u-net model training was modified from Dong et al.’s implementation5 in TensorLayer and tested on an 8GB GPU (NVIDIA GeForce GTX 1080). For training, we used the following parameters: epochs = 30, batch size = 4, Adam optimizer with learning rate = 0.0001 and beta = 0.9. The loss was plotted with respect to the number of epoch (see Figure 1). After training, we saved the u-net model and used it for the segmentation tasks of our Python graphical user interface.
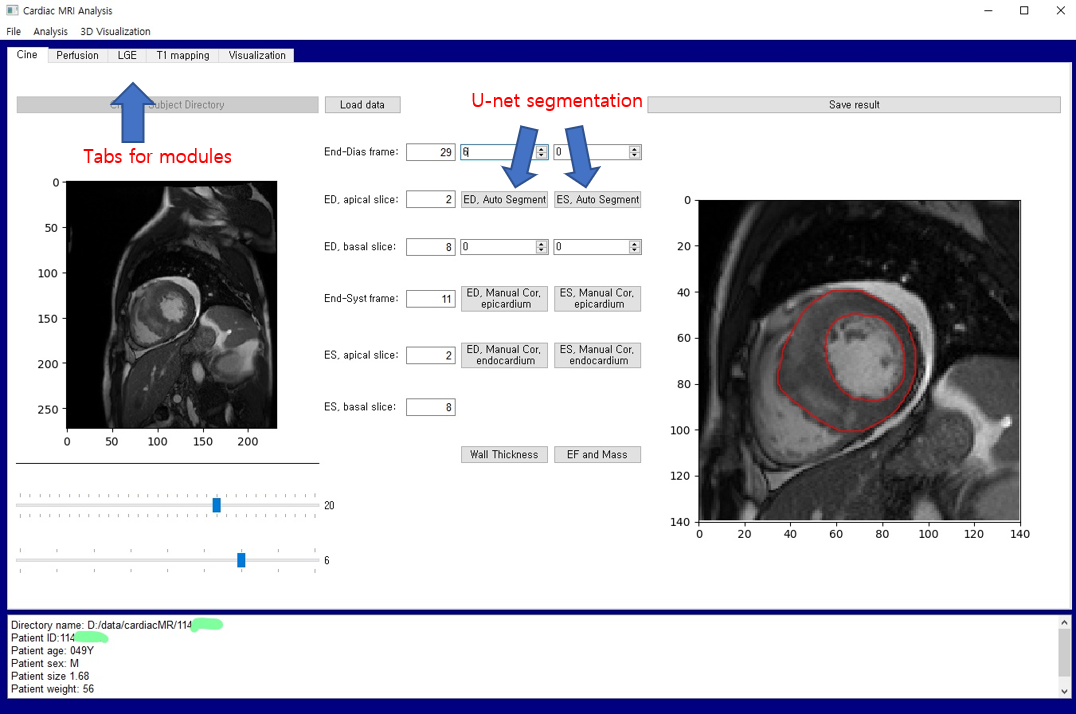
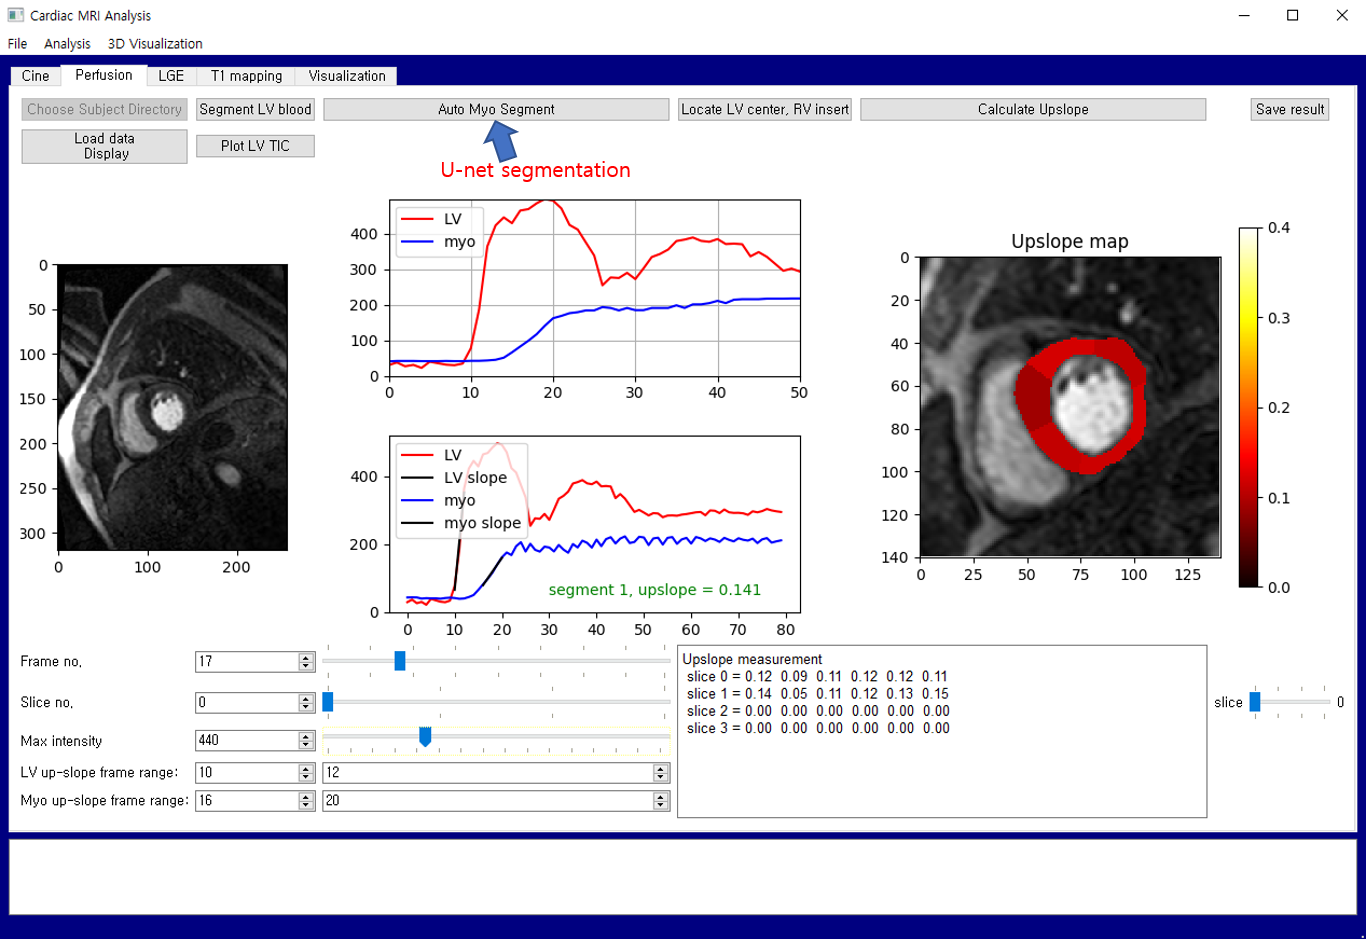
Graphical user interface: The method was implemented using Python 3.5 and PyQt 5 libraries on Microsoft Windows operating systems. Figure 2 shows an example GUI layout for cine data analysis. The trained u-net model was loaded for segmentation of the myocardium. Automatic segmentation was performed after a user’s click on the button (see Figures 2 and 3).
Results
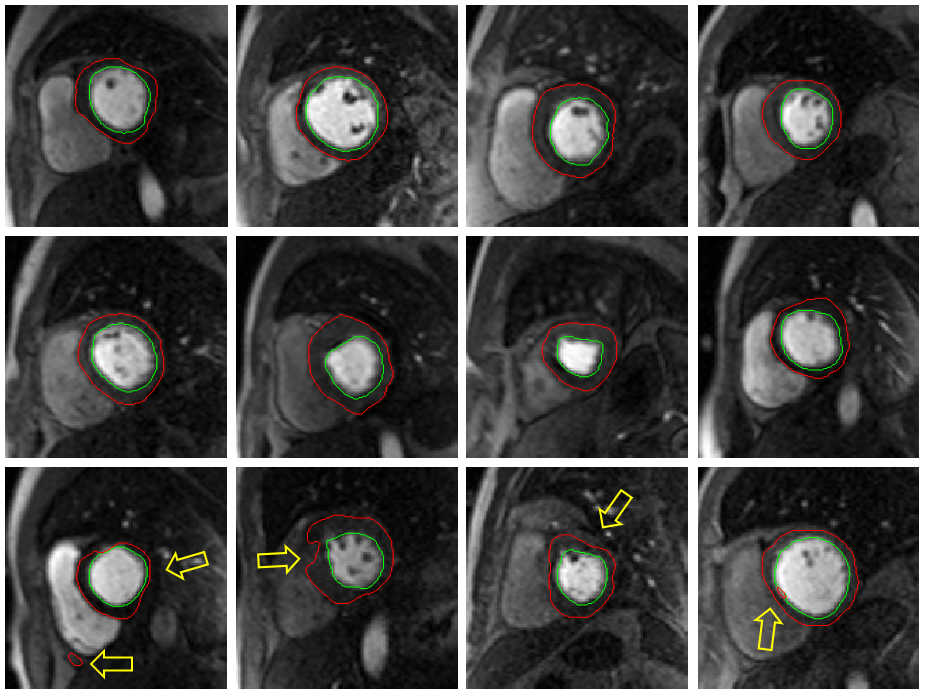
Figure 1 shows the 1-Dice vs. epoch plot. Dice indicates Dice similarity coefficient ranging from 0 to 1. The learning curve shows a monotonic decrease pattern in training data. The learning is stabilized after 5 epochs in the internal validation data. We also compared the quantitative results between our software and commercial software (Agus, Siemens Medical Solutions) in cardiac cine data. LV EDV, LV ESV, LV EF, and LV mass were highly correlated with correlation coefficients of 0.95, 0.97, 0.95, and 0.99, respectively. The U-net segmentation model, which was trained based on cardiac cine data, exhibited moderate performance in more challenging cardiac perfusion data with Dice similarity coefficient of (mean ± sd) = 0.77 ± 0.07 (see Figure 4 for segmentation results).
Discussion
The u-net segmentation was effective in segmenting the myocardium. It helped reduce time and effort for myocardial segmentation compared to manual annotation of the myocardial contours. We only used 48 subjects for u-net training, and we plan to increase the number of subjects for u-net training as we process more subjects with our Python GUI. We also plan to train a u-net model with cardiac perfusion dataset and apply it to perfusion data to evaluate segmentation accuracy. Although not shown in the abstract, we developed a user-interactive functionality for manual contour correction which is compatible with the PyQt-based GUI. This is helpful in fine-tuning the myocardial contours.
Conclusion
The deep learning-based segmentation was effective in automatic segmentation of the myocardium for cardiac cine and perfusion analysis in an in-house Python graphical user interface.Acknowledgements
This work was supported by Basic Science Research Program through the National Research Foundation of Korea (NRF) funded by the Ministry of Science, ICT, and Future Planning (Grant Number: 2015 R1C1A1A02036340).References
1. M. R. Avendi, A. Kheradvar, and H. Jafarkhani, “A combined deep-learning and deformable-model approach to fully automatic segmentation of the left ventricle in cardiac MRI,” Med Image Anal, vol. 30, pp. 108-119, (2016).
2. Tan, Li Kuo, et al. "Convolutional neural network regression for short-axis left ventricle segmentation in cardiac cine MR sequences." Med Image Anal, vol. 39, pp. 78-86, (2017).
3. Ronneberger, O., Fischer, P., & Brox, T. U-net: Convolutional networks for biomedical image segmentation. In International Conference on Medical Image Computing and Computer-Assisted Intervention (pp. 234-241). Springer, Cham (2015).
4. Andreopoulos, Alexander, and John K. Tsotsos. "Efficient and generalizable statistical models of shape and appearance for analysis of cardiac MRI." Med Image Anal, vol. 12, pp. 335-357, (2008).
5. Dong, H., Yang, G., Liu, F., Mo, Y., & Guo, Y. Automatic Brain Tumor Detection and Segmentation Using U-Net Based Fully Convolutional Networks. arXiv preprint arXiv:1705.03820 (2017).
Figures