4785
Real-World Clinical Performance of Deep Learning for Quantification and Segmentation of Biventricular Cardiac Size and Function1Radiology, UC San Diego, San Diego, CA, United States, 2UC San Diego, San Diego, CA, United States, 3Arterys, Inc, San Francisco, CA, United States
Synopsis
In this study of routine clinical cardiac MRIs performed for a typical range of clinical indications, we examined the effectiveness of deep learning (DL) for real-world automated quantitative analysis of cardiac size and biventricular function. We find that automated measurements correlate well with skilled readers. While the variation between DL quantification and experts lie within the range seen between experts, there remain several observed failure modes which may benefit from expert supervision. The combination of DL automation with specialist oversight may reduce the time burden of manual segmentation, improve physician efficiency, and promote technique accessibility.
Introduction
Cardiovascular magnetic resonance imaging (cMRI) is the clinical gold standard for quantifying ventricular size and function for both the left and right heart. Currently in clinical practice, cardiac measurements are made with manual contouring of the endocardial boundaries, a time-consuming technique that requires considerable expertise. Automated measurement of cardiac size with traditional machine learning techniques has been elusive, but deep learning (DL) with convolutional neural networks (CNN) shows promise. For example, a recent study by Avendi et al illustrated successful use of a CNN for automated right ventricle segmentation of the MICCAI segmentation challenge database1. Here, we have tested a FDA cleared commercial CNN designed to automate cardiac measurements, and assessed its performance on biventricular segmentation of routine clinical cMRIs spanning diverse pathologies.Methods
With HIPAA-compliance and IRB approval, we retrospectively identified two hundred sequential cMRI examinations that were performed on a 1.5T scanner between June 2015 and June 2017, for which cardiac volumes were measured as part of the routine clinical exam. Manual clinical measurements were performed by a board-certified radiologist or imaging fellow with dedicated cardiovascular imaging fellowship training. Automated analysis was performed using a 2D U-Net CNN (CardioDL 2.3, Arterys, San Francisco, CA). Automated studies were visually inspected for errors and the type error (too many or few slices, non-anatomical shape or location), location (base, mid, apex), and phase of cardiac cycle (systole or diastole) were noted. Measurements generated by the software were compared to manually-contoured measurements using a Pearson’s r correlation, and included ejection fraction (EF) and end diastolic (EDV) and systolic volumes (ESV) for both left and right ventricles (LV, RV). Dice scores were calculated between DL and expert contours at diastole for 50 cases.Results
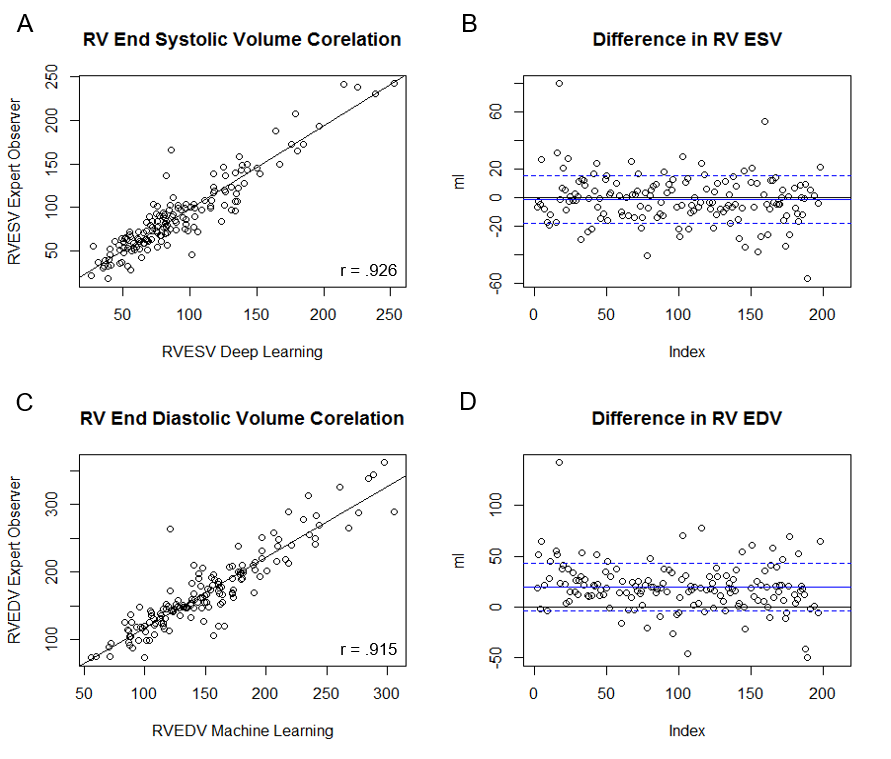
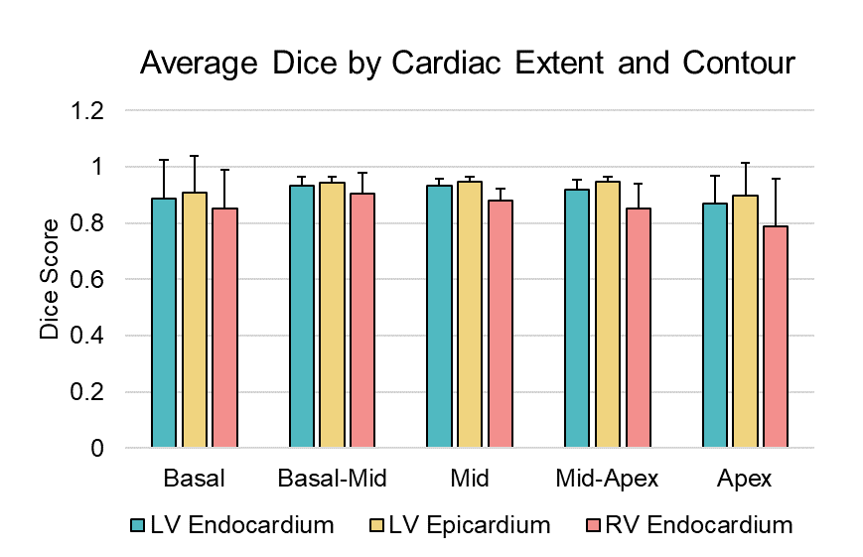
DL was able to generate suggested contours in 98.5% of the cases for LV endocardium, 98% of cases for LV epicardium, and 80% of cases for the RV epicardium. LV function was strongly correlated between DL and manual measurements, with positive correlations between ESV (r= 0.985), EDV (r= 0.972), and EF (r=0.938). On average, DL generated LV ESV was 9.8% higher than manual measurements with SD +/- 12.3%, and EDV averaged 13.7% higher with SD +/- 7.9%. RV function metrics were also well correlated, with positive correlations between RVEDV (r= 0.915), RVESV (r= 0.926), and RVEF (r=0.732). On average DL generated RV ESV was 5.3% lower than manual with SD +/- 24.7%, and RV EDV was 10.7% higher than manual with SD +/-13.1%. In the assessment of DL contour accuracy, the largest proportion of errors (73% of total noted errors) was seen at the cardiac base. Comparison of Dice scores between DL and expert were, on average, 0.90. For LV endocardium, Dice was 0.91 with SD +/- 0.09, for LV epicardium 0.93 with SD +/- 0.08, and for RV endocardium 0.86 with SD +/- 0.12. Regional differences were also observed in Dice scores. The lowest Dice scores were localized at the basal (0.88) and apical slices (0.85), compared to mid-ventricular slices (0.92).Discussion
In this study of cMRIs performed for a typical range of clinical indications, cardiac metrics generated by DL correlate well to those performed by skilled readers in routine clinical practice. Differences between DL and the expert readers are comparable to the range of variability among experts reported in the literature2,3. Further, when DL generated inaccurate contours they were predominantly seen at the cardiac base and apex, the areas that produce the most contour variation among expert readers4,2. Despite its performance, the occasional failure to generate a contour and difficulty with basal and apical slices indicates the need for expert review to confirm and refine where DL errs.Conclusions
The cardiac metrics generated by DL automation are well correlated to those of skilled readers, and within the range of normal inter-reader variations. The combination of DL automation with specialist oversight may reduce the time burden of manual segmentation, improve physician efficiency, and promote technique accessibility.Acknowledgements
No acknowledgement found.References
1. Avendi, M. R., Kheradvar, A. & Jafarkhani, H. Automatic segmentation of the right ventricle from cardiac MRI using a learning-based approach. Magn. Reson. Med. (2017). doi:10.1002/mrm.26631
2. Suinesiaputra, A. et al. Quantification of LV function and mass by cardiovascular magnetic resonance: multi-center variability and consensus contours. J. Cardiovasc. Magn. Reson. 17, 63 (2015).
3. Catalano, O. et al. Intra-observer and interobserver reproducibility of right ventricle volumes, function and mass by cardiac magnetic resonance. J. Cardiovasc. Med. 8, 807–814 (2007).
4. Bonnemains, L. et al. Assessment of right ventricle volumes and function by cardiac MRI: Quantification of the regional and global interobserver variability. Magn. Reson. Med. 67, 1740–1746 (2012).
Figures