4784
Deep Learning for Automated Medical Image Quality Assessment: Proof of Concept in Whole-Heart Magnetic Resonance Imaging1Advanced Clinical Imaging Technology, Siemens Healthcare AG, Lausanne, Switzerland, 2Institute of Bioengineering/Center for Neuroprosthetics, École Polytechnique Fédérale de Lausanne (EPFL), Lausanne, Switzerland, 3Department of Radiology, University Hospital (CHUV) and University of Lausanne (UNIL), Lausanne, Switzerland, 4LTS5, École Polytechnique Fédérale de Lausanne (EPFL), Lausanne, Switzerland, 5Center for Biomedical Imaging (CIBM), Lausanne, Switzerland, 6Division of Cardiology and Cardiac MR Center, University Hospital of Lausanne (CHUV), Lausanne, Switzerland, 7Department of Radiology and Medical Informatics, University Hospital of Geneva (HUG), Geneva, Switzerland
Synopsis
We aim at developing a fully automated algorithm which quantitatively gauges the quality of medical images using deep learning to mimic human perception. An automated image quality assessment algorithm based on a deep convolutional neural regression network is designed, optimized, trained, validated and tested on a clinical database of 3D whole-heart cardiac MRI scans. The algorithm was successfully trained and validated, yielding a regression performance in the range of the intra- and inter-observer agreement. These results show the relevance of deep learning concepts to image quality analysis, in particular to volumetric cardiac MR imaging.
Introduction
Image quality (IQ) assessment is of major importance in medical imaging. Usually, IQ is either assessed visually, by a human expert, or measured with one or more mathematical quantitative metrics: e.g. signal-to-noise ratio or conspicuity of anatomical structures. Human observers are preferred in a clinical context, as they can adapt the concept of IQ to the imaging modality, protocol, body part and diagnosis. Although several algorithms have been published, which provide the automated assessment of a mathematical metric, one of the challenges is to produce numerical values that could directly correlate with the expert visual perception. The purpose of this work is therefore to develop a fully automated algorithm that quantitatively gauges the quality of a specific subset of medical images by employing a deep convolutional neural network to mimic human perception.
Materials and Methods
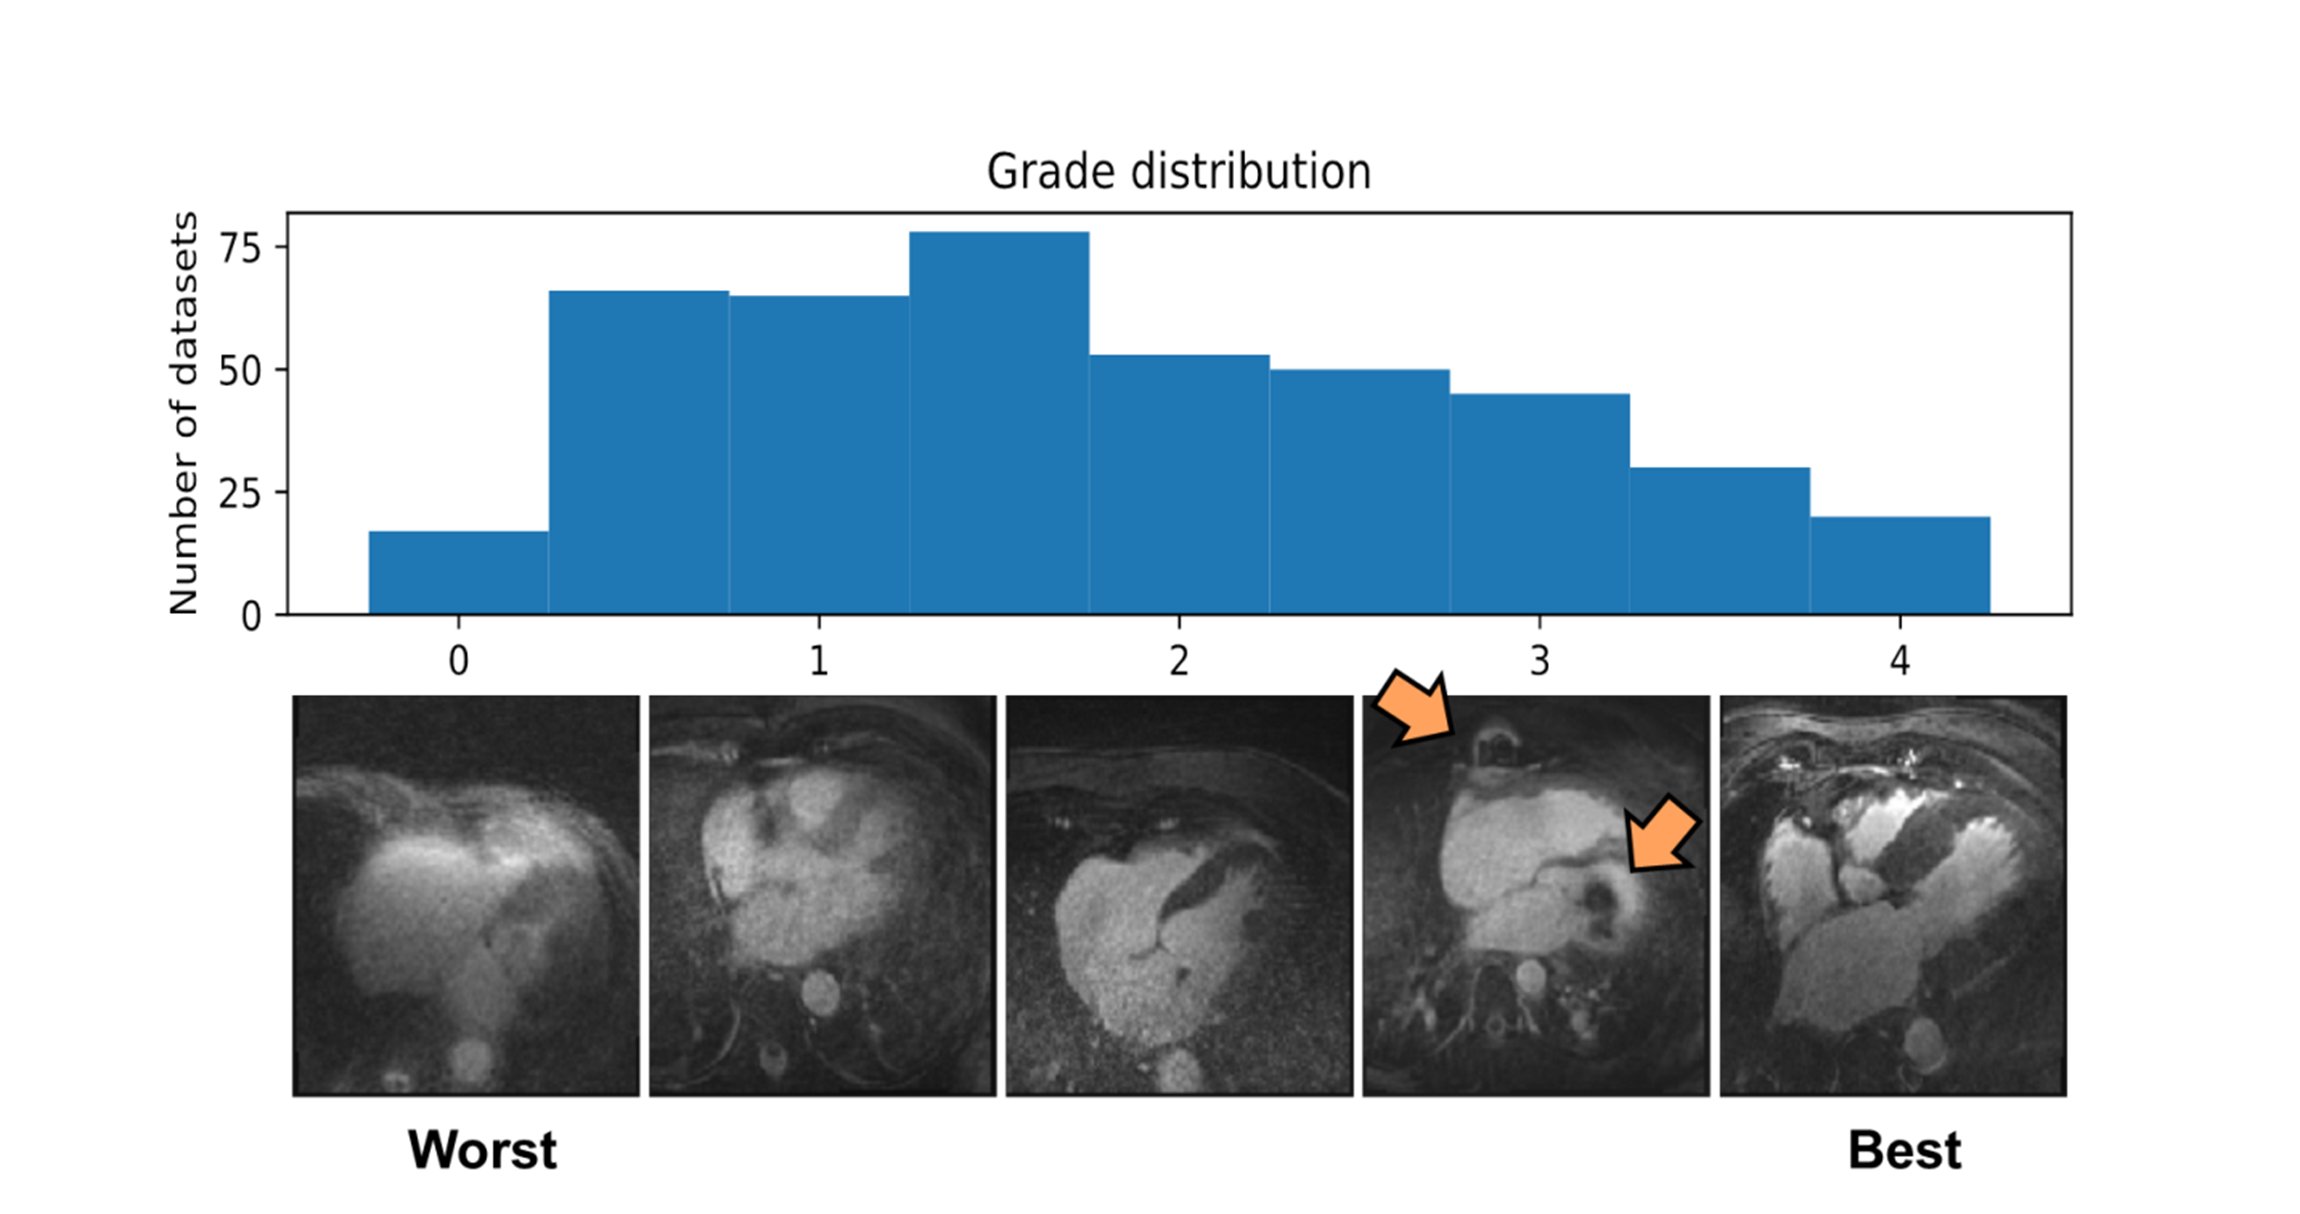
A clinical database of 3D isotropic whole-heart MR image volumes was used (average FOV (210mm)3 and spatial resolution (1mm)3). All scans were acquired on a 1.5T clinical MR scanner (MAGNETOM Aera, Siemens Healthcare, Erlangen Germany) using a prototype respiratory self-navigated sequence [1-3]. A total of N=424 patients (33.5% female, age:57±18), encompassing a large variety of pathologies, were randomly selected. A reference standard IQ grading was established by one expert reader (10 years of experience in CMRA) using an image quality scale from 0 to 4 as proposed in [3], but with 0.5 grade steps for increased dynamic range.
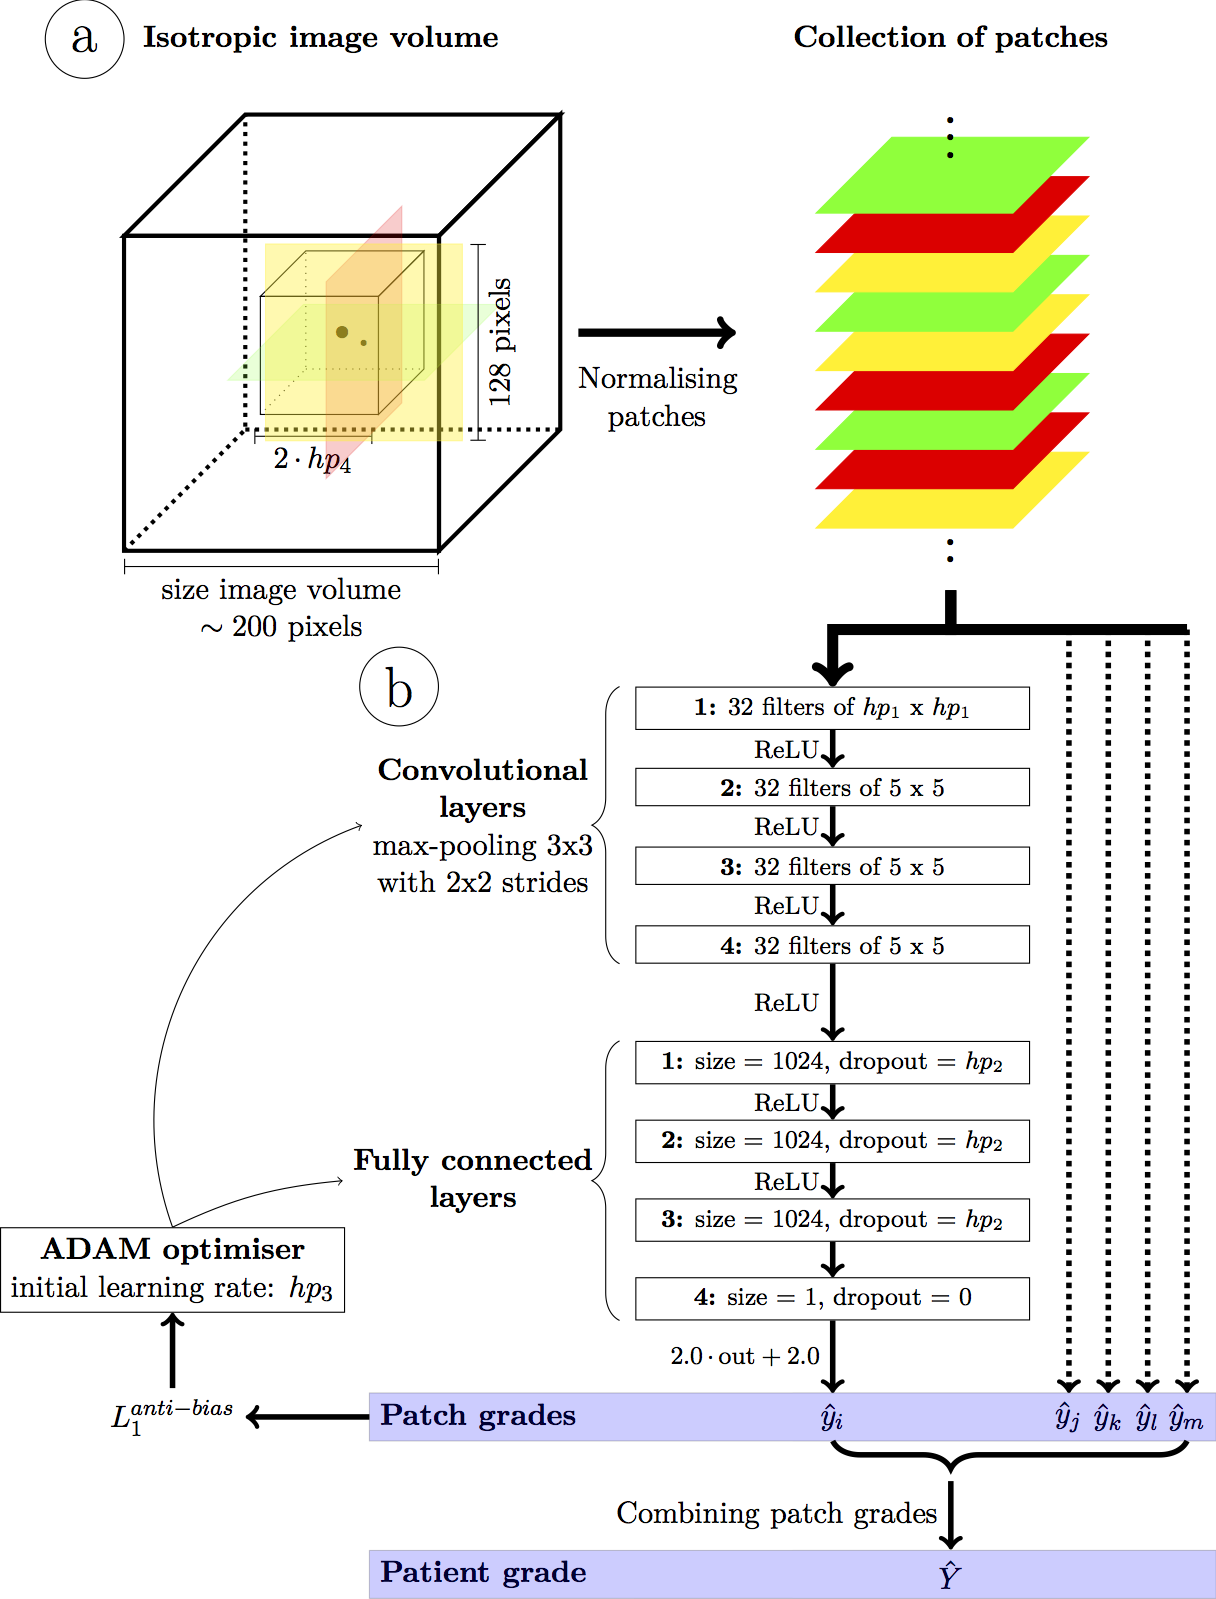
A deep convolutional neural network (Fig.1) was designed to achieve fully automated IQ assessment. Input: Two-dimensional patches of size 128x128 pixels were extracted from the isotropic volumes in transversal, sagittal and coronal orientations within a cube of a given size centered on the heart (center of the FOV). This was a trade-off between the computational demands and the amount of information within each patch. All patches were normalized using the average pixel intensities of the whole volume to improve learning efficiency while preserving global intensity information. Network: A deep convolutional neural network was designed with 4 convolutional layers (32 filters and max-pooling within a 3x3 neighborhood with strides of 2x2) followed by 3 fully connected layers. Output: A final regression layer was preferred over a classifier because the intrinsic links between the quality grades (i.e. grade 1 is closer to 0 than to 4) are missing in classification layers. This layer combines the extracted image features into a single quantitative IQ value. Training and Testing: First, the database was split into distinct training (Ntr=324) and test (Nte=100) sets with similar grade and gender distributions. Before training the network, Ntr was further split into three equal parts for hyperparameter optimization using threefold cross-validation. The best network was then trained on all training images and evaluated on the test set. Mini-batches of 500 randomly selected patches within Ntr were fed to the network at each iteration. An optimizer minimized an anti-biasing L1 loss function to compensate for the non-uniform grade distribution. Finally, the patch quality grades were combined into a single grade using the mean of the patch grades in each patient. The network’s performance was computed and visualized as a box-plot of the network’s quality estimation against the expert reference standard. Correlation coefficients, linear regression and weighted kappa statistics were calculated. Finally, the resulting variability was compared with the inter- and intra-observer variability. Therefore, the Nte=100 datasets were assessed by another expert reader (4 years of experience), as well as a second time by the first expert reader.
Results
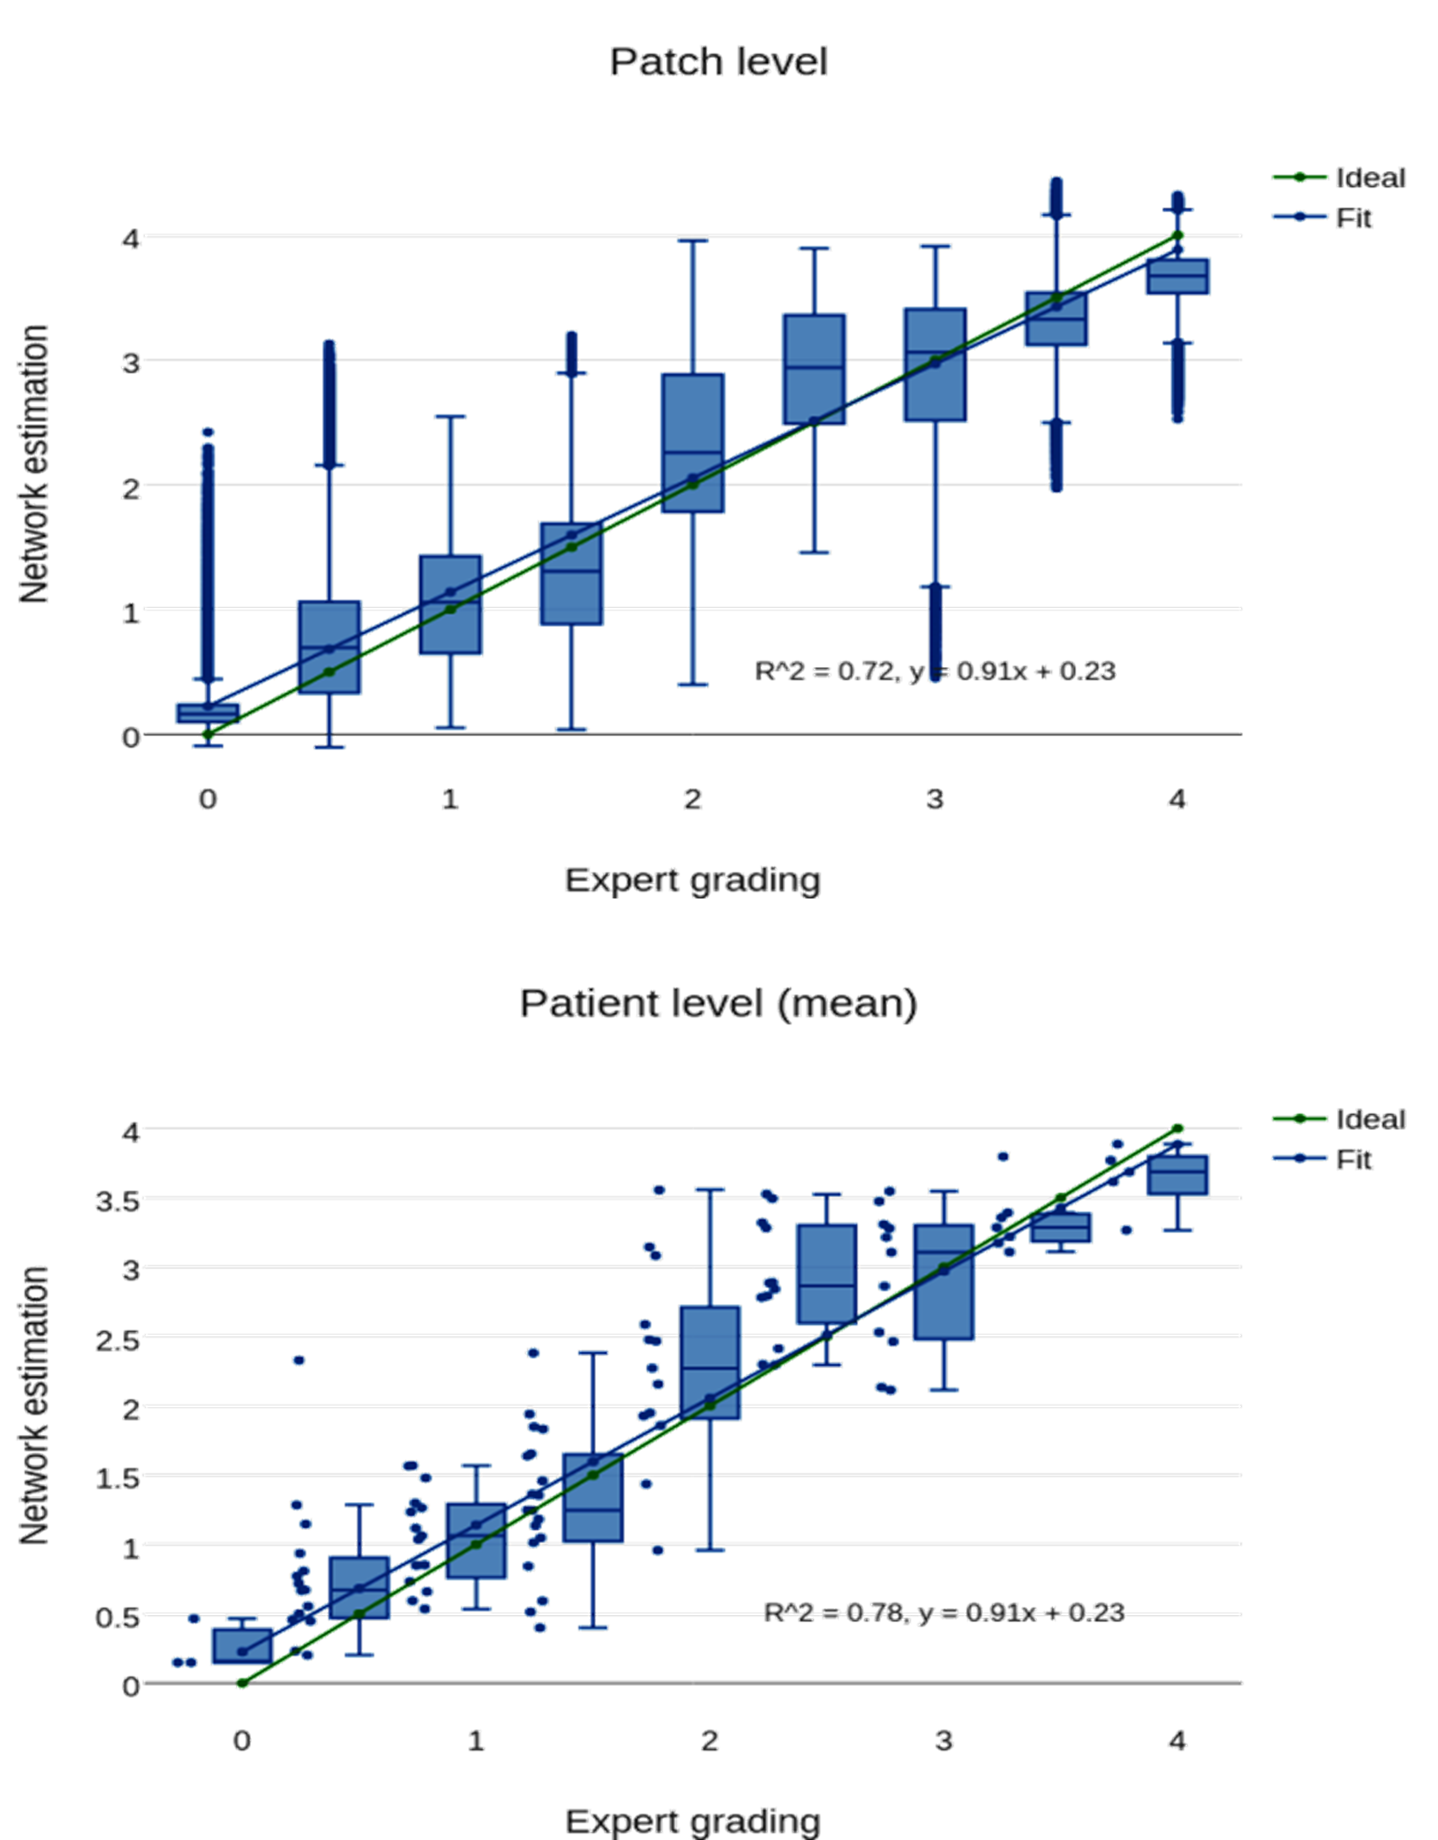
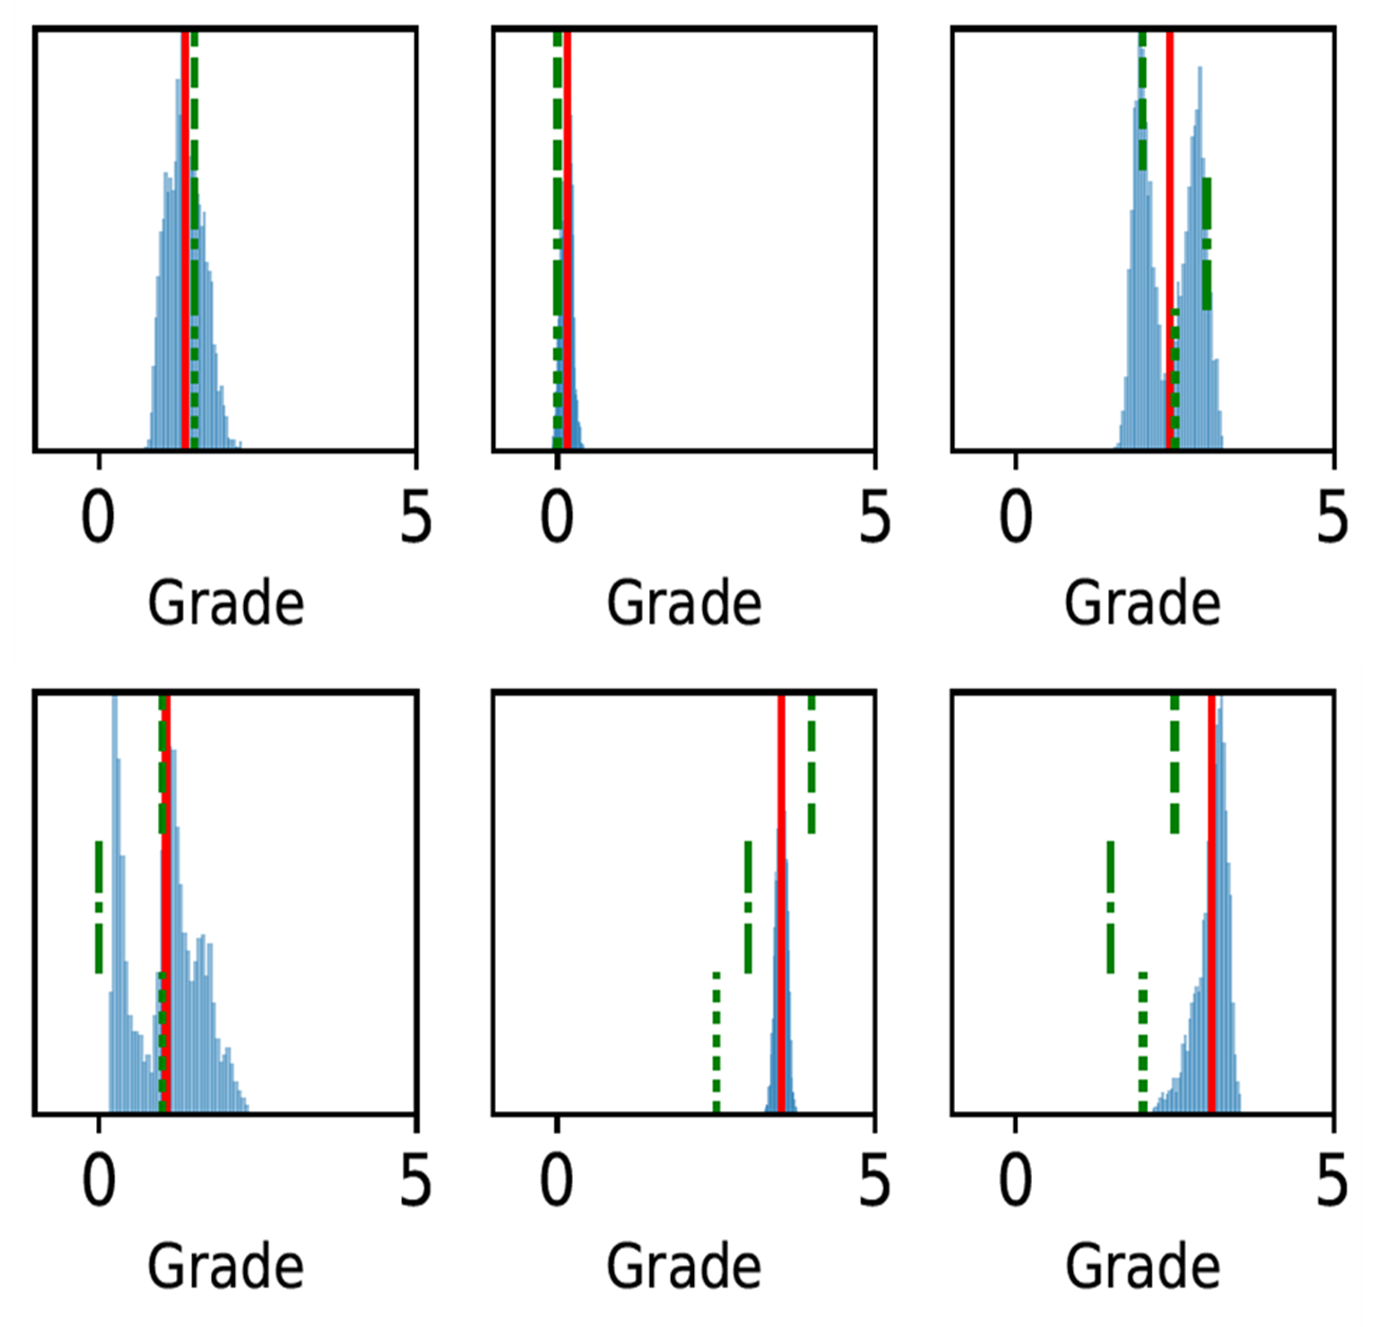
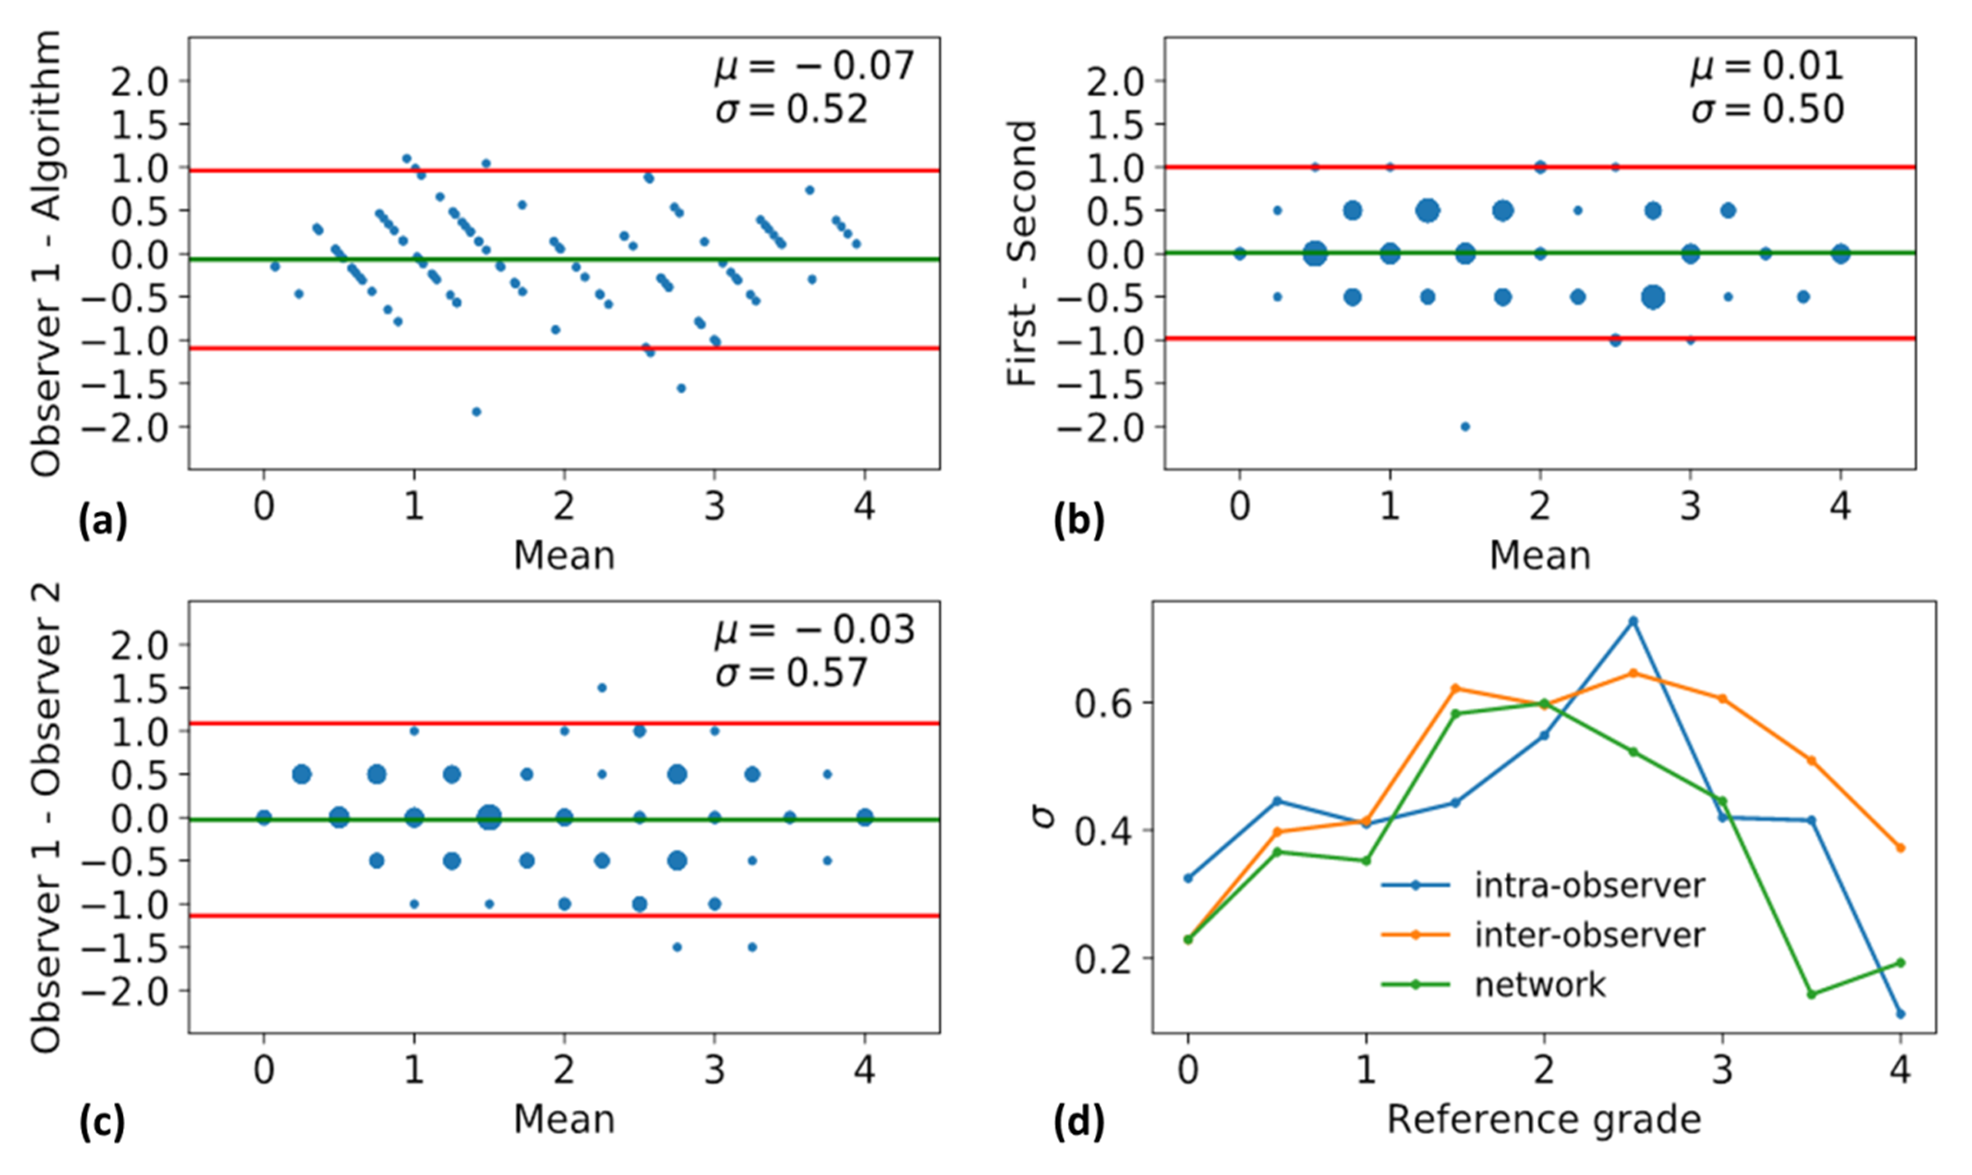
The histogram of all grades given by the first expert reader within the complete database is shown in Fig.2, along with example reformats. A box-plot of the network’s patch grade output against the reference standard is shown in Fig.3a: anti-bias L1=0.44, Pearson correlation r2=0.72, and kappa=0.63. When considering the patient grade (Fig.3b), L1 became 0.39, r2=0.78 and kappa=0.67. The estimated patch grade distribution within the same volume is presented in Fig.4 for six different patients, representative for all phenomena within the test set. Intra-observer agreement is presented as a Bland-Altman plot in Fig.5 (kappa=0.70) together with the inter-observer agreement (kappa=0.67). The correspondence between the network’s grade estimation and the reference is also represented for comparison. Finally, the variability given for the reference grade is depicted together with the average variability per grade for all observers (Fig.5d).Discussion and Conclusions
An automated image quality assessment algorithm employing a deep convolutional neural regression network was described, optimized, trained, tested, and validated. Applied to clinical 3D cardiac MR images, it has been shown that the algorithm can predict human image quality assessment with accuracy within the bounds of the inter-observer variability. This result demonstrates the relevance of deep learning concepts to image quality analysis for this particular application.Acknowledgements
No acknowledgement found.References
[1] Piccini D, et al. Respiratory Self-Navigation for Whole-Heart Bright-Blood Coronary MRI: Methods for Robust Isolation and Automatic Segmentation of the Blood Pool. Magn Reson Med. 2012; 68:571-579.
[2] Piccini D, et al. Respiratory Self-Navigated Postcontrast Whole-Heart Coronary MR Angiography: Initial Experience in Patients. Radiology. 2014; 270:378-386.
[3] Monney P, et al. Single Center Experience of the Application of Self-Navigated 3D Whole Heart Cardiovascular Magnetic Resonance for the Assessment of Cardiac Anatomy in Congenital Heart Disease. J Cardiovasc Magn Reson. 2015; 17:55-66.
Figures