4782
Aortic 4D Flow MRI Data Analysis in Bicuspid Aortic Valve Disease in Under 15 Minutes1Department of Radiology, Northwestern University, Chicago, IL, United States, 2Circle Cardiovascular Imaging Inc., Calgary, AB, Canada, 3Circle Cardiovascular Imaging, Calgary, AB, Canada, 4Department of Biomedical Engineering, Northwestern University, Evanston, IL, United States
Synopsis
One of the main challenges to the efficient application of 4D flow MRI is related to cumbersome, time-consuming, and non-standardized data analysis. The purpose of this study was to test the efficiency and inter-observer reproducibility of a dedicated analysis workflow by using a 4D flow MRI tool in a cohort of 20 BAV patients. We showed that 4D flow MRI can visualize BAV mediated changes on aortic outflow and quantify associated changes in flow dynamics. We demonstrated the potential of an optimized data analysis workflow to perform standardized 4D flow MRI processing in a short time and with good-to-excellent reproducibility.
Introduction:
4D flow MRI can be employed for the in-vivo measurement of blood flow dynamics with full 4D coverage (3D + time) of the cardiac or vascular region of interest.1 Studies have shown that 4D flow derived blood flow visualization and flow quantification can be useful to understand hemodynamic changes in patients with aortic valve disease, such as congenitally abnormal bicuspid aortic valves (BAV). Recent studies have shown that 4D flow MRI can visualize BAV mediated changes on aortic outflow (ascending aorta (AAo) valve flow jets, accompanied by deranged helix and vortex flow patterns) and quantify associated changes in flow dynamics (net flow, peak velocities, retrograde fraction).2-4 However, one of the main challenges to the efficient application of 4D flow MRI is related to cumbersome, time-consuming, and non-standardized data analysis. The purpose of this study was to test the efficiency and inter-observer reproducibility of a dedicated analysis workflow in a cohort of BAV patients that included data preprocessing, aortic segmentation and centerline detection, 3D flow visualization and regional flow quantification.Methods:
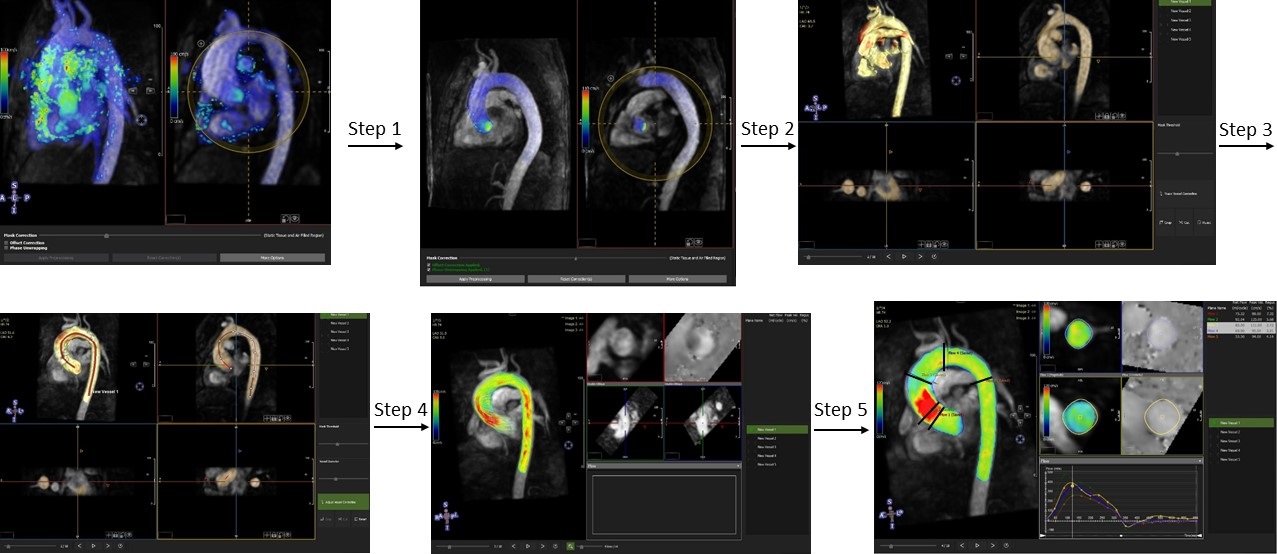
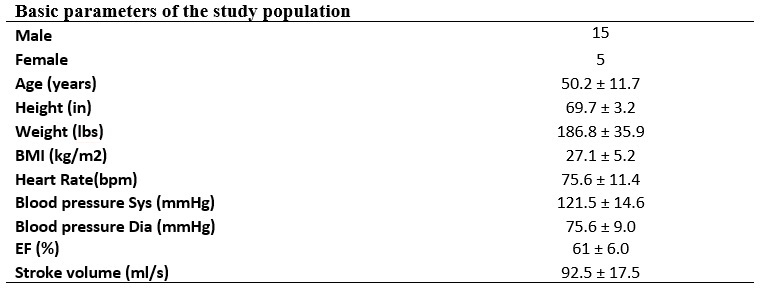
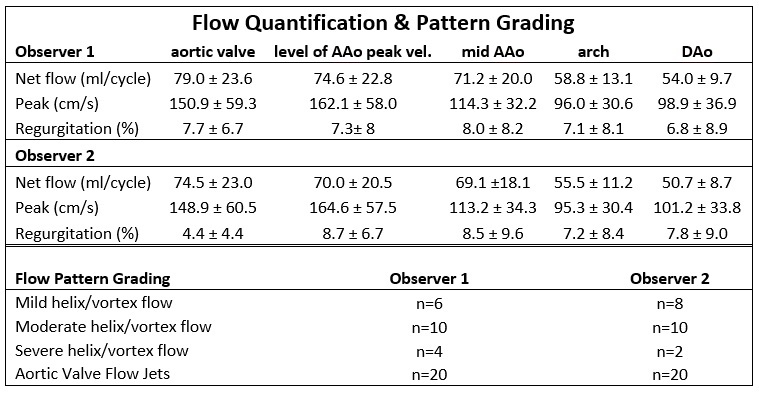
A total of 20 BAV patients (age=50.2±11.7, 5 female) underwent aortic 4D flow MRI as part of a standard-of-care cardiothoracic MRI for aortic surveillance. All MRI exams were performed using 1.5T and 3T MRI systems (Aera, Avanto and Skyra; Siemens, Germany). 3D flow MRI was acquired during free breathing using prospective ECG gating and navigator respiration control and the following sequence parameters: spatial resolution = [2.9-3.1]mm x [2.1-2.5]mm x [2.5-3.8]mm, temporal resolution = [36.8-39.2]ms, velocity sensitivity (venc) = [150-250]m/s. Data analysis was based on a commercial 4D flow software prototype (Circle Cardiovascular Imaging, Calgary, Canada). For all 20 BAV patients, two independent observers conducted aortic 4D flow analysis based on a 5-step analysis workflow (see Figure 1): 1) Pre-processing with noise masking, corrections for eddy current induced phase offset errors and velocity aliasing; 2) thresholding and 3D segmentation of the aorta based on an automatically derived 3D PC-MR angiogram; 3) creation of an aortic centerline; 4) 3D flow visualization using 3D streamlines and velocity maximum intensity projections (MIP); and 5) quantification of net flow, peak velocity, and regurgitation fraction in 5 analysis planes at defined anatomic locations (aortic valve, level of AAo peak velocity identified in peak velocity MIP, mid AAo, aortic arch, descending aorta). 3D flow visualization using streamlines was used to grade the presence/absence of valve flow jets and severity of AAo vortex/helix flow (3-point scale, none/mild = less than one observed rotation of blood flow; moderate = 1 rotation; severe = 2 or more rotations).Results:
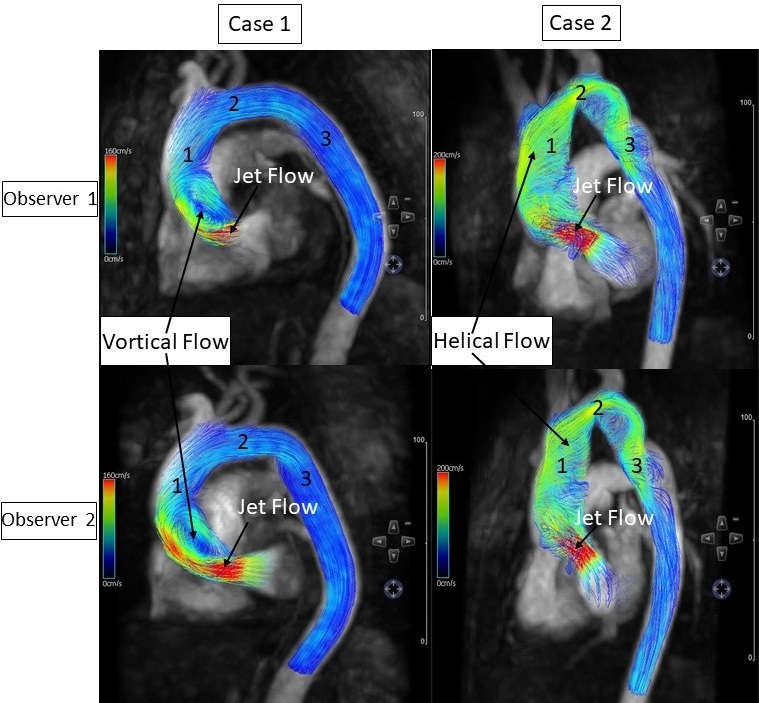
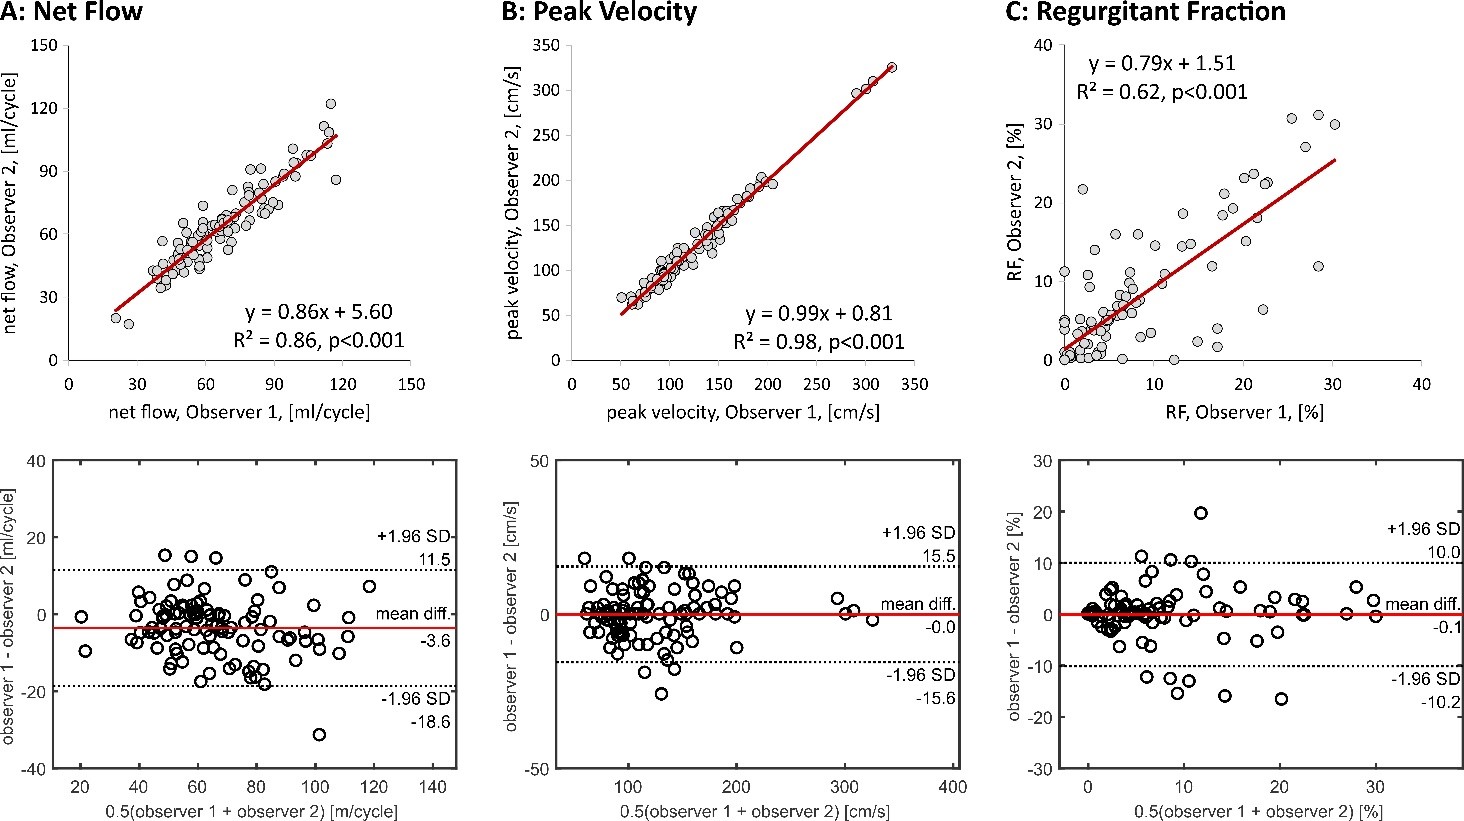
Patient demographics are summarized in Table 1. The average time needed for aortic 4D flow data analysis was 12.8±1.9min (range: 10-16min) and 11.2±3.2min (range: 7-18min) for observers 1 and 2, respectively. Examples of 3D blood flow visualization for 2 BAV patients by both observers are shown in Figure 2. Marked aortic valve outflow jets impinging on the outer AAo curvature as well as adjacent vortex and helix flow patterns could be reproduced by both observers. Flow pattern grading (Table 2) was performed with good inter-observer variability (weighted kappa=0.77) and revealed clearly visible valve outflow jets in all 20 subjects (both observers) and moderate to severe flow derangement (vortex/helix flow in most BAV patients (70% for observer 1, 60% for observer 2). 4D flow quantification was successfully performed in all cases, except in one case that had severe velocity aliasing in the AAo. Results are summarized in Table 2 and Figure 3. Linear regression (Figure 3, top) demonstrated good to excellent inter-observer agreement for all flow metrics (R2=0.62-0.98, p<0.001). In addition, Bland Altman analysis (Figure 3, bottom) revealed excellent inter-observer reproducibility for aorta net flow and peak velocities with minimal bias (net flow: 3.6ml/cycle; peak velocity: 0.0cm/s) and small limits of agreement. Quantification of retrograde fraction was also performed with minimal bias (0.1%) but increased limits of agreement.Discussion:
The findings of this study demonstrate the potential of an optimized data analysis workflow to perform standardized 4D flow MRI processing in a short time (< 15 minutes) and with good-to-excellent reproducibility. Limitations of this study include the small size of the cohort and limited hemodynamics analysis with a focus on standard flow visualization and quantification. Future studies are warranted to further evaluate the performance of fast 4D flow MRI analysis in larger cohorts with different cardiovascular diseases and to test the inclusion of advanced hemodynamic metrics such as wall shear stress or pressure gradients.Acknowledgements
No acknowledgement found.References
1. Schnell S, Entezari P, Mahadewia RJ, Malaisrie SC, McCarthy PM, Collins JD, et al. Improved Semiautomated 4D Flow MRI Analysis in the Aorta in Patients With Congenital Aortic Valve Anomalies Versus Tricuspid Aortic Valves. J Comput Assist Tomogr. 2016;40(1):102-8.
2. Giese D, Weiss K, Baessler B, Madershahian N, Choi YH, Maintz D, et al. In vitro evaluation of flow patterns and turbulent kinetic energy in trans-catheter aortic valve prostheses. MAGMA. 2017.
3. Piatti F, Pirola S, Bissell M, Nesteruk I, Sturla F, Della Corte A, et al. Towards the improved quantification of in vivo abnormal wall shear stresses in BAV-affected patients from 4D-flow imaging: Benchmarking and application to real data. J Biomech. 2017;50:93-101.
4. Schnell S, Smith DA, Barker AJ, Entezari P, Honarmand AR, Carr ML, et al. Altered aortic shape in bicuspid aortic valve relatives influences blood flow patterns. Eur Heart J Cardiovasc Imaging. 2016;17(11):1239-47.
Figures