4774
A Simple Method for Post-Processing Correction of 3D Radial Trajectory Imperfections in 5D Cardiac MRI1Department of Radiology, University Hospital (CHUV) and University of Lausanne (UNIL), Lausanne, Switzerland, 2Center for Biomedical Imaging (CIBM), Lausanne, Switzerland, 3Advanced Clinical Imaging Technology, Siemens Healthcare AG, Lausanne, Switzerland
Synopsis
Three-dimensional radial trajectories have shown important benefits for multidimensional MR imaging of the heart. However, the performance of radial scanning approaches is sensitive even to small trajectory imperfections, which can induce significant artifacts in the reconstructed images. Here, we implemented a simple and flexible post-processing technique for trajectory inaccuracy artifact compensation that does not require any pre-scan calibration or pulse sequence modification. The technique proved effective when applied to in silico and in vitro phantom datasets, and preliminarily results suggest good feasibility in vivo for fully self-gated and motion-resolved 5D cardiac imaging.
Introduction
Three-dimensional radial trajectories have several advantages over conventional Cartesian k-space sampling, especially for multidimensional MR imaging. However, radial scanning is sensitive to small gradient imperfections, timing delays, eddy currents, B0 inhomogeneities, etc., which can lead to trajectory inaccuracies and in turn affect image quality. Several solutions that compensate for these imperfections have been proposed for 2D imaging,1-8 which sometimes include calibration pre-scans,3,6,7 and/or pulse-sequence modifications.3,6,8 Here, starting from the framework presented in2,5, we implemented a simple post-processing step to account for trajectory imperfections aimed at improved image quality in 3D radial imaging. We then tested this method in numerical simulations, in phantoms and in fully self-gated 5D cardiac imaging9 to verify the hypothesis that image quality can be further improved.Methods
The mismatch between nominal and acquired trajectories is schematically illustrated in Fig.1a. The deviation of a generic radial readout $$$S\left(k\right)$$$ from the theoretical path can be defined by 3 independent shifts. Here, the correction method will consider only shifts in the parallel direction, which in general can vary according to the readout direction ($$${\Delta{k}}_{R}\left(\theta,\phi\right)$$$ in 3D polar coordinates, where $$$\theta$$$ and $$$\phi$$$ are azimuthal and polar angles, Fig.1b). In the proposed method, magnitudes of all k-space readouts are individually interpolated (by cubic spline) and the peak position indices (PPI) are determined. After a weighted average over all the coil elements (where weights are proportional to the readout’s peak amplitude), each PPI is then plotted in 3D according to the angular direction of the corresponding readout, where angles $$$\theta$$$ and $$$\phi$$$ are the x- and y-axis, respectively. A locally weighted linear regression algorithm estimates the surface that best fits the obtained data cloud. Finally, the estimated parallel shifts $$$\hat{{\Delta{k}}}_{R}\left(\theta,\phi\right)$$$ are extracted from the fitted surface and applied to correct the corresponding readouts according to the equation $$$S_{\theta,\phi}^{corr}\left(k\right)=F\left\{F^{-1}\left\{S_{\theta,\phi}\left(k\right)\right\}e^{-2\pi{i}{x}\hat{\Delta{k}}_{R}\left(\theta,\phi\right)}\right\}$$$ (Fig.1c).
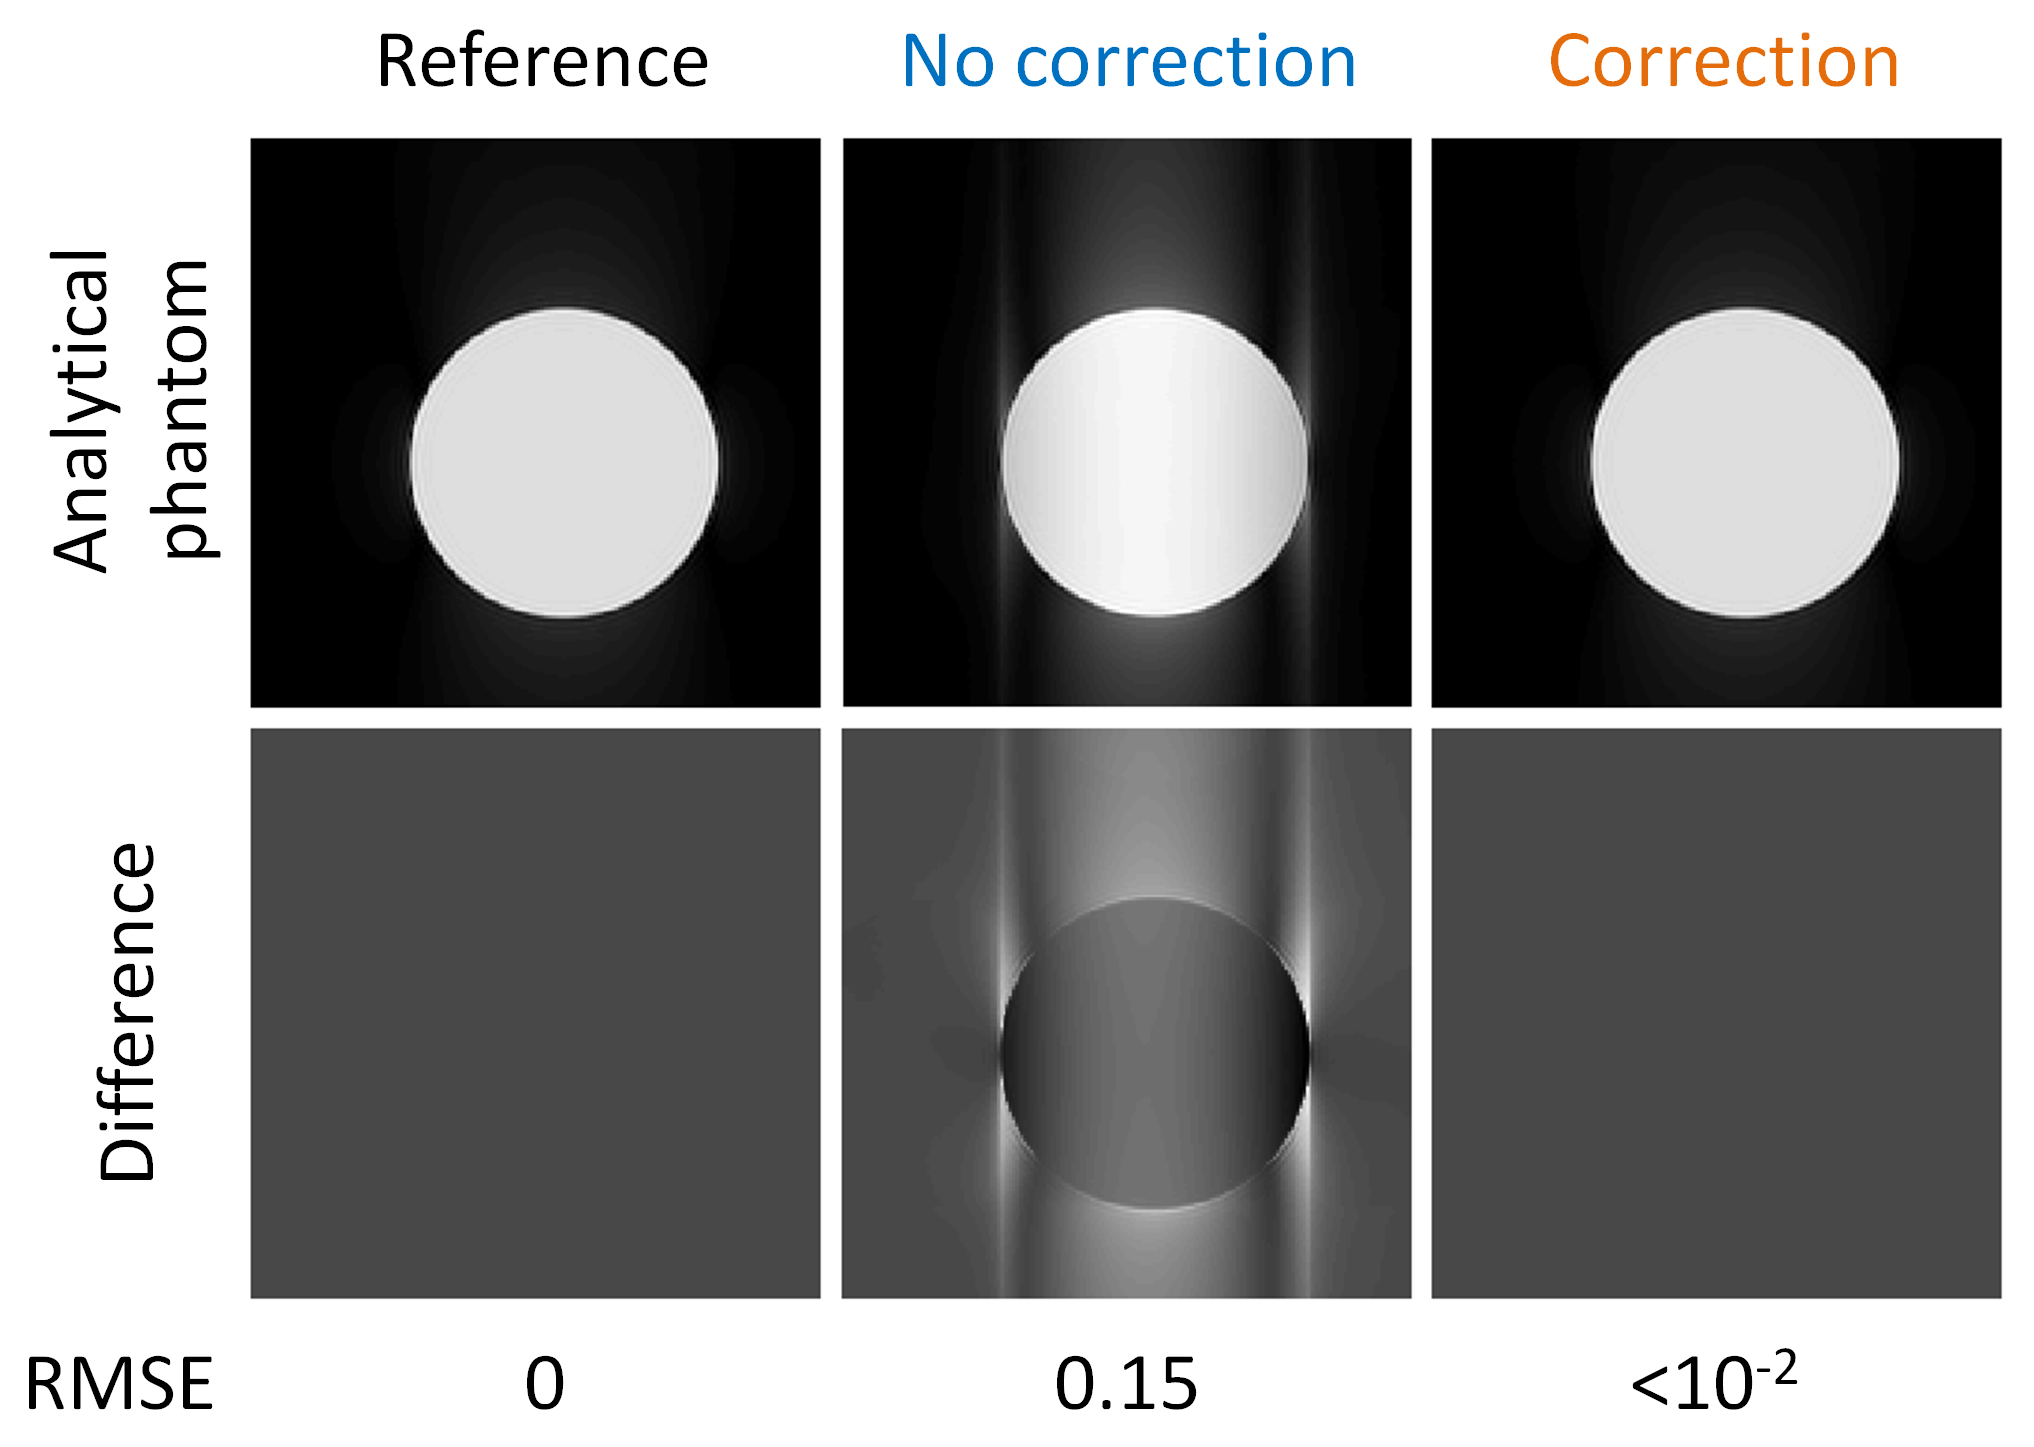
k-Space data for a uniform spherical object were analytically simulated according to equations in10, and artificially sampled using the same prototype golden-angle Phyllotaxis trajectory used in the subsequent scanner acquisitions (Fig.1d).11 Corrupted trajectories were simulated by shifting readouts individually in the range of values observed in the following in vitro test, i.e. $$${\Delta{k}}_{R}\left(\theta,\phi\right)=\left[0,1.5\Delta{k}\right]$$$. A reference dataset was first reconstructed using “perfect” non-shifted trajectory conditions, while the corrupted trajectory was reconstructed both with and without our proposed correction. Difference images and root-mean-square errors (RMSE) were calculated between the two reconstructions and the ground-truth image.
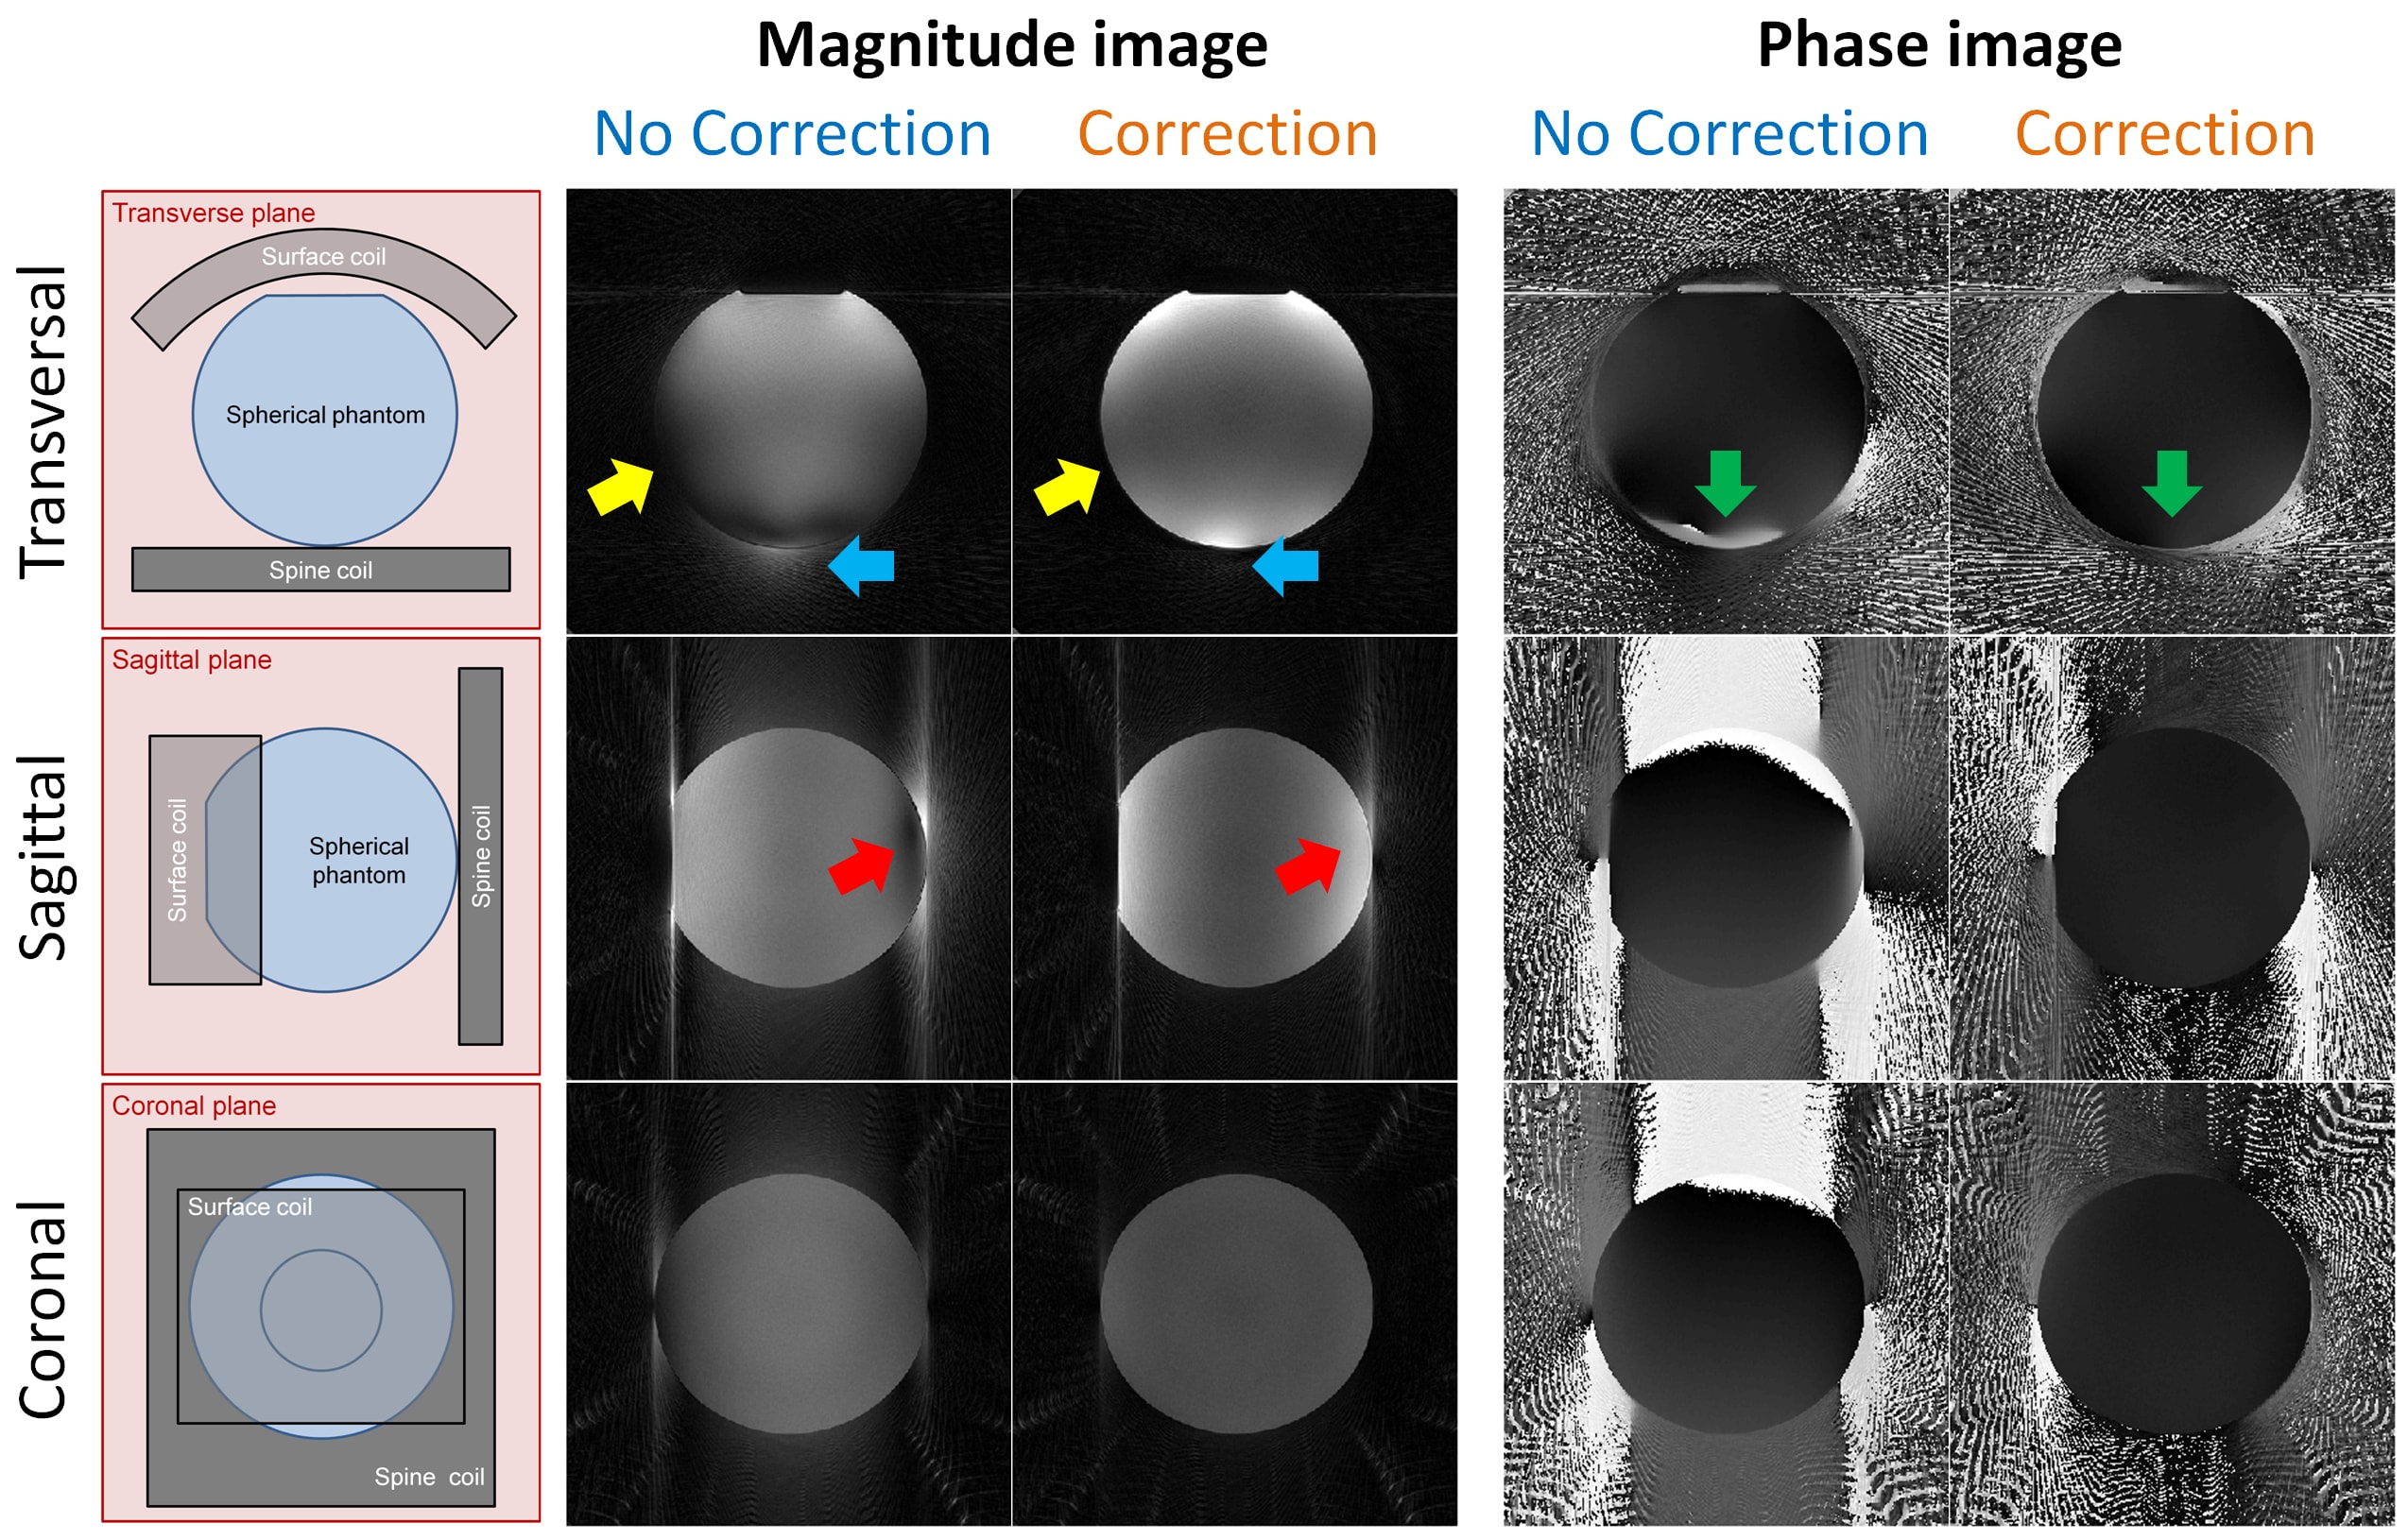
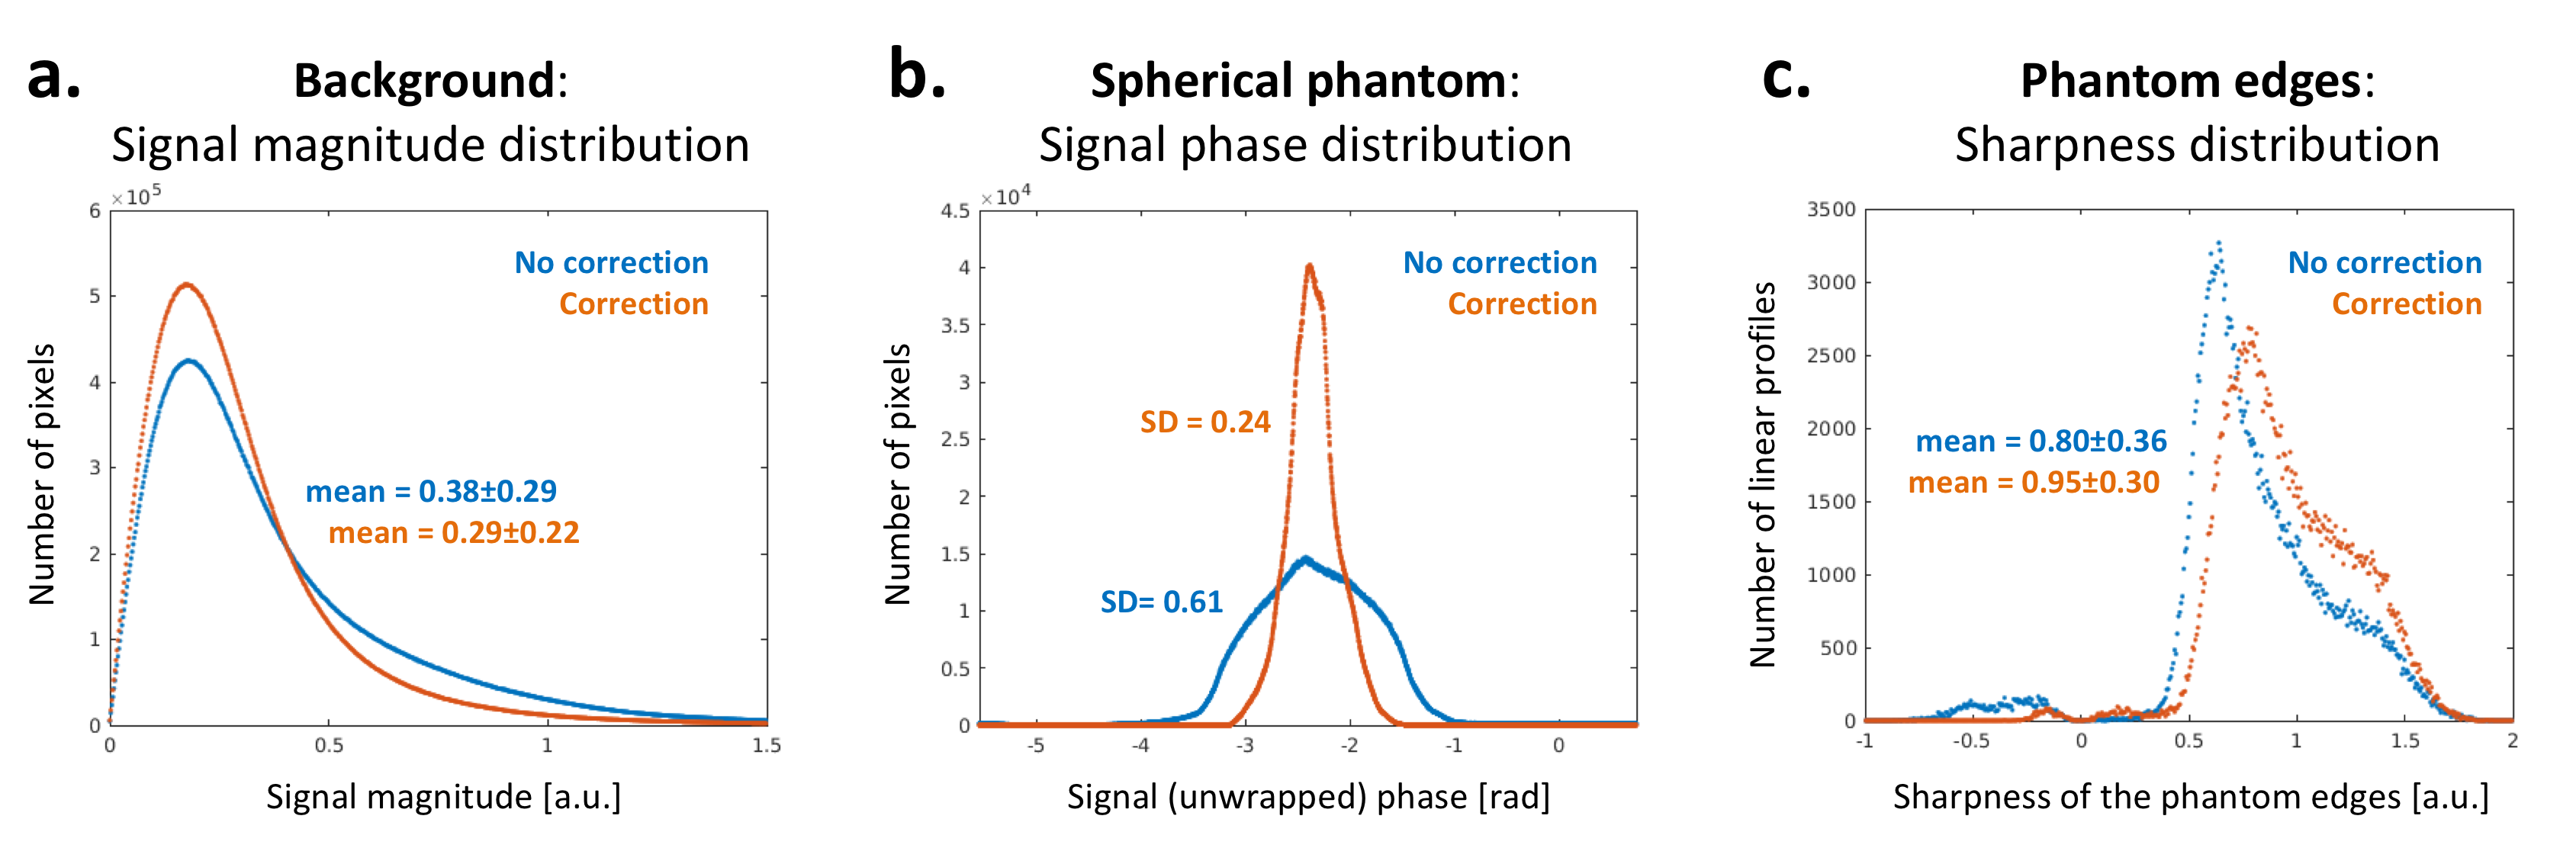
The in vitro experimental setup consisted of a spherical phantom positioned close to the scanner isocenter, and the acquisition was performed with the same non-triggered 3D bSSFP sequence protocol as used for in vivo 5D cardiac imaging. Images reconstructed with and without the described method were compared using the distribution of the background noise magnitude, the signal phase inside the sphere, and the air-phantom interface sharpness.
N=10 volunteers provided written informed consent, and 5D images of the heart were acquired in a free-running mode on a 1.5T clinical MRI scanner (MAGNETOM Aera, Siemens Healthcare).12 Physiological signals for binning were extracted from the k-space data, and fully self-gated 5D motion-resolved reconstruction was performed.9,13 Images with and without the proposed correction were then visually compared.
Results
In the simulated framework, the correction completely removed all visible artifacts introduced by the trajectory mismatch (Fig.2). This is confirmed by decreased RMSE values, from 0.15 to <10-2. Cross-sections from the reconstructed 3D in vitro phantom data are shown in Fig.3. Both visual inspection and signal distribution show improvements after correction (Fig.4): background noise and streaking artifacts are reduced (average signal magnitude: from 0.38±0.29 to 0.29±0.22, df=~8*107,p<0.0001), signal phase inside the sphere becomes more homogeneous (SD of the phase distribution: from 0.61 rad to 0.24 rad, df=~107,p<0.0001), and the average sharpness of the phantom-air interface increases (from 0.80±0.36 to 0.95±0.30, df=~2.6*105,p<0.0001). After correction, the signal intensity distribution became more consistent with the receiver coil positions (Fig.3). Consistent with the results obtained from the numerical simulations and the phantom experiments, the corrected in vivo 5D cardiac images showed some clear improvements: streaking artifact was reduced and interface definitions improved (Fig.5).Discussion and Conclusion
The analytical and in vitro experiments have shown that even a modest mismatch between nominal and actual trajectories in 3D radial acquisitions can cause severe artifacts with different characteristics in the reconstructed images. The proposed correction method, despite its limitations, has shown to significantly reduce such artifacts in vitro. Preliminary results from the 5D cardiac reconstructions have shown promising image quality enhancement, but further tests and quantification are still required. In conclusion, a simple and flexible correction method for 3D radial trajectory imperfections was tested and results suggested good feasibility in vivo for 5D cardiac imaging.Acknowledgements
No acknowledgement found.References
1. Moussavi, A., Untenberger, M., Uecker, M. & Frahm, J. Correction of gradient-induced phase errors in radial MRI. Magnetic resonance in medicine 71, 308-312, doi:10.1002/mrm.24643 (2014).
2. Deshmane, A. et al. Self-calibrated trajectory estimation and signal correction method for robust radial imaging using GRAPPA operator gridding. Magnetic resonance in medicine 75, 883-896, doi:10.1002/mrm.25648 (2016).
3. Buonincontri, G., Methner, C., Krieg, T., Carpenter, T. A. & Sawiak, S. J. Trajectory correction for free-breathing radial cine MRI. Magn Reson Imaging 32, 961-964, doi:10.1016/j.mri.2014.04.006 (2014).
4. Takizawa, M. et al. Modified echo peak correction for radial acquisition regime (RADAR). Magn Reson Med Sci 8, 149-158 (2009).
5. Kramer, M., Biermann, J. & Reichenbach, J. R. Intrinsic correction of system delays for radial magnetic resonance imaging. Magn Reson Imaging 33, 491-496, doi:10.1016/j.mri.2015.01.005 (2015).
6. Peters, D. C., Derbyshire, J. A. & McVeigh, E. R. Centering the projection reconstruction trajectory: reducing gradient delay errors. Magnetic resonance in medicine 50, 1-6, doi:10.1002/mrm.10501 (2003).
7. Duyn, J. H., Yang, Y., Frank, J. A. & van der Veen, J. W. Simple correction method for k-space trajectory deviations in MRI. J Magn Reson 132, 150-153, doi:10.1006/jmre.1998.1396 (1998).
8. Block, K.T., Uecker, M., Simple method for adaptive gradient-delay compensation in radial MRI. In Proceedings of the 19th Annual Meeting of ISMRM, Montreal, Canada, 2011. p. 2816
9. Feng, L. et al. 5D whole-heart sparse MRI. Magnetic resonance in medicine, doi:10.1002/mrm.26745 (2017).
10. Koay, C. G., Sarlls, J. E. & Ozarslan, E. Three-dimensional analytical magnetic resonance imaging phantom in the Fourier domain. Magnetic resonance in medicine 58, 430-436, doi:10.1002/mrm.21292 (2007).
11. Piccini, D., Littmann, A., Nielles-Vallespin, S. & Zenge, M. O. Spiral phyllotaxis: the natural way to construct a 3D radial trajectory in MRI. Magnetic resonance in medicine 66, 1049-1056, doi:10.1002/mrm.22898 (2011).
12. Coppo, S. et al. Free-running 4D whole-heart self-navigated golden angle MRI: Initial results. Magnetic resonance in medicine 74, 1306-1316, doi:10.1002/mrm.25523 (2015).
13. Di Sopra, L., Piccini, D., Coppo, S., Bastiaansen, J., Stuber, M., and Yerly, J., Motion-Resolved 5D Imaging of the Heart: Time to Get Rid of the ECG?. In Proceedings of the 25th Annual Meeting of ISMRM, Honolulu, HI, USA, 2017, Program Number 3148
Figures