4772
Combined fractal and connected component analysis for characterization of cardiac fibrosis distribution in end stage renal disease patients on routine hemodialysis1Bioengineering, UC Berkeley, Berkeley, CA, United States
Synopsis
A magnetization transfer based MRI technique for measurement of cardiac fibrosis was applied to 34 end stage renal disease patients on routine hemodialysis and 19 controls. Short axis maps of changes in tissue magnetization transfer properties were combined to create 3D domains in which anatomical connectivity of voxels in the myocardium was linearized. Connected component analysis was used to isolate distinct spatially connected sub-regions of myocardium and fractal analysis of magnetization transfer changes was applied to the whole myocardium as well as these sub-regions. The measured fractal dimensions show tissue-level structural differences between the different tissue types and patient populations.
Introduction
End-stage renal disease (ESRD) patients suffer high mortality from fatal cardiac arrhythmias with an emerging link to myocardial fibrosis. Histological data probing diffuse fibrosis at the tissue level has shown a fractal spatial pattern1. In a prior study, we utilized magnetization transfer (MT) based imaging to quantify the global burden of cardiac fibrosis in ESRD patients2 (Figure 1). In this study, we applied fractal analysis and connected component analysis to previously acquired data in order to probe and characterize the morphology of fibrosis in ESRD patients on routine hemodialysis.Methods
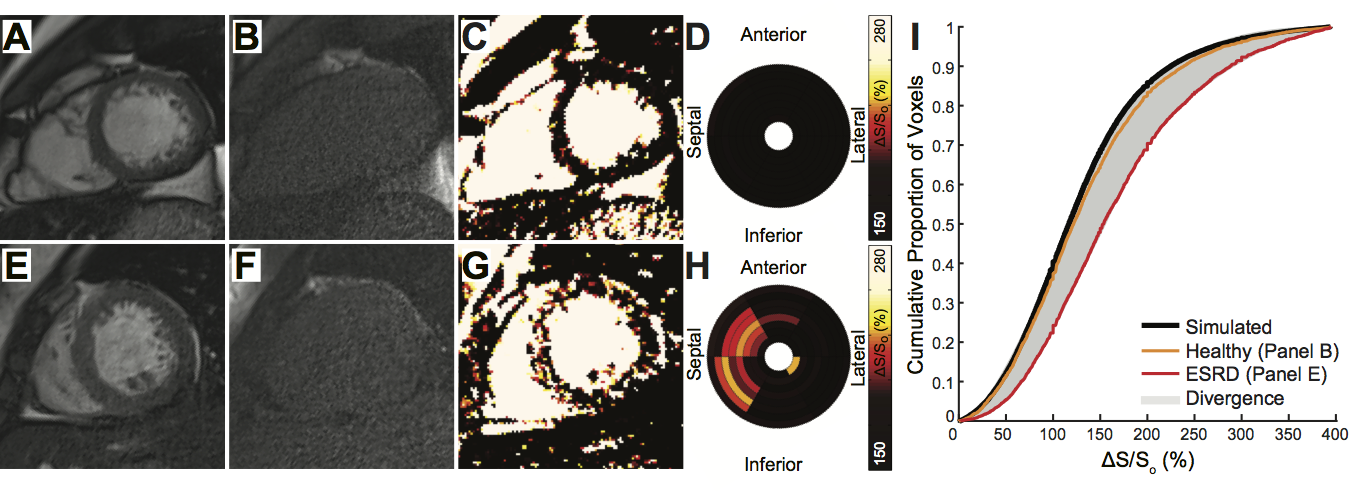
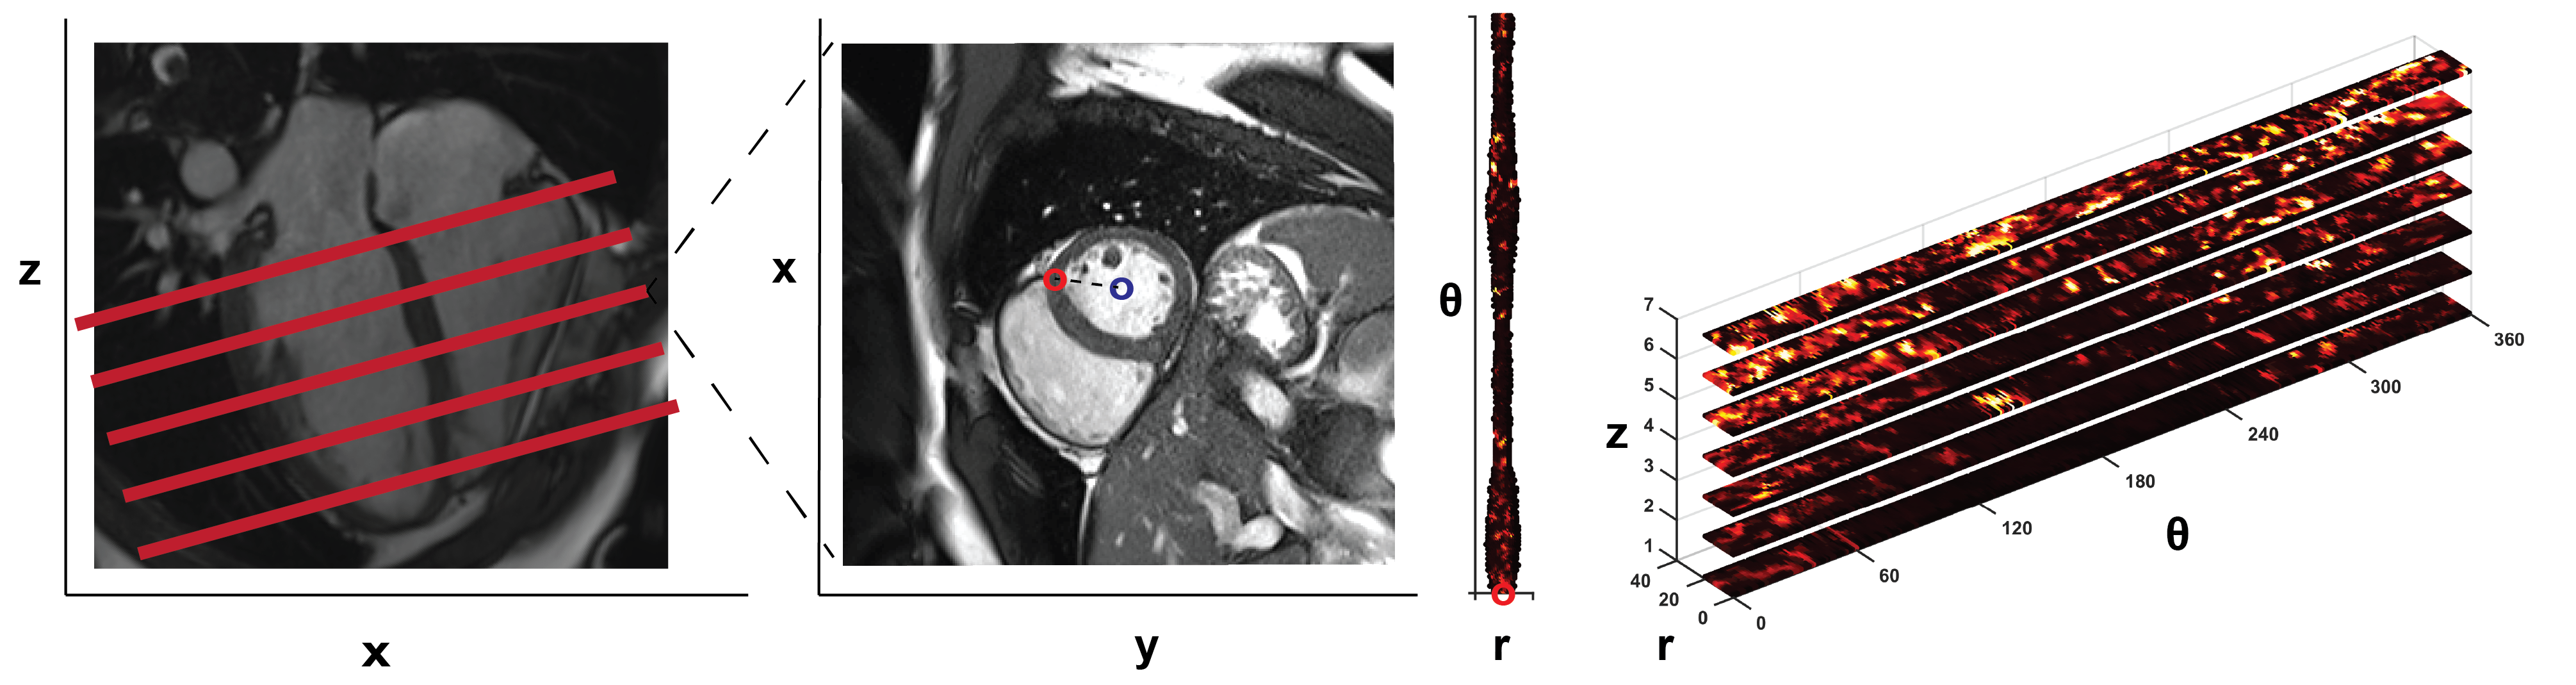
Preparation of 3D tissue space: Short axis maps of ΔS/So (Figure 1) spanning from the left ventricular base to the apex in ESRD (n = 34) and controls (n = 19) were previously contoured to define endo and epicardial borders. Myocardial voxels were subsequently translated from Cartesian to radial coordinates (Figure 2) and stacked based on longitudinal position. At each angle (θ), the radial value was redefined based on distance from the midwall such that voxels at identical radial positions (r, θ) and adjacent longitudinal positions (z1, z2) were physically connected in a domain termed HeartSpace.
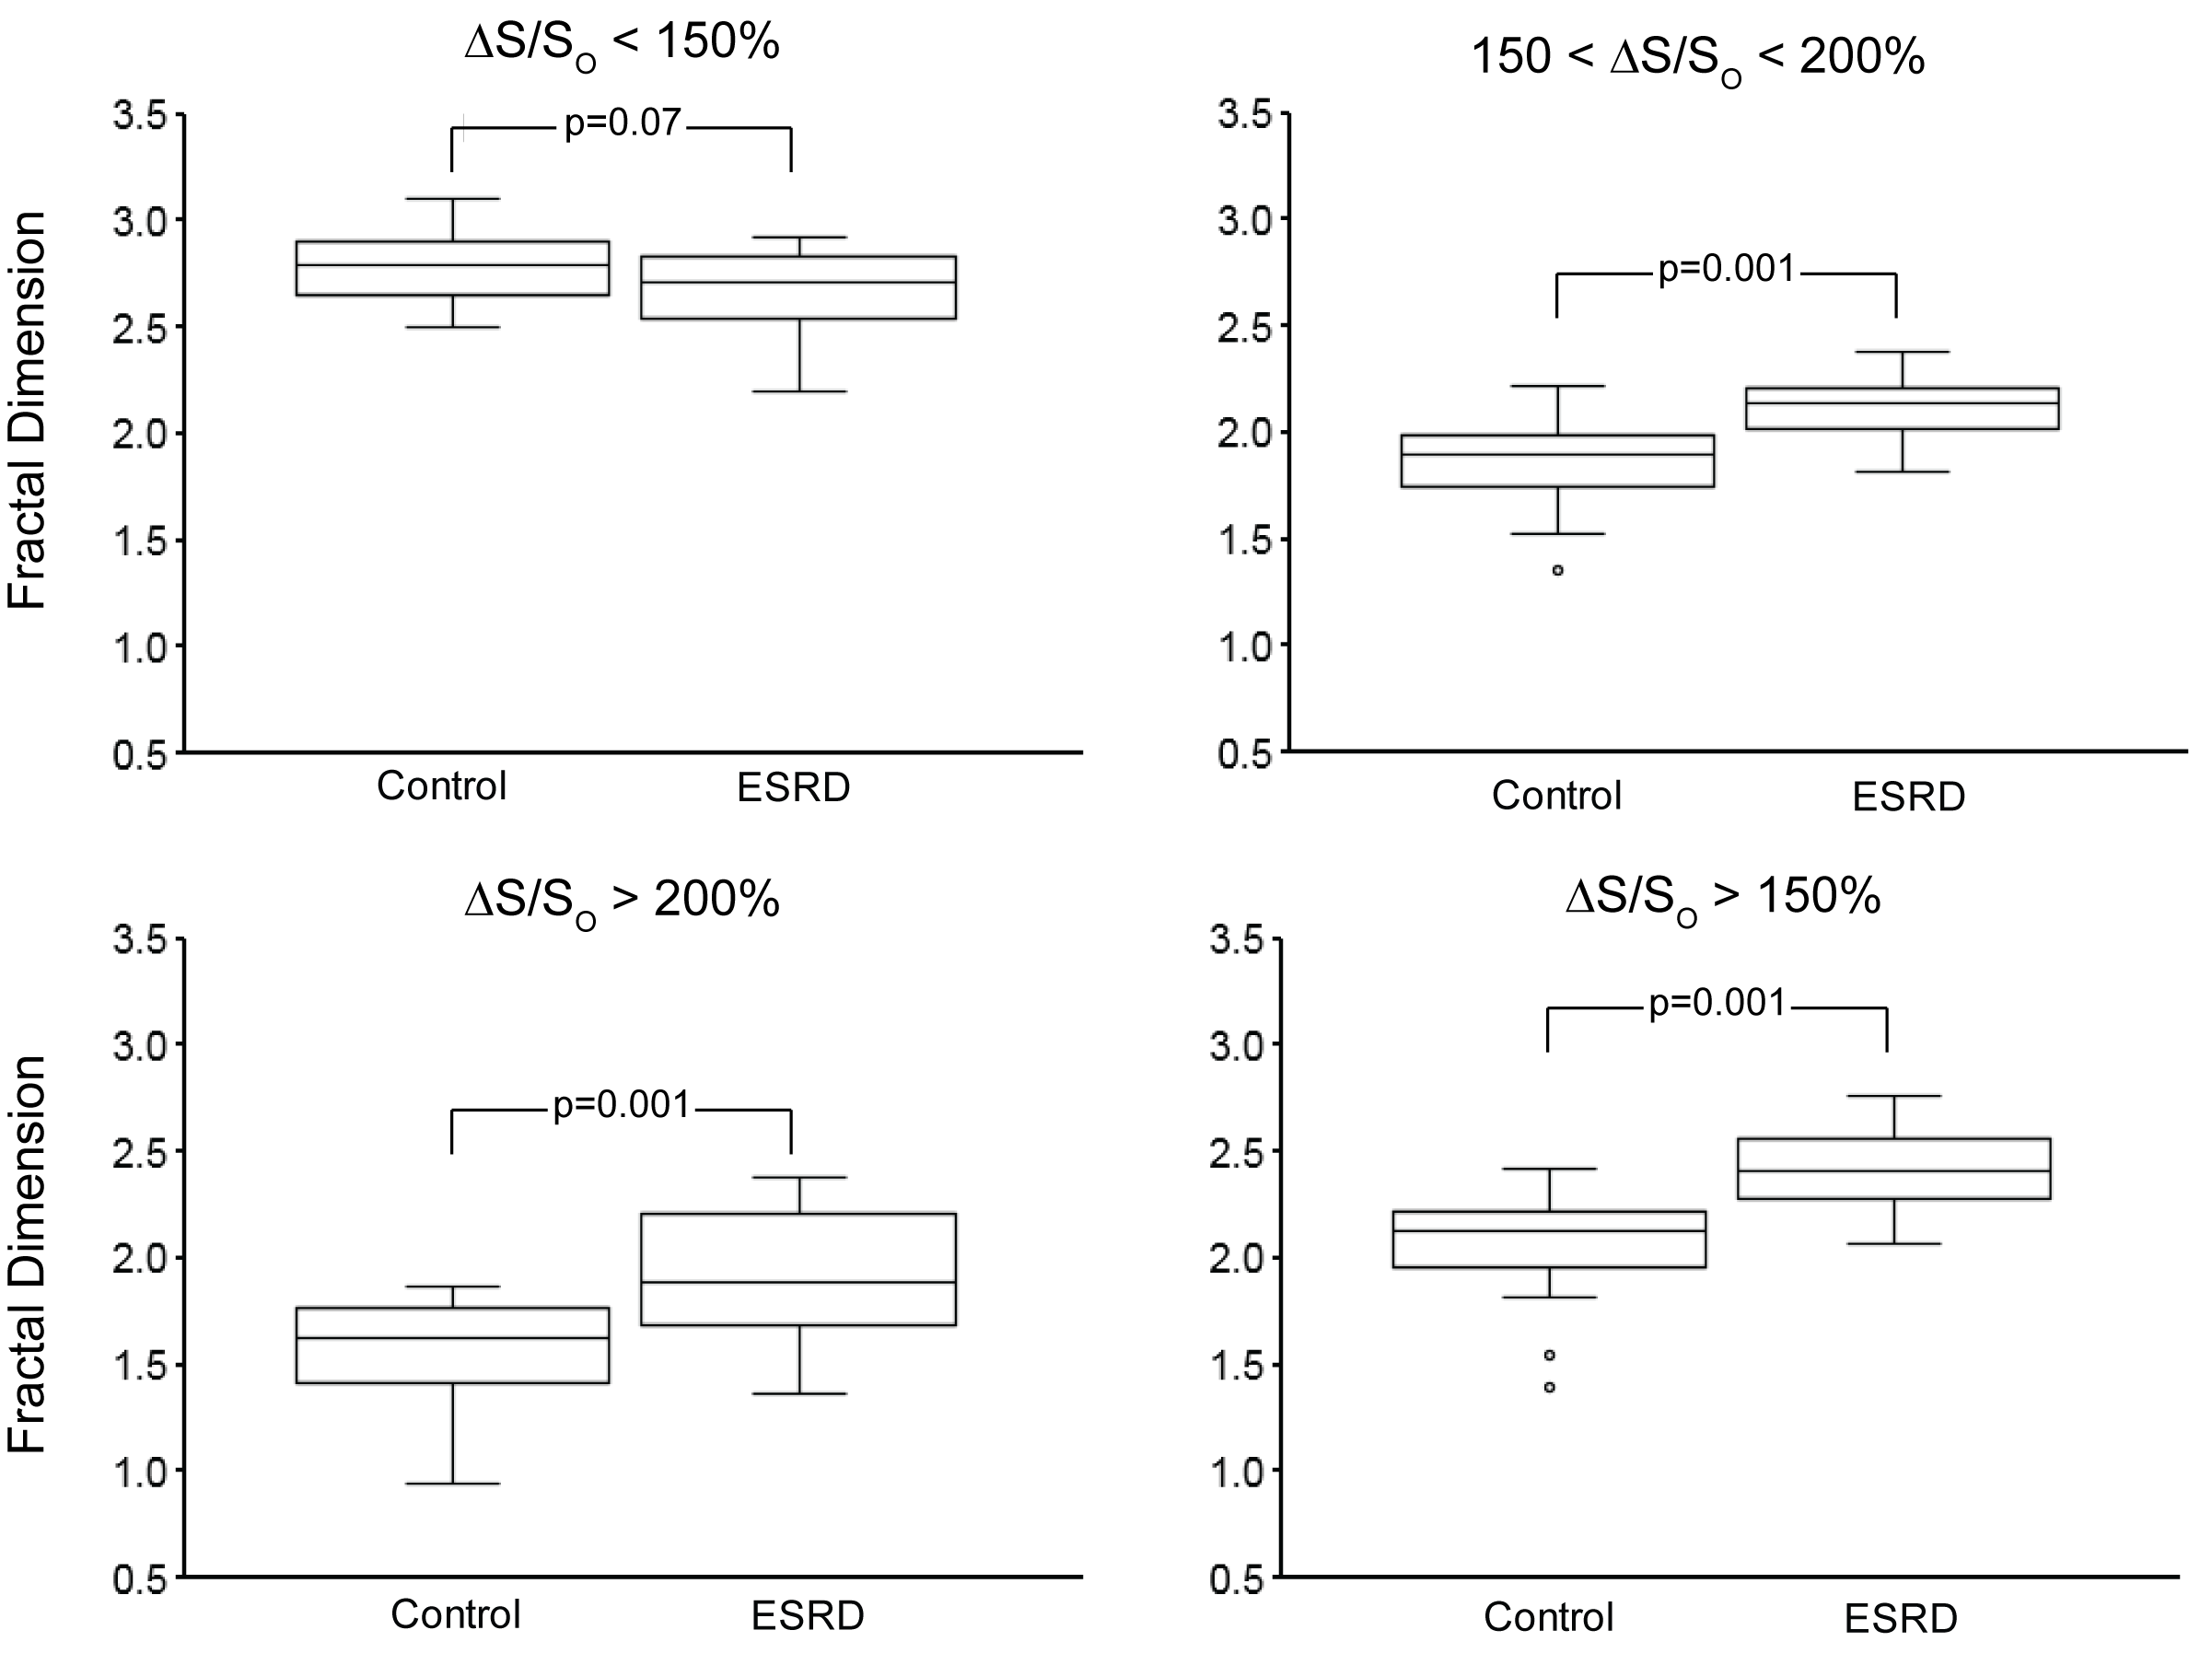
Fractal Analysis: A 3D box-counting method3 was implemented in MATLAB and applied over the entire HeartSpace within four ΔS/So domains corresponding to healthy myocardium (ΔS/So < 150%), diffusely enhanced myocardium (150 < ΔS/So < 200%), enhanced myocardium (ΔS/So > 200%), and all enhanced myocardium (ΔS/So > 150%) based on prior studies that compared ΔS/So values to late gadolinium enhancement and gadolinium partition coefficient2. Fractal dimension (FD) of each domain was calculated by taking the slope of the best-fit line of a log-log plot of the box side length vs. the number of boxes required to cover all the entire tissue volume.
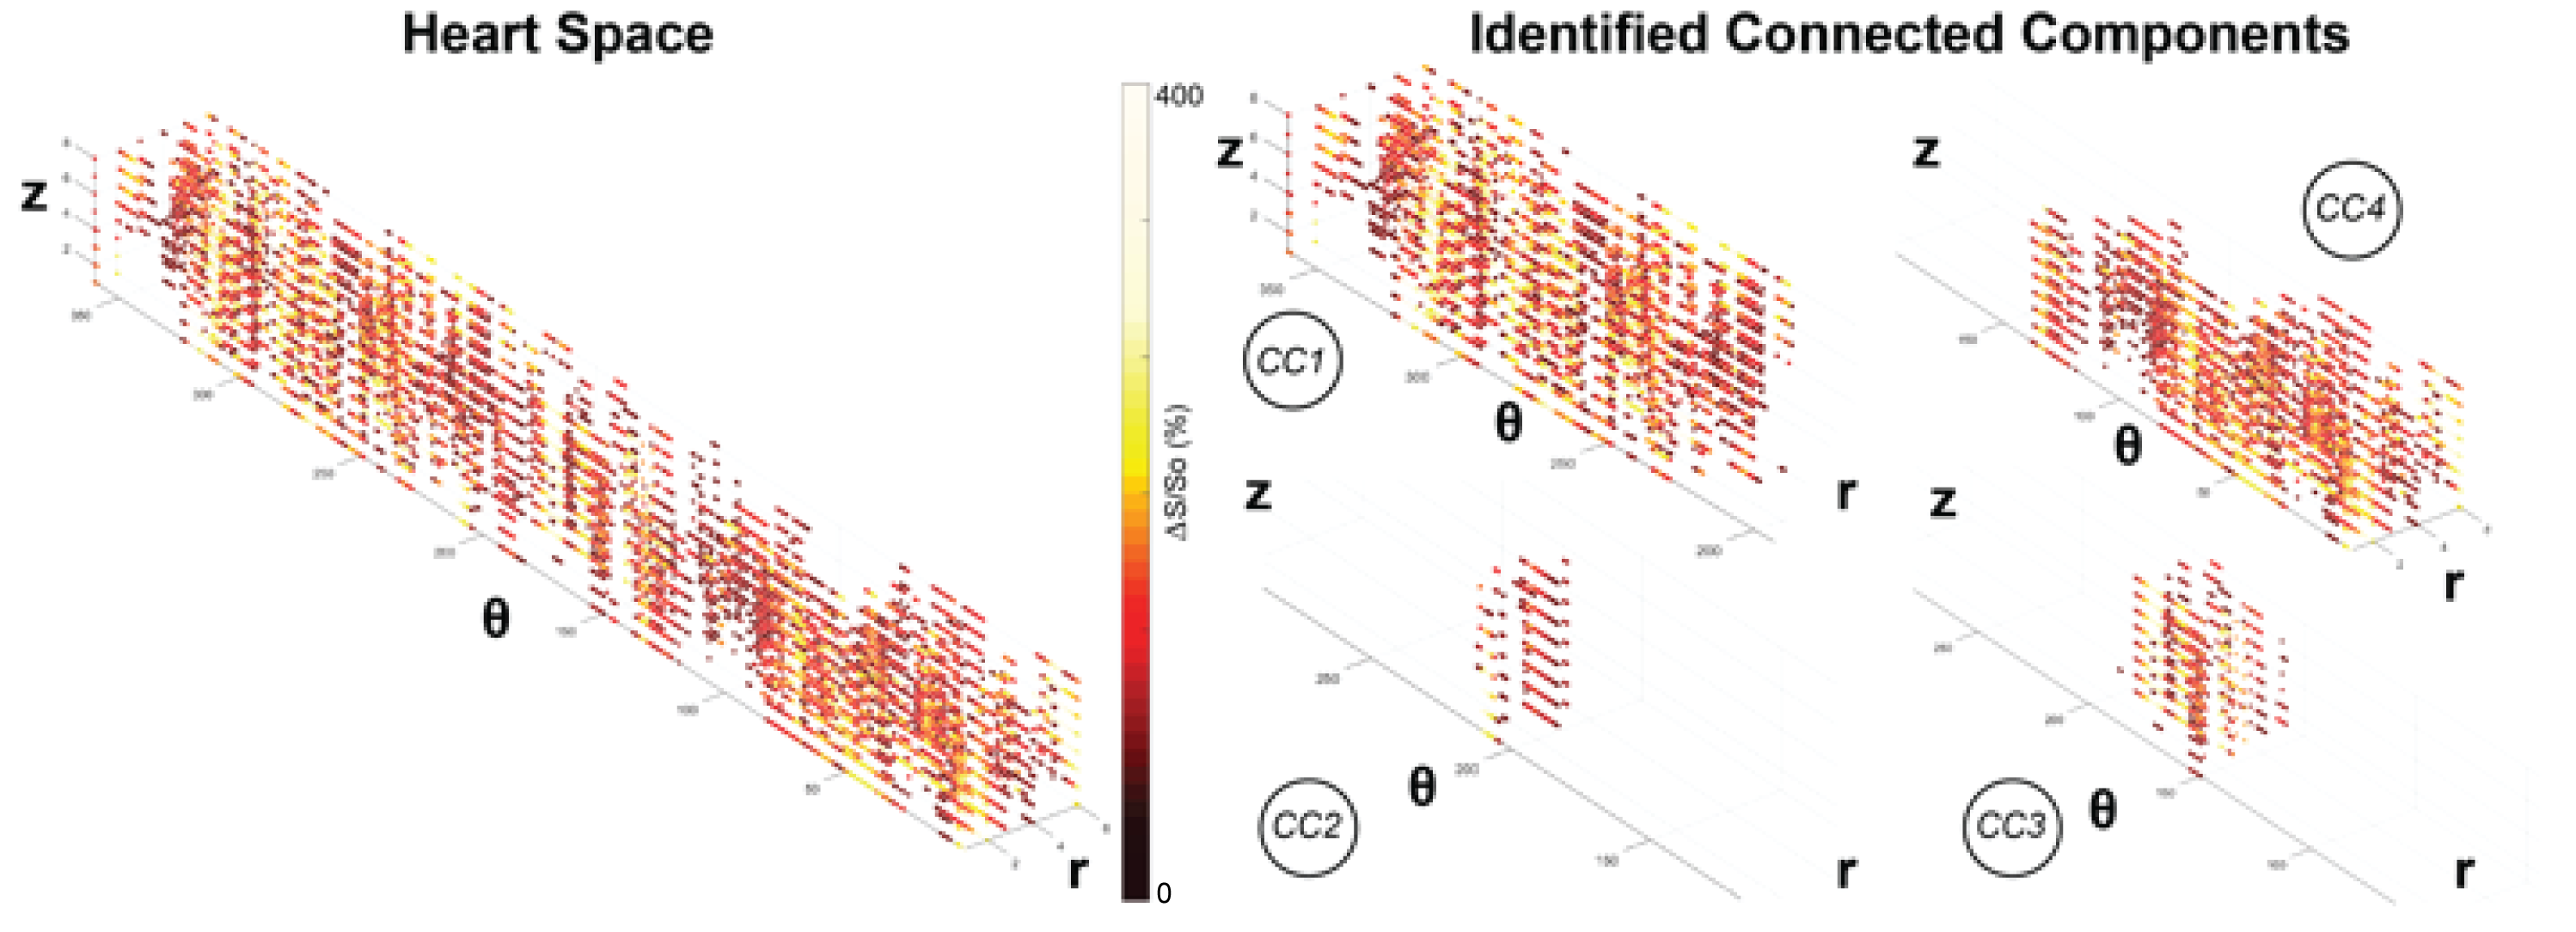
Connected Component Analysis: Voxels with ΔS/So above 150% were isolated and 26-neighbor connected component analysis (CCA) was used to isolate fibrotic clusters as connected components (CCs) based on existing Matlab CC algorithms. Fractal analysis was then repeated on each connected component composed of above 40 voxels within each patient.
Statistics: Two-tailed t-tests were used to determine significance.
Results
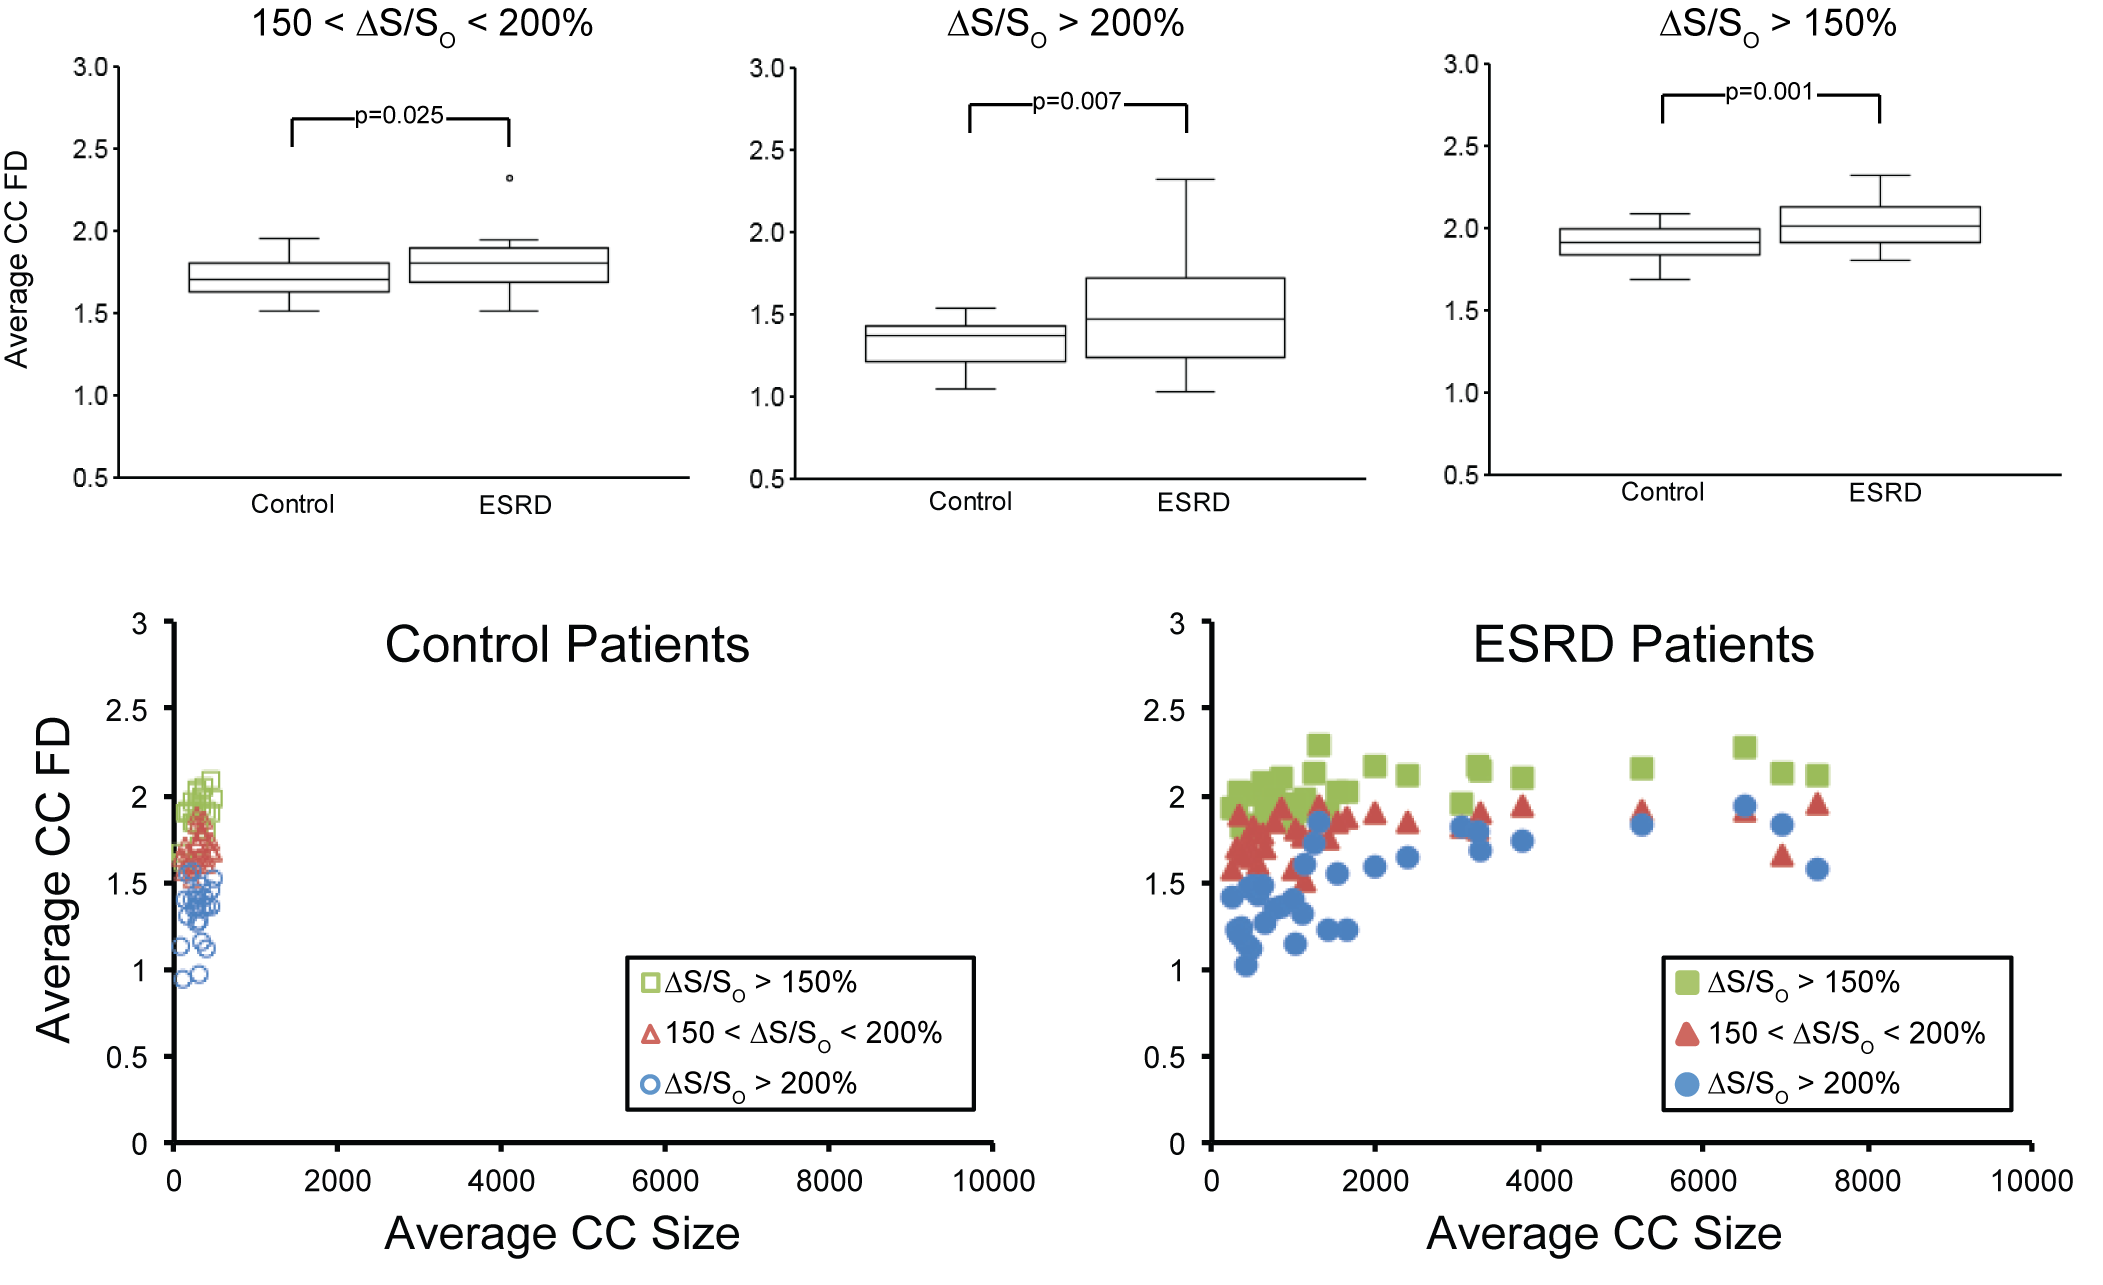
Fractal analysis yielded fractal dimensions (FDs), values that quantified the space-filling characteristics of the tissue being analyzed. Significant differences in FD within all three elevated ΔS/So domains were observed between the ESRD and control populations (Figure 3). In ESRD patients, elevated FD values in diffusely fibrotic (150% < ΔS/So < 200%) and densely fibrotic tissues (ΔS/So > 200%) reveal planar distributions within 3D space (Figure 3). The combination of these two domains (ΔS/So > 150%) resulted in FD values close to 2.5, indicative of a fractal 3D space-filling pattern that was not observed in either domain independently (Figure 3).
Use of connected component analysis enabled measurement of fractal dimension in distinct spatially connected sub-regions of myocardium (Figure 4). The average size of connected components was significantly higher in ESRD patients compared to healthy controls (321 ± 168 voxels Control vs. 2448 ± 3839 voxels ESRD, p = 0.0028). In comparison to values obtained over the entire ventricle, lower FD values for the diffusely and densely elevated myocardium were observed among individual connected components (Figure 5) that are consistent with patterns that fill 2D space with 1D line-like structures. The combination of these two tissues showed that the elevated myocardium on total was planar. Among ESRD patients, comparison of the average fractal dimension of a single connected component to the corresponding size revealed that both the diffusely elevated (150% < ΔS/So < 200%) and combined elevated (ΔS/So > 150%) domains consistently demonstrated fractal dimensions of approximately 2 regardless of connected component size. In contrast, the fractal dimension of densely fibrotic tissue (ΔS/So > 200%) increased from around 1 in smaller connected components (consistent with point elevations) to around 2 in larger connected components (consistent with planar fractal patterns).
Discussion
In contrast to replacement fibrosis that develops after ischemic injury, reactive fibrosis in ESRD patients is intrinsically diffuse and spatially heterogeneous. Subsequently, measurement of an average myocardial ΔS/So value in ESRD patients limits the ability to detect spatial patterns of elevation. In juxtaposition, measurement of the fractal dimension from MT based imaging of cardiac fibrosis provides a logical method for quantifying the spatial order of diffusely fibrotic myocardium. The further combination with connected component analysis provides additional detail of cardiac fibrosis in ESRD patients as an interconnection of diffuse and focal fibrotic tissue that fills 3D space in a fractal pattern.Conclusion
Fractal analysis of the myocardium provides greater characterization of the spatial distribution of cardiac fibrosis in ESRD patients.Acknowledgements
The American Heart Association National Affiliate (14CRP20380071) and National Institutes of Health (R01HL128592) to MV funded this work.References
1. Zouein, F. A. et al. Applying fractal dimension and image analysis to quantify fibrotic collagen deposition and organization in the normal and hypertensive heart. Microsc. Microanal. 20, 1134–1144 (2014).
2. Stromp, T. A. et al. Gadolinium free cardiovascular magnetic resonance with 2-point Cine balanced steady state free precession. Journal of cardiovascular magnetic resonance : official journal of the Society for Cardiovascular Magnetic Resonance 17, 90, doi:10.1186/s12968-015-0194-1 (2015).
3. Mandelbrot, Benoit B., and Roberto Pignoni. The fractal geometry of nature. Vol. 173. New York: WH Freeman (1983).
Figures