4771
A New Myocardial T1-Mapping Technique: MOSHA1Departments of Cardiology and Pediatrics, Boston Children’s Hospital, Harvard Medical School, Boston, MA, United States, 2Department of Pattern Recognition, University of Erlangen-Nuremberg, Erlangen, Germany, 3School of Biomedical Engineering and Imaging Sciences, Faculty of Life Sciences and Medicine, King’s College London, London, United Kingdom
Synopsis
To develop an accurate and precise T1-mapping sequence, we combined the modified Look-Locker inversion recovery (MOLLI) and saturation recovery single-shot acquisition (SASHA) sequences--MOSHA. Compared to SASHA, MOSHA had similar accuracy and higher precision. Compared to MOLLI, MOSHA had better accuracy and lower precision.
Purpose
The longitudinal magnetization relaxation time (T1) has long been used for tissue characterization. 1, 2 More recently, there has been a surge in interest in measuring T1 of the myocardium. Increased non-contrast myocardial T1 values have been related to the acute myocardial infarction, and shortened post-contrast T1 values have been proven to be an indicator of diffuse myocardial fibrosis in patients with aortic stenosis and hypertrophic cardiomyopathy. 3, 4 Given these emerging indications of clinical utility, it is now important to optimize the precision and accuracy of the T1 mapping technique in order for it to mature into routine clinical practice. In this study, we sought to develop a new T1-mapping method, MOSHA, which is both accurate and precise by combining the modified Look-Locker inversion recovery (MOLLI) 5 and saturation recovery single-shot acquisition (SASHA) 6 sequences.Materials and Methods
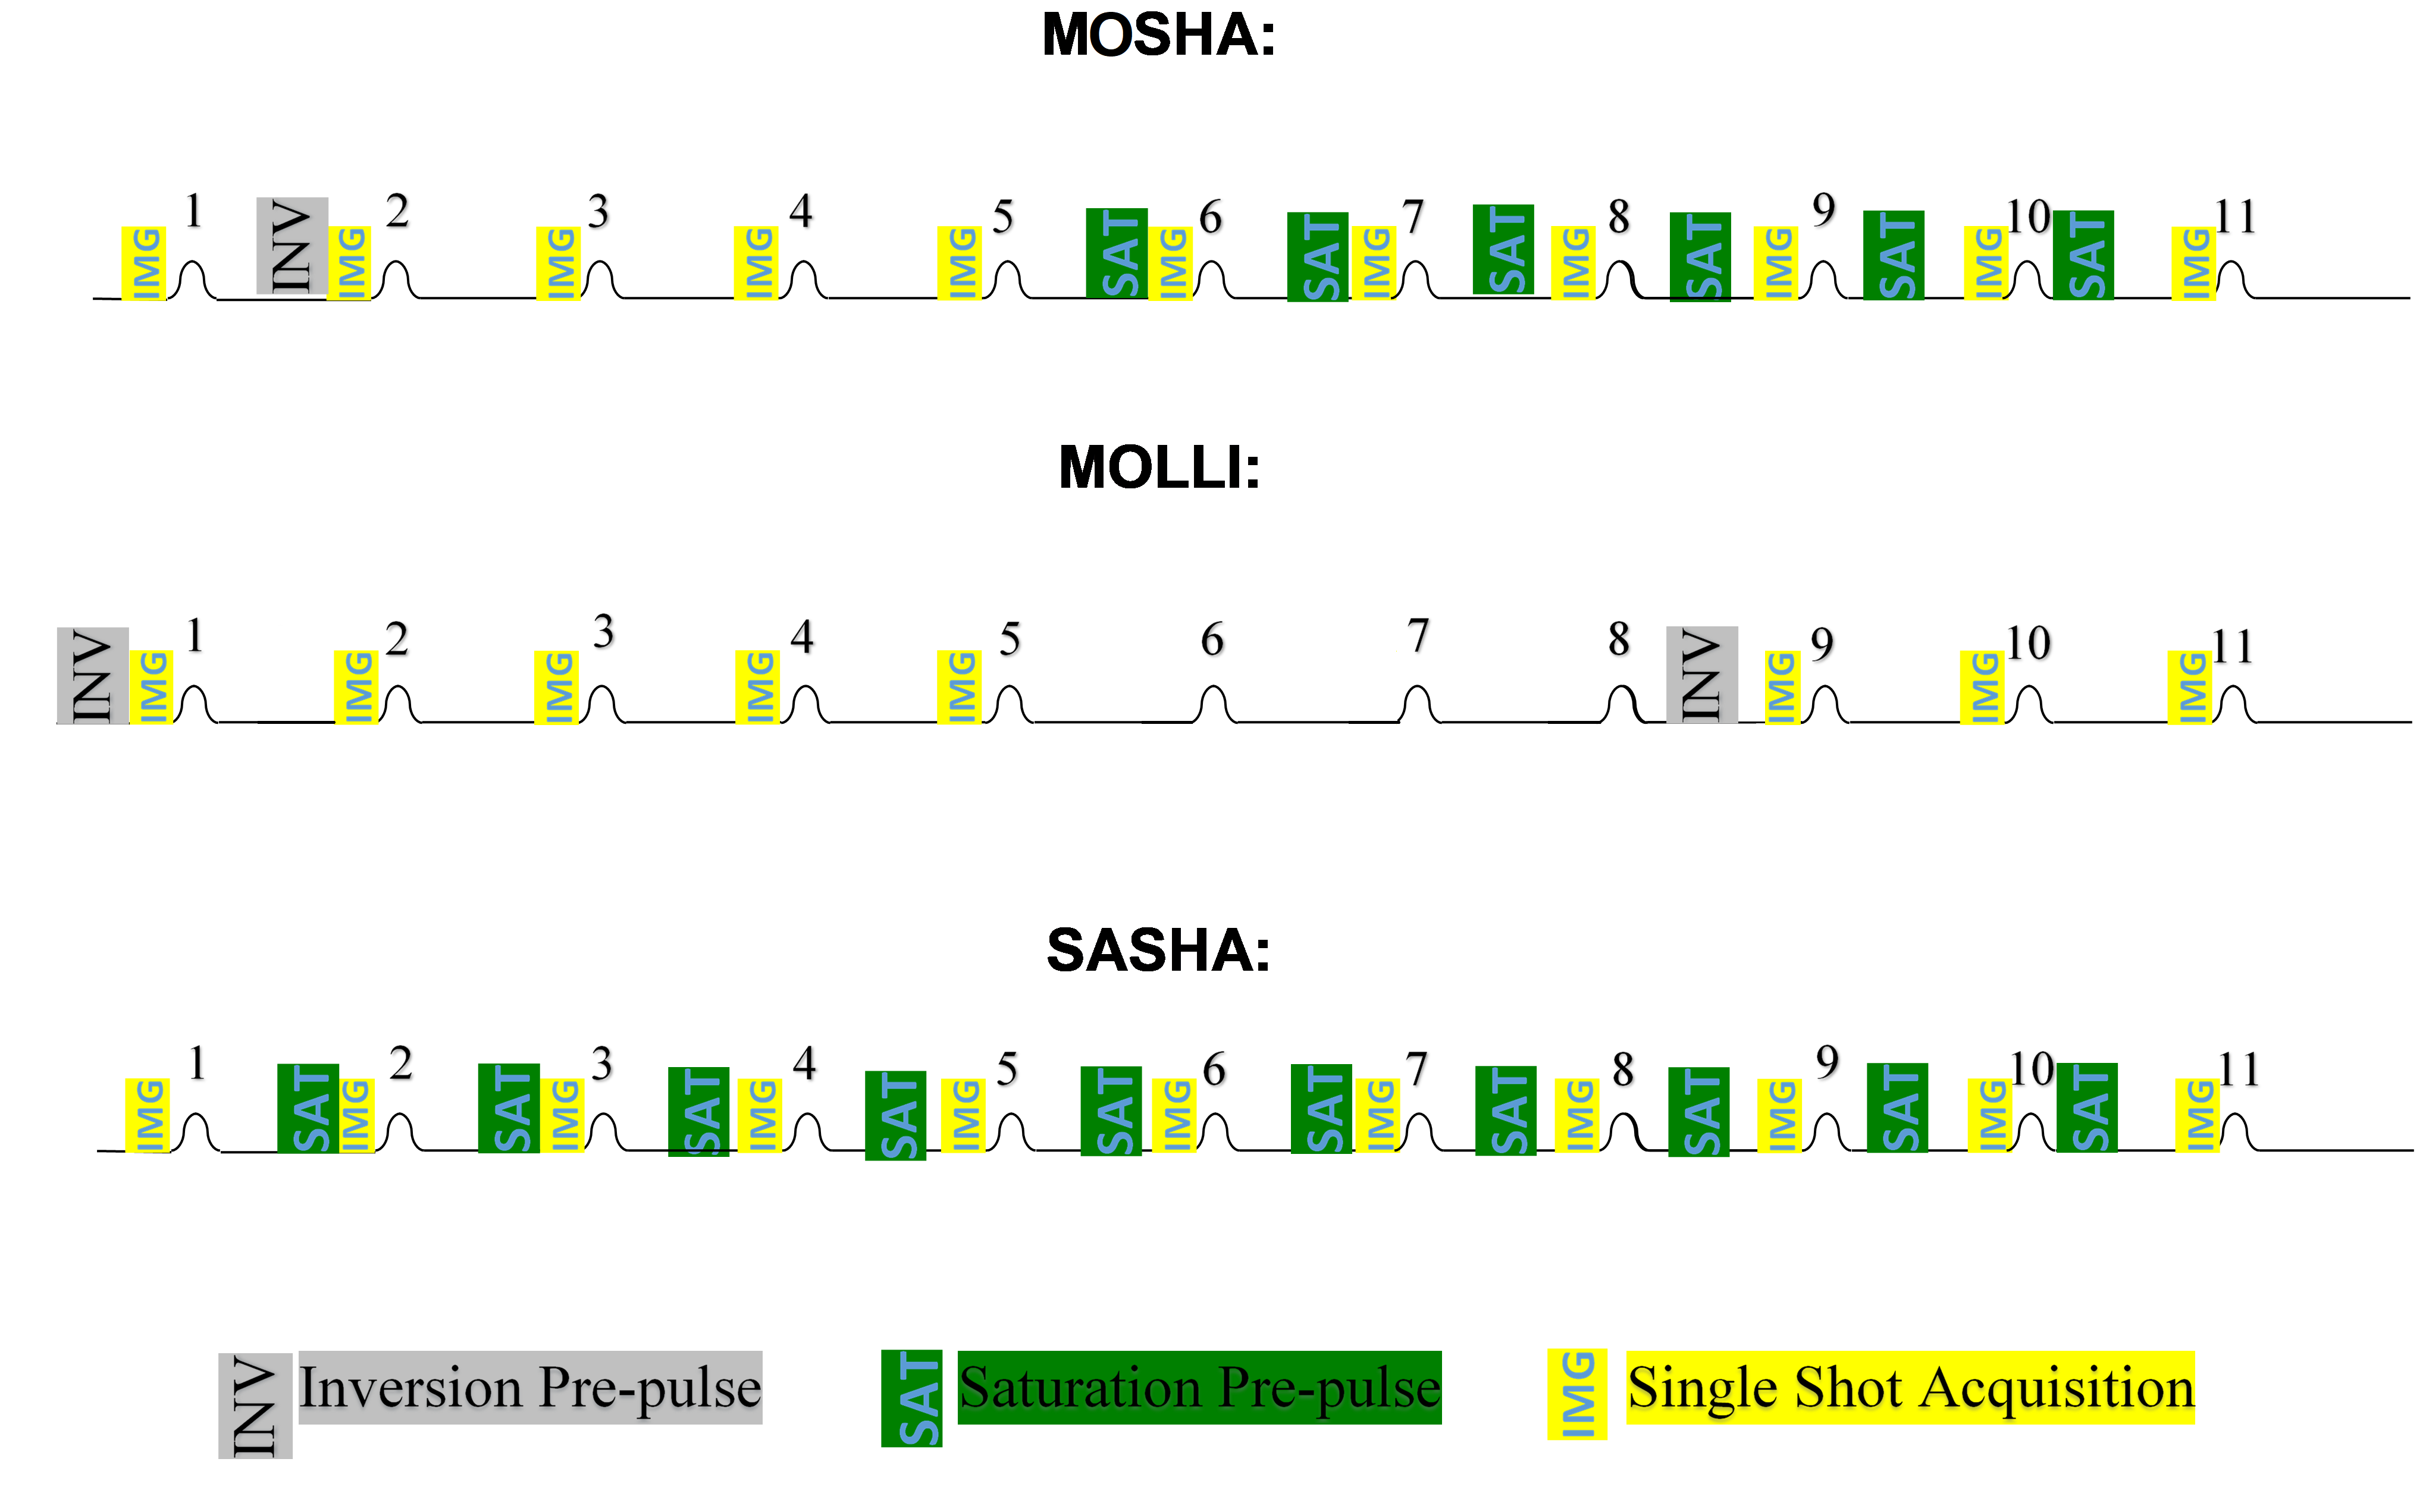
Figure 1 displays the schematic diagram of the MOSHA method. This method is based on the single-shot steady-state free precession sequence. As shown, 11 images are acquired in 11 beats to estimate the T1. As the MOLLI sequence, an inversion pre-pulse is applied in the second beat to reverse the longitudinal magnetization vector and sample the longitudinal recovery curve in the next 4 consecutive beats. As in SASHA sequence, an image is acquired in the first beat without applying any pre-pulse to sample the longitudinal recovery curve at time point infinity. A standard saturation pre-pulse with different delay times to the image acquisition is then applied in every cardiac cycle from beat 6 to 11 to sample the longitudinal recovery curve for another 6 times. To test the efficacy of MOSHA, we performed a study on a phantom containing 11 tubes with different T1 and T2 values 7 on a 1.5T MR Philips Achieva dStream scanner. We first, measured the T1 of each tube by using a spin echo (SE) sequence to acquire multiple 2D images at different inversion times and used this T1 as the reference. The imaging parameters for the SE sequence were as follows: field-of-view 200×154 mm, isotropic spatial resolution 1.2×1.2 mm, simulated heart rate 60 bpm, TE/ TR 11/10000 ms, inversion time 50-3000 ms, and scan time ≈22 minutes for each inversion time. The T1 of each tube was also measured with the MOLLI, SASHA, and MOSHA sequences and compared with the SE reference. The imaging parameters for MOLLI, SASHA, and MOSHA were the same as the SE sequence except for α/TE/TR 35°/1.5/3.0 ms and Bandwidth of 722.3 Hz/Pixel. A delay of 10 seconds was applied between each scan to allow for full recovery of the net magnetization vector. The scheme of MOLLI was 5 acquisitions, 3 heartbeat pauses, and 3 acquisitions with inversion delays of minimum and 350 ms. The saturation delay for SASHA was linearly changing from 75 ms to 650 ms. T1 values were calculated pixel-wise using an exponential curve with 3 parameters and a nonlinear least square solver in MATLAB (Mathworks, Natick, MA). The so-called Look-Locker correction was applied to the MOLLI measurements. 8 The T1 using MOLLI, SASHA, and MOSHA were then compared with the reference.Results and Discussion
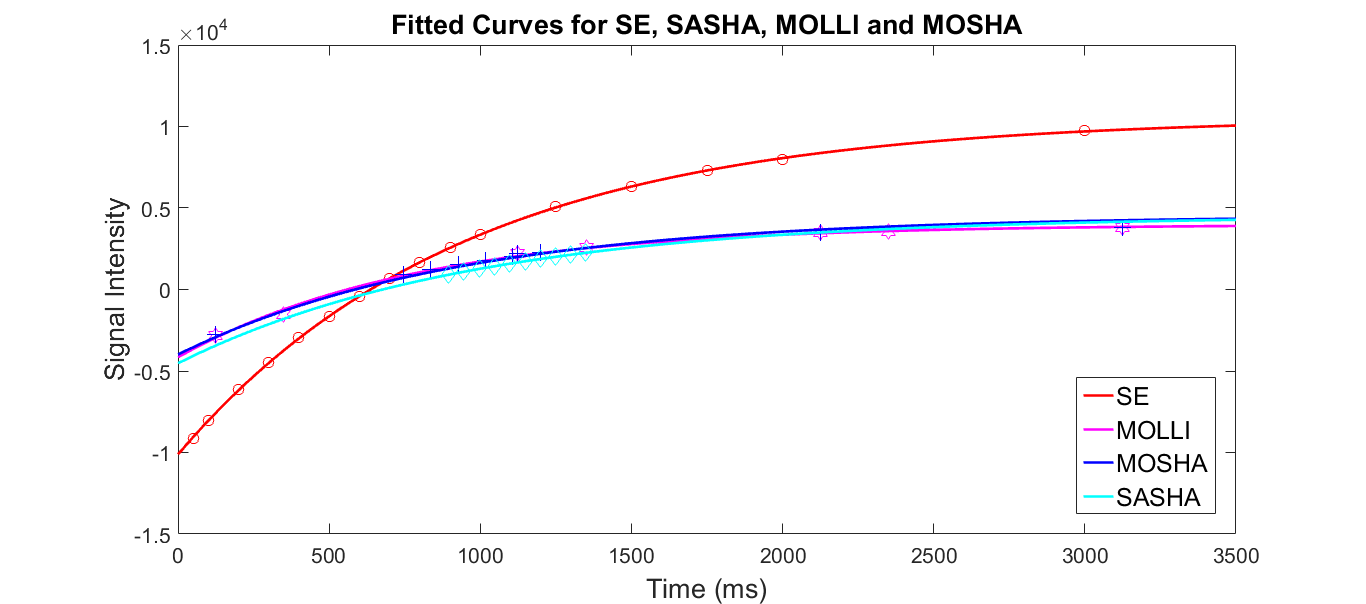
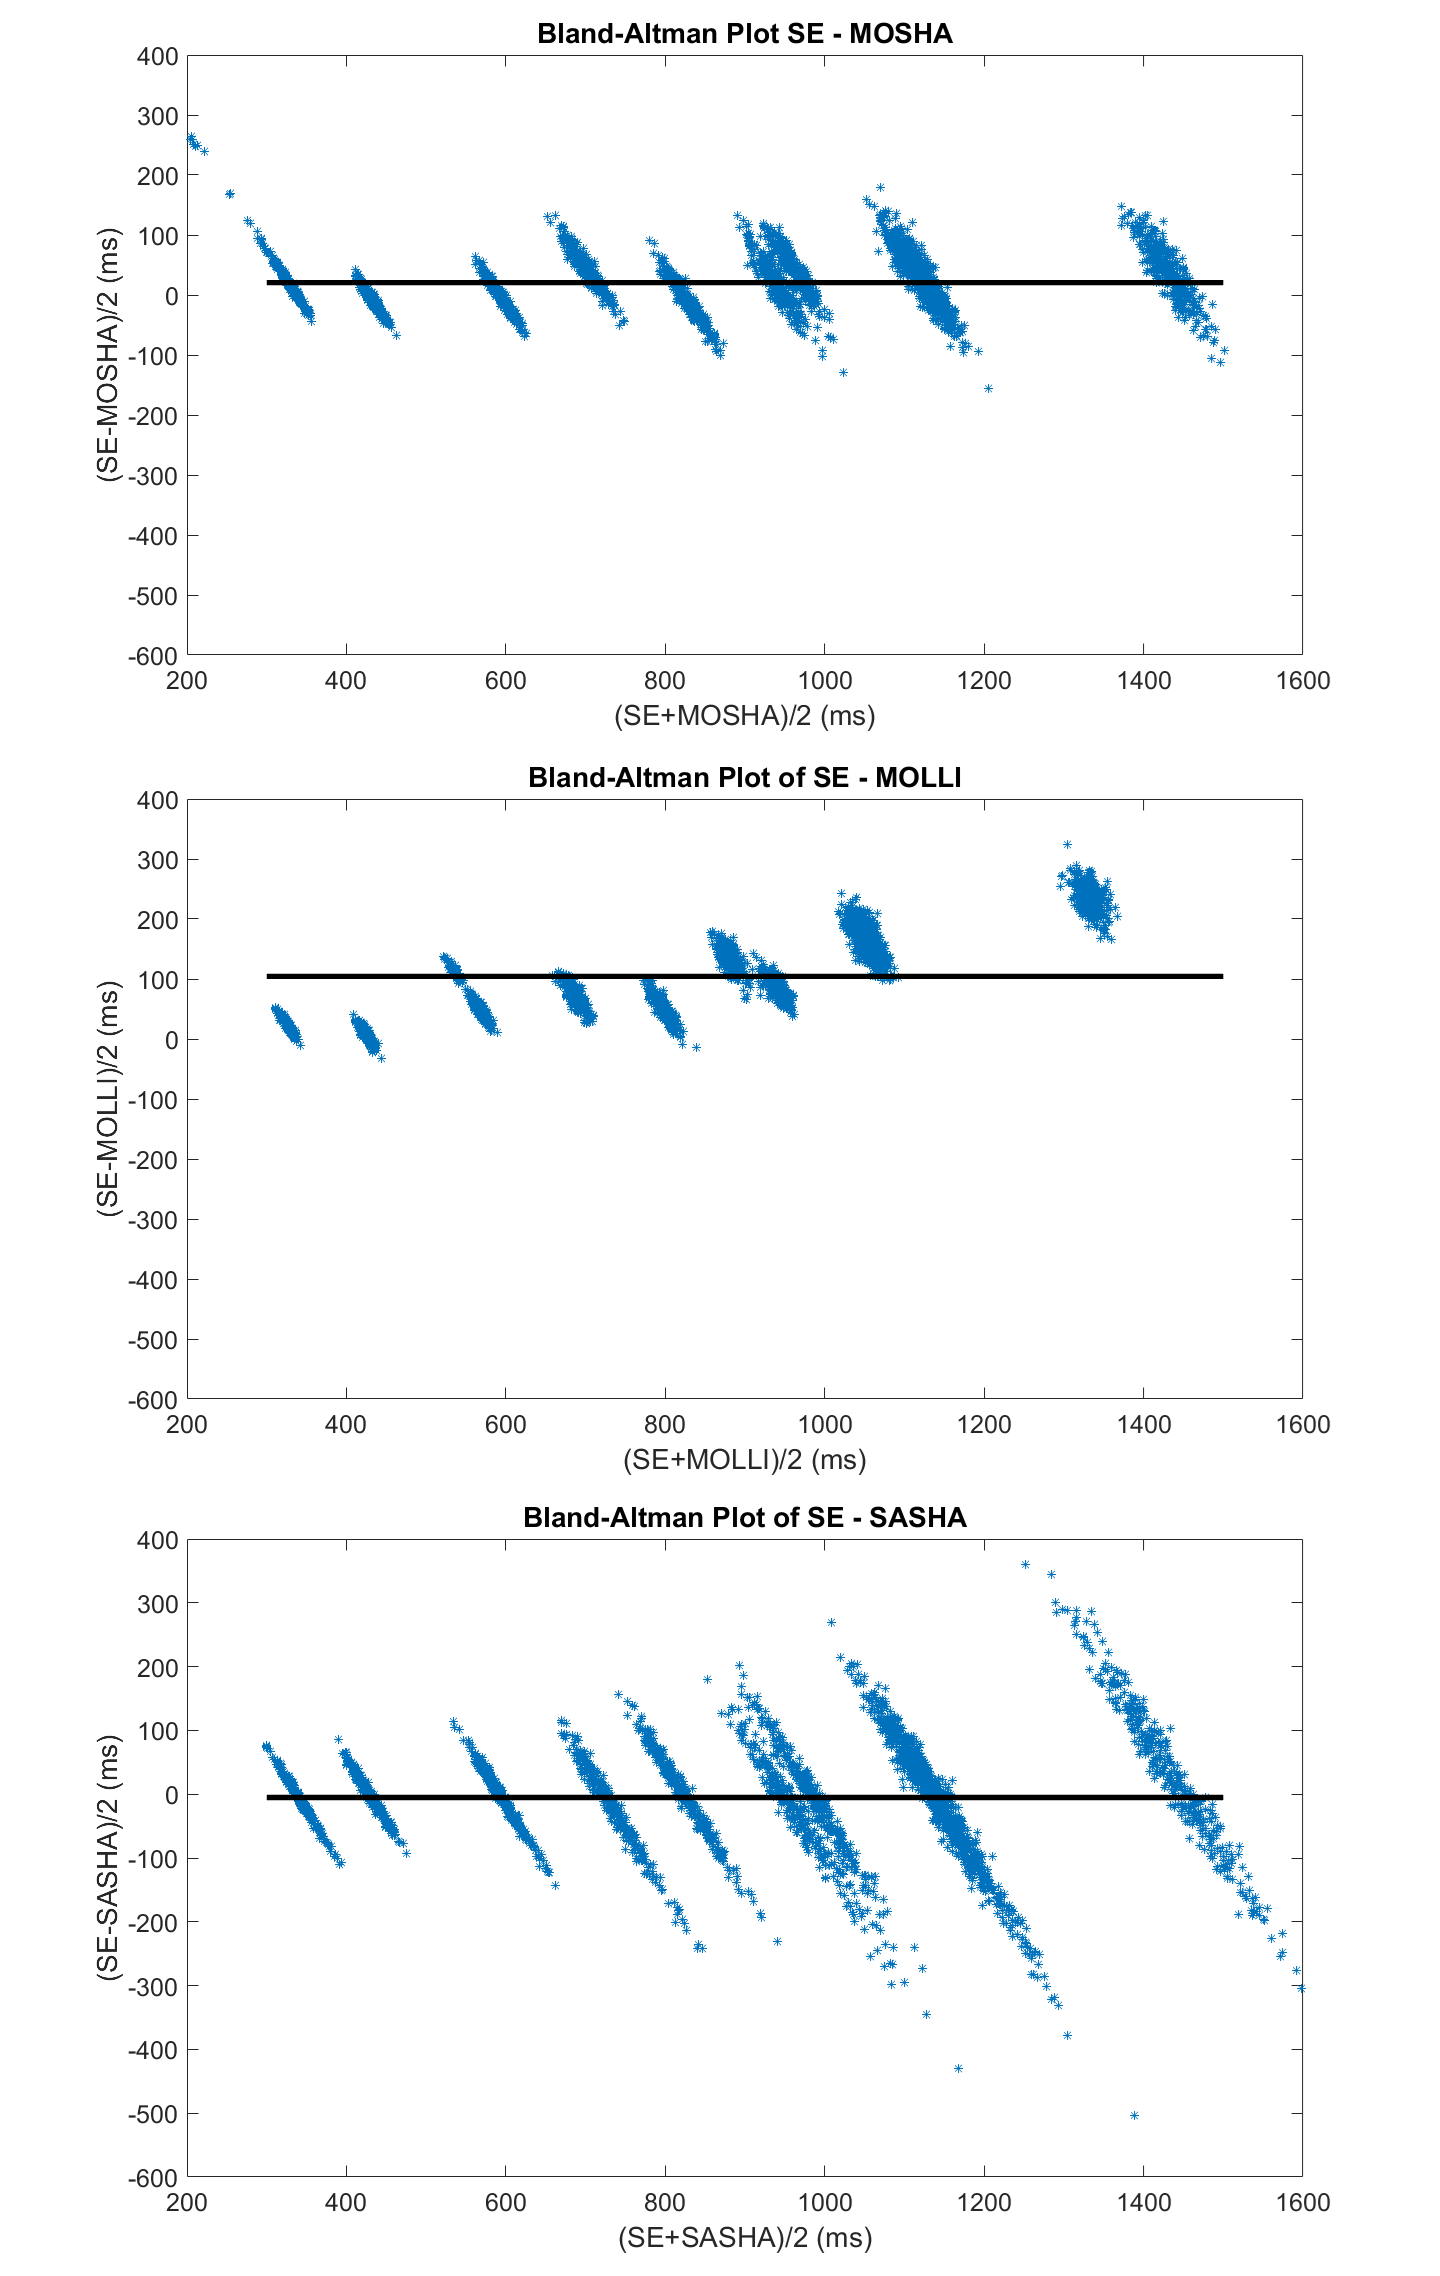
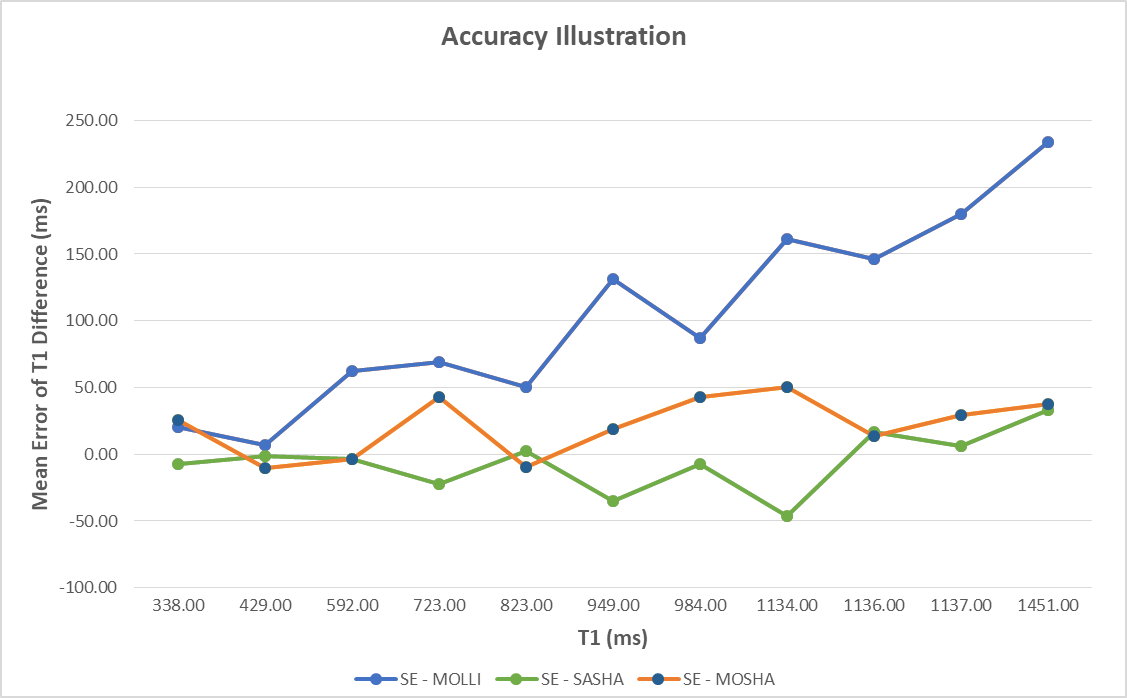
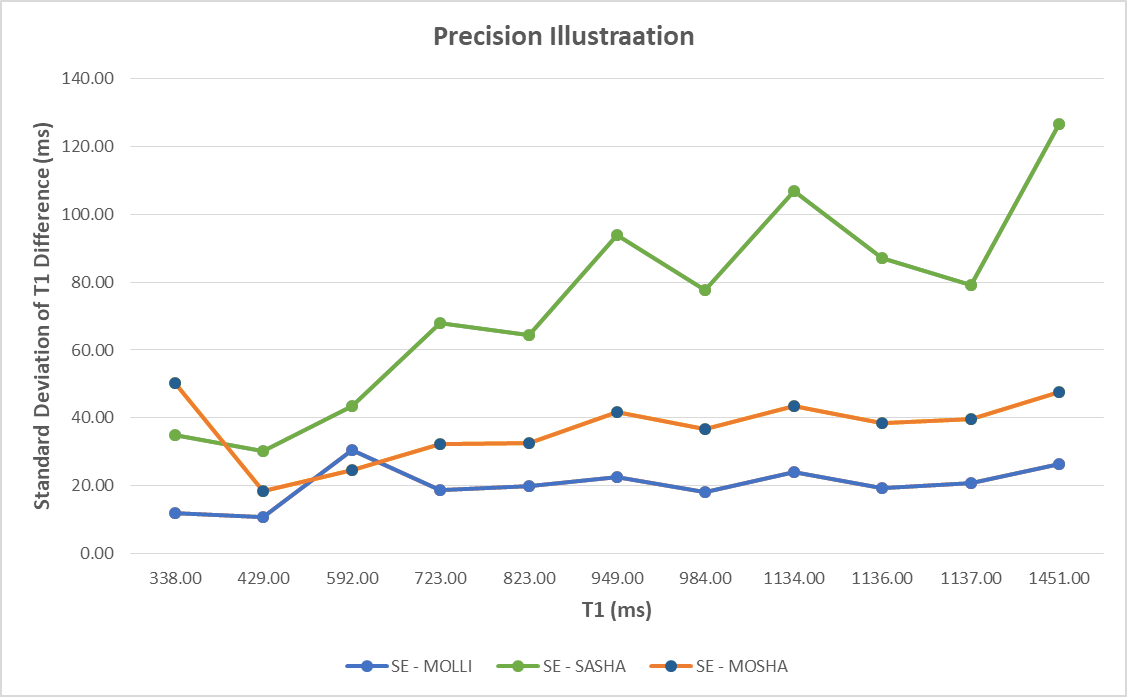
Figure 2 shows an example of exponential curves fitted to mean value in the region of interest of one tube in the phantom using SE, MOLLI, SASHA, and MOSHA sequences. Figure 3 illustrates the Bland-Altman plot of the mean difference between SE and MOSHA, SE and MOLLI, and SE and SASHA. The mean and standard deviation of T1 estimation error for different tubes in the phantom are shown in Figures 4 and 5. As shown for a different range of T1, the accuracy of MOSHA is close to that of SASHA and better than MOLLI. However, the precision of MOSHA is lower than MOLLI but higher than SASHA.Conclusion
We developed a new T1-mapping sequence with an improved precision and accuracy. The accuracy of the proposed method was better than MOLLI and similar to SASHA while its precession was better than SASHA and lower than MOLLI.Acknowledgements
No acknowledgement found.References
1. Flett AS, Hayward MP, Ashworth MT, Hansen MS, Taylor AM, Elliott PM, McGregor C, Moon JC. Equilibrium contrast cardiovascular magnetic resonance for the measurement of diffuse myocardial fibrosis: preliminary validation in humans. Circulation. 2010;122(2): 138-144.
2. Wacker CM, Bock M, Hartlep AW, Beck G, van Kaick G, Ertl G, Bauer WR, Schad LR. Changes in myocardial oxygenation and perfusion under pharmacological stress with dipyridamole: assessment using T*2 and T1 measurements. Magnetic Resonance in Medicine. 1999;41(4): 686-695.
3. Anish N Bhuva, Thomas A Treibel, Marianna Fontana, Anna S Herrey, Charlotte H Manisty, James C Moon. T1 mapping: non-invasive evaluation of myocardial tissue composition by cardiovascular magnetic resonance. Expert Review of Cardiovascular Therapy. 2014;12(12): 1455-64.
4. Bharath Ambale-Venkatesh, João A. C. Lima. Cardiac MRI: a central prognostic tool in myocardial fibrosis. Nature Reviews Cardiology. 2015;12: 18-29.
5. Messroghli, D. R., Radjenovic, A., Kozerke, S., Higgins, D. M., Sivananthan, M. U., Ridgway, J. P. Modified Look-Locker inversion recovery (MOLLI) for high-resolution T1 mapping of the heart. Magnetic Resonance in Medicine. 2004;52: 141-146.
6. Chow, K., Flewitt, J. A., Green, J. D., Pagano, J. J., Friedrich, M. G., Thompson, R. B. Saturation recovery single-shot acquisition (SASHA) for myocardial T1 mapping. Magnetic Resonance in Medicine. 2014;71: 2082-2095.
7. Roujol S, Weingärtner S, Foppa M, et al. Accuracy, precision, and reproducibility of four T1 mapping sequences: a head-to-head comparison of MOLLI, ShMOLLI, SASHA, and SAPPHIRE. Radiology. 2014;272(3): 683-689.
8. Kellman P, Hansen MS. T1-mapping in the heart: accuracy and precision. Journal of Cardiovascular Magnetic Resonance. 2014;16(1): 2.
Figures