4768
Assessing the optimal preparation strategy to minimize variability of pyruvate dehydrogenase flux measurements with hyperpolarized [1-13C]pyruvate MRS in control and type 2 diabetic rats1Department of Physiology Anatomy and Genetics, University of Oxford, Oxford, United Kingdom, 2Oxford Center for Clinical Magnetic Resonance Research, University of Oxford, Oxford, United Kingdom, 3Department of Physics, University of Oxford, Oxford, United Kingdom
Synopsis
Hyperpolarized [1-13C] pyruvate MRS measures pyruvate dehydrogenase (PDH) flux in vivo in the heart through 13C-label incorporation into bicarbonate. Substrate availability modulates PDH flux; clinical protocols attempt to standardize flux with oral glucose loading prior to scanning, while rodents in preclinical studies are scanned in the fed state. We set out to establish whether feeding or glucose loading leads to more reproducible measurements of PDH flux in control rats, and found a variability of 45.1% in fed and 50.0% in glucose-loaded animals. Furthermore, glucose loading did not alter the low PDH flux seen in type II diabetic rats.
Introduction
Investigating cardiac metabolism in vivo is now possible via a number of evolving techniques1, with hyperpolarized magnetic resonance imaging allowing real time assessment of metabolic flux downstream of an administered 13C labelled substrate. Indeed, sterile hyperpolarizer systems have afforded the first in vivo studies of PDH flux in the resting human heart.2,3 13C MRS of [1-13C]pyruvate allows measurements of pyruvate dehydrogenase (PDH) flux via incorporation of the 13C label into bicarbonate. PDH flux alters with substrate availability to modulate the relative contributions of fatty acid and glucose oxidation to ATP production4. Accordingly, decreased PDH flux is seen in the fasted state where increased fatty acid oxidation manifests as reduced 13C label flux into bicarbonate5. Metabolic standardization of patients prior to hyperpolarized imaging is attempted with an oral glucose load, whereas preclinical studies are performed in overnight fed rodents. Which approach yields more robust, reproducible measurements is unknown. We therefore wanted to establish in healthy rats, whether the variability in PDH flux is lower after feeding or after a standardized glucose injection. We furthermore wanted to assess whether metabolic standardization through glucose injection affects established pathophysiological blunting of PDH flux in the diabetic heart.Methods
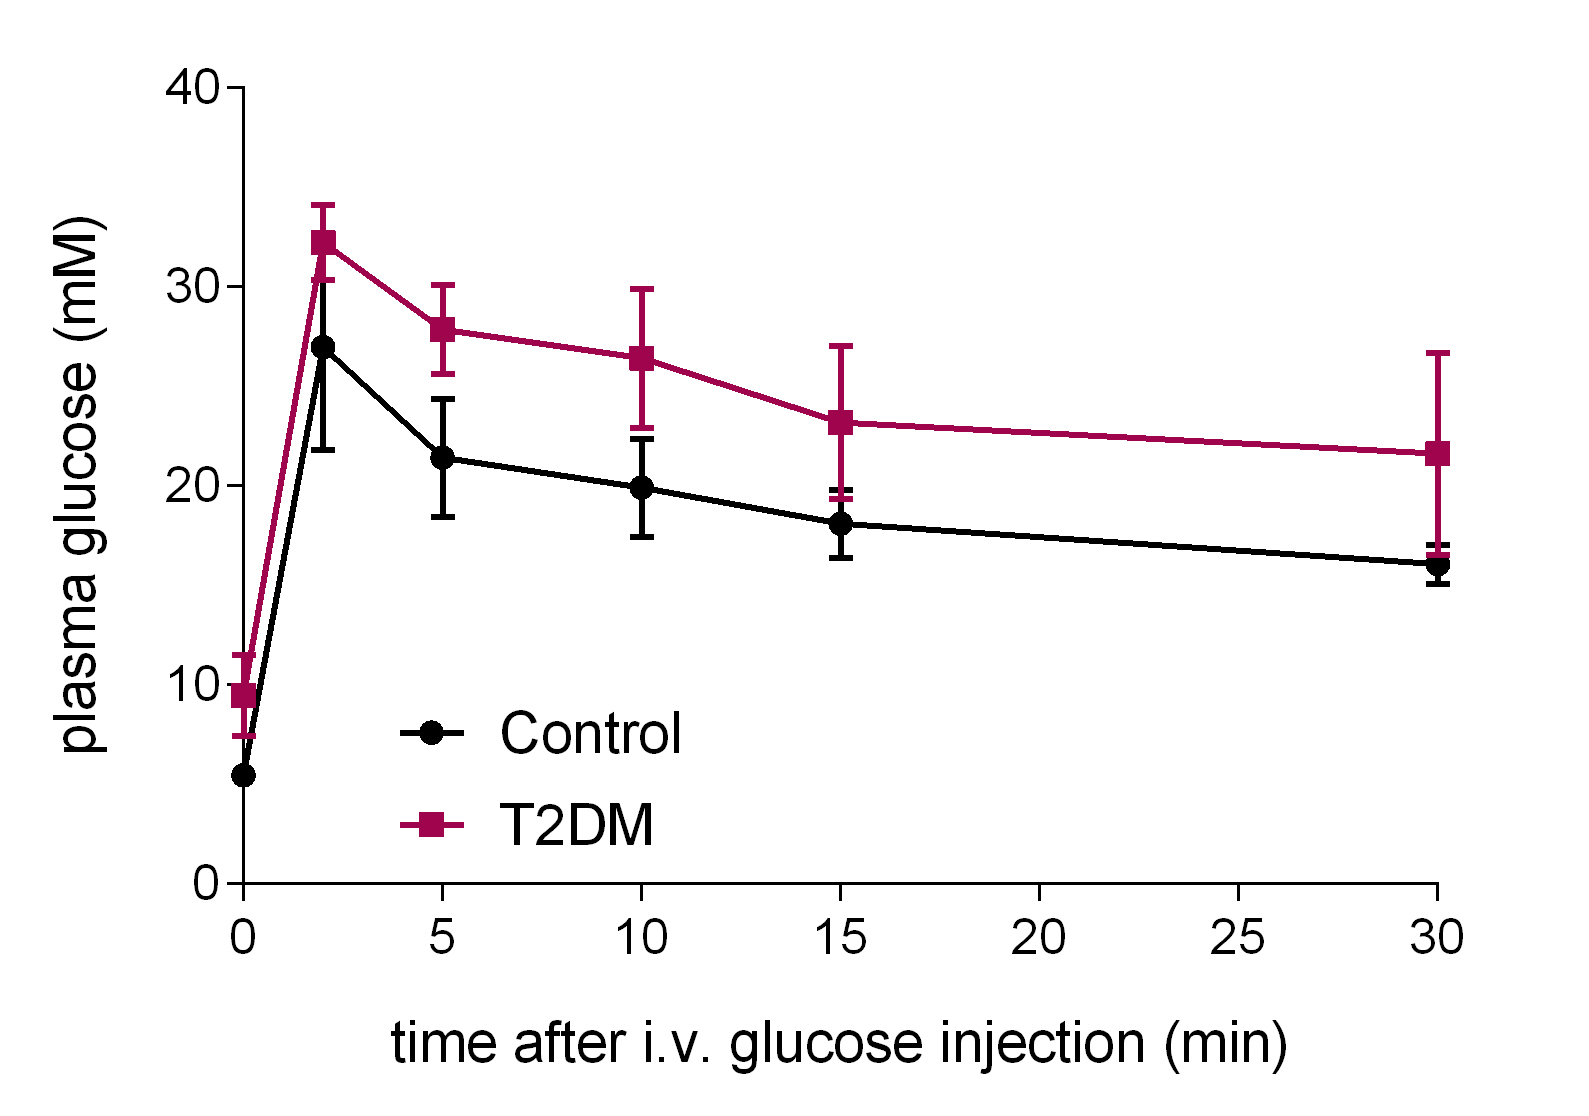
24 age-matched female Wistar rats were divided into two groups: a control group receiving normal chow and a diabetic group receiving a high fat (60%) diet for 11 weeks. Two weeks after initiation of high fat feeding, rats were injected i.p. with a low dose (25 mg/kg) of streptozotocin (STZ) in citrate buffer to induce type II diabetes6. Fasting blood glucose was assessed two weeks later and, if blood glucose did not exceed 8mM, a second 25 mg/kg STZ injection was performed at week 5. Rats with a fasting glucose of 8-14mM were used for subsequent experiments. At week 8, intravenous glucose tolerance tests were performed. At week 9, rats received two hyperpolarized [1-13C]pyruvate scans: one in the fed state, and one two days later after an overnight fast (12-18h) and 30 minutes after a 1g/kg glucose infusion, in each case between 7 am and 1 pm. [1-13C]pyruvate was hyperpolarized as described previously7 and 1 mL of 80mM pyruvate was injected into the tail vein of anaesthetized rats over 10s. 13C MR spectra were acquired in a 10 mm axial slice covering the heart, every second for 120s in a 7T spectrometer (Varian) using a 72-mm dual-tuned birdcage volume transmit 1H/13C coil and a 13C two-channel surface receive coil (Rapid Biomedical; 15º hard pulse; 13kHz bandwidth). Multicoil spectra were recombined by WSVD8, and the first 30s of spectra from appearance of the pyruvate peak were summed and quantified with AMARES/jMRUI9.Results
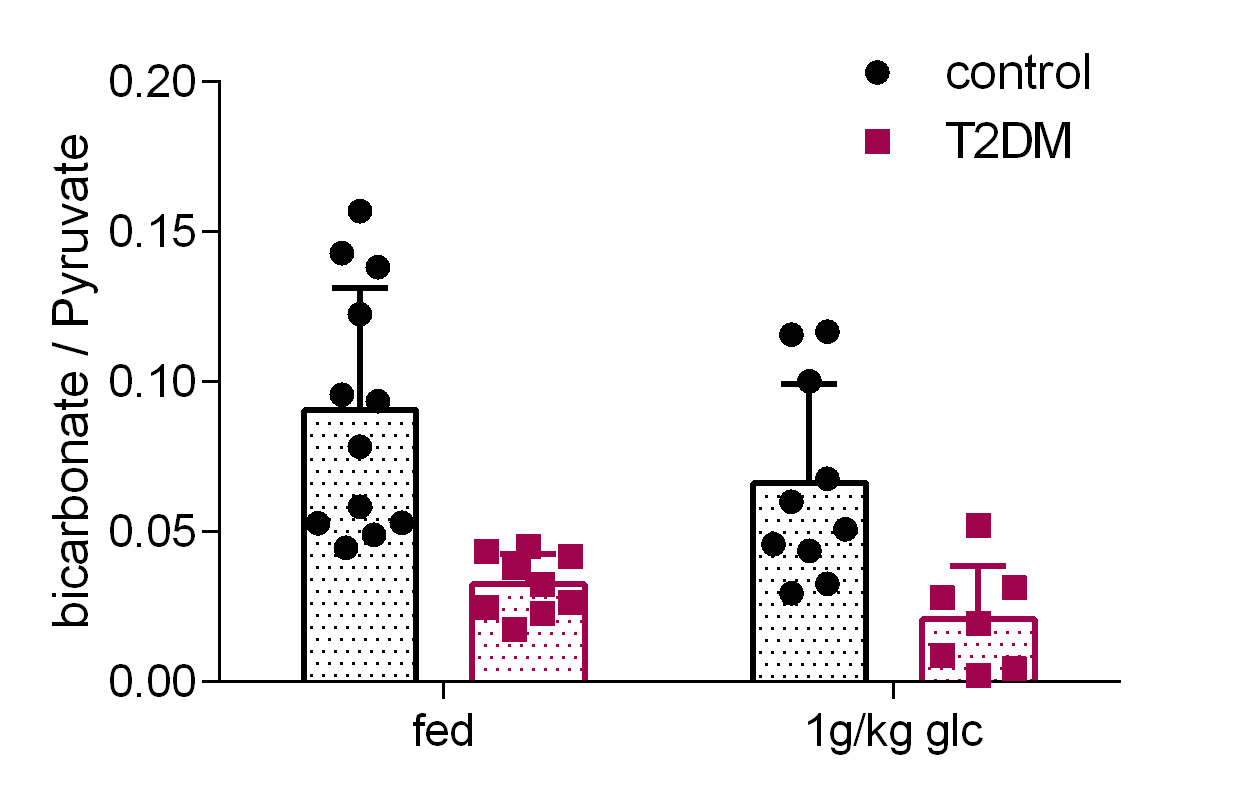
The type II diabetic rats (T2DM, n=9) showed impaired glucose tolerance compared to their age-matched controls (Figure 1). For both control and diabetic rats the bicarbonate/pyruvate ratio was lower after fasting and glucose injection than after feeding although this was not significant (p=0.056, 2-way ANOVA) (Figure 2). In fed control rats the mean bicarbonate to pyruvate ratio was 0.091±0.041 (n=12) and in fasted, glucose-injected rats 0.066±0.033 (n=10), corresponding to a 45.1% and 50.0% variability. T2DM rats had significantly decreased myocardial bicarbonate labeling from hyperpolarized [1-13C]pyruvate both in the fed state (p=0.0005) and after overnight fasting followed by glucose administration (p=0.0049).Discussion
The variability in PDH flux was similar between fed, and fasted plus glucose-injected control rats. PDH flux was significantly lower in type II diabetic rats irrespective of prior standardization with an intravenous glucose infusion.Conclusion
In pre-clinical studies, metabolic standardization with glucose appears to provide similar levels of reproducibility to scanning in the fed state. In addition, glucose loading does not alter known pathophysiological metabolic changes in PDH metabolism seen in type II diabetes.Acknowledgements
We would like to acknowledge the British Heart Foundation, the British Heart Foundation Oxford Centre for Research Excellence and the Novo Nordisk FoundationReferences
1. Taegtmeyer H, Young ME, Lopaschuk GD, et al. Assessing Cardiac Metabolism: A Scientific Statement From the American Heart Association. Circ Res 2016;118:1659-701.
2. Cunningham CH, Lau JY, Chen AP, et al. Hyperpolarized 13C Metabolic MRI of the Human Heart: Initial Experience. Circ Res 2016;119:1177-82.
3. Tyler DJ, Rider OJ, Dodd MS, et al. Demonstrating the Randle Cycle In Vivo: Assessment of Physiological Alterations in Human Cardiac Metabolism Using Hyperpolarised 13C MR Spectroscopy. Proc Intl Soc Mag Reson Med 2017;25:0726.
4. Randle PJ, Garland PB, Hales CN, Newsholme EA. The glucose fatty-acid cycle. Its role in insulin sensitivity and the metabolic disturbances of diabetes mellitus. Lancet 1963;1:785-9.
5. Schroeder MA, Cochlin LE, Heather LC, Clarke K, Radda GK, Tyler DJ. In vivo assessment of pyruvate dehydrogenase flux in the heart using hyperpolarized carbon-13 magnetic resonance. Proceedings of the National Academy of Sciences of the United States of America 2008;105:12051-6.
6. Mansor LS, Gonzalez ER, Cole MA, et al. Cardiac metabolism in a new rat model of type 2 diabetes using high-fat diet with low dose streptozotocin. Cardiovascular diabetology 2013;12:136.
7. Dodd MS, Atherton HJ, Carr CA, et al. Impaired in vivo mitochondrial Krebs cycle activity after myocardial infarction assessed using hyperpolarized magnetic resonance spectroscopy. Circulation Cardiovascular imaging 2014;7:895-904.
8. Rodgers CT, Robson MD. Coil combination for receive array spectroscopy: Are data-driven methods superior to methods using computed field maps? Magnetic resonance in medicine 2016;75:473-87.
9. Vanhamme L, van den Boogaart A, Van Huffel S. Improved method for accurate and efficient quantification of MRS data with use of prior knowledge. J Magn Reson 1997;129:35-43.
Figures