4766
Detection of early phase of deep vein thrombosis with diffusion-weighted magnetic resonance imaging.1Department of Radiological Technology, Koga general hospital, Miyazaki, Japan, 2Department of Pathology, Faculty of Medicine, University of Miyazaki, Miyazaki, Japan, 3Department of Radiology, Faculty of Veterinary Medicine, University of Miyazaki, Miyazaki, Japan, 4Faculty of Health Sciences, Institute of Medical, Pharmaceutical and Health Sciences, Kanazawa University, Kanazawa, Japan, 5Department of Internal Medicine, Koga General Hospital, Miyazaki, Japan
Synopsis
To detect and characterize deep vein thrombus (DVT), we performed diffusion weighted magnetic resonance imaging (MRI) in 8 patients and a rabbit model of DVT. All patients were detected DVT as high or mixed high and iso signal intensity on diffusion weighted MRI. The rabbit venous thrombi showed high signal intensity on diffusion weighted MRI at 4 hours, or mixed iso to high and low signal intensity at 1, 2, 3 weeks. The signal intensity was positively correlated with erythrocyte contents. Diffusion weighted MRI can detect DVT and high signal intensity on the sequence may reflect early phase of DVT.
Abstract
Introduction: Deep vein thrombosis/ thrombus (DVT) can cause pulmonary thromboembolism, a life threatening hemodynamic disease. It is important to detect early phase of DVT for the strategy of anti-thrombotic therapy, because it has a certain risk of bleeding. However, current non-invasive imaging techniques cannot reliably assess the age of DVT. Magnetic resonance (MR)-diffusion weighted imaging (DWI) can visualize diffusion capacity of water molecules in the tissue, therefore, we hypothesized that the signal intensity on DWI may reflect age of the DVT. The aims of this study are to investigate whether DWI can detect the thrombus in patients with DVT and define the thrombus age in a rabbit model of venous thrombus.
Methods: We performed MR-DWI in 8 patients with DVT using a 1.5 T MR system and 12-channel body-phased array coil (Signa HDxt; GE). DWI was performed in the transverse plane using single-shot echo planar imaging with fat suppression and short-tau inversion recovery (STIR). DWI was acquired at a repetition time (TR), echo time (TE) and IR of 8000/65.3/200 ms, field of view (FOV), 480 × 480 mm; slice thickness, 7.0 mm with 1.4-mm overlap; phase FOV, 0.5; number of excitations (NEX), 2; receiver bandwidth (BW), ±250 kHz; matrix, 64 × 128 and b values of 0 and 1000 mm2/s (Diffusion direction: ALL). Venous thrombus was induced in rabbit jugular vein by endothelial denudation and 10 minutes blood stasis with a balloon catheter. The thrombus was imaged with a 3.0-T MR system (Vantage; Toshiba) at 4 hours and at 1, 2 and 3 weeks, and the jugular veins were histologically assessed. DWI was acquired at a TR, TE and IR of 8000/65.3/200 ms, field of view (FOV), 180 × 180 mm; slice thickness, 4.0 mm; number of excitations (NEX), 2; receiver bandwidth (BW), ±250 kHz; matrix, 128 × 128 and b values of 0 and 1000 mm2/s (Diffusion direction: ALL). We assessed apparent diffusion coefficient (ADC) and signal intensity (SI) of the thrombi. We analyzed ADC and SI using Image-J (NIH). Thrombus SI was normalized to that of the adjacent muscle. The rabbit jugular veins with thrombi were stained with hematoxylin eosin, sirius red (collagen), berlin blue (hemosiderin), anti-glycophorin A (erythrocyte), anti-fibrin, anti-glycoprotein IIb/IIIa (platelets), anti-rabbit macrophage (RAM11), and anti-smooth muscle actin (smooth muscle cell: SMC) antibodies. The cellular-, iron-, or matrix-areas in the thrombi were assessed with image analyzing software.
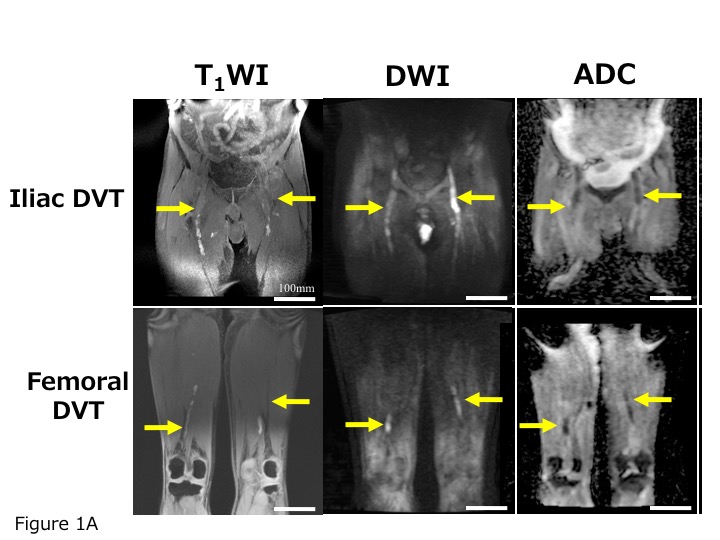
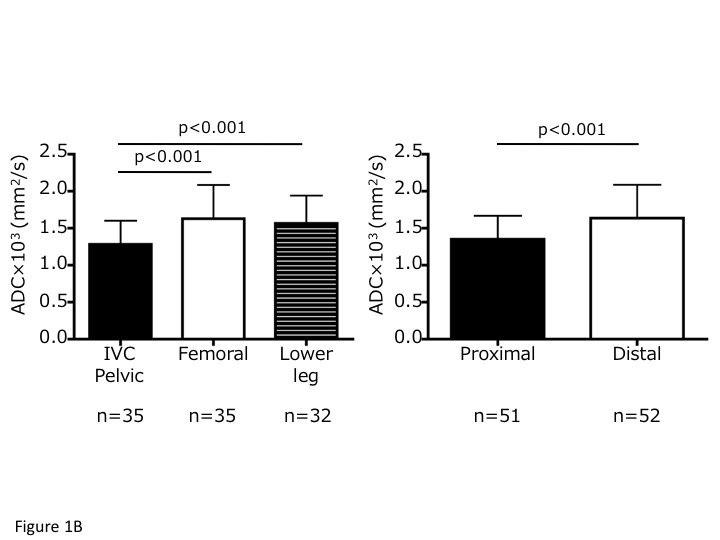
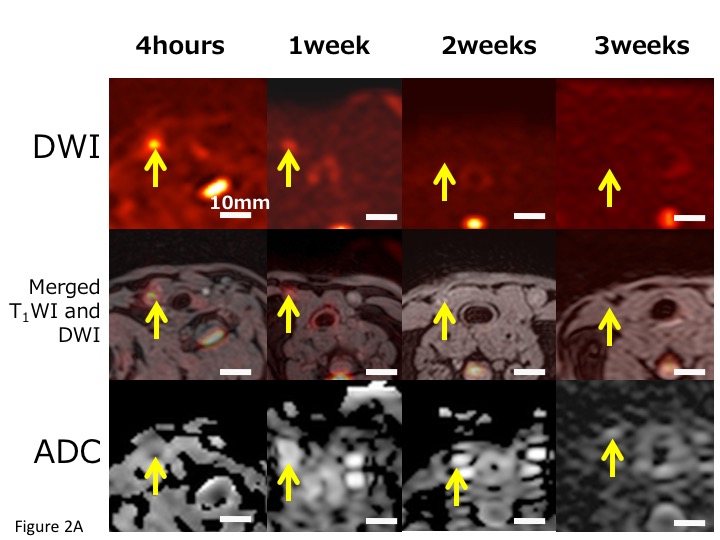
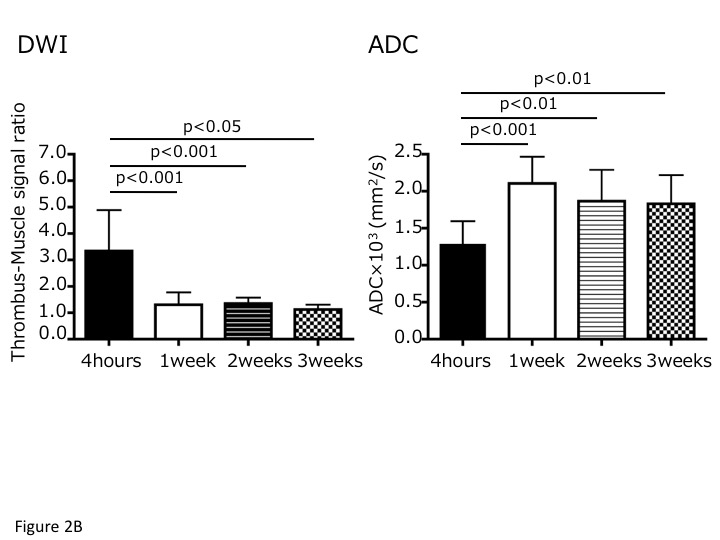
Results: All patients were detected DVT as high or mixed high and iso signal intensity on the diffusion sequence. The SI or ADC values at inferior vena cava and pelvic DVT were higher or smaller than those at femoral and lower leg DVT, respectively. The SI or ADC values at proximal portion in each DVT were higher or smaller than those at distal portion, respectively (Figure 1). The rabbit thrombi showed high SI on diffusion weighted MR imaging at 4 hours, mixed high and iso SI at 1 and 2 weeks, or mixed iso and low SI at 3 weeks (Figure 2). The rabbit venous thrombi histologically showed time-dependent organizing reaction. The SI in rabbit DVT was positively correlated with erythrocyte (n=78, Spearman r=0.64, p<0.0001) and fibrin contents (n=78, r=0.31, p<0.006), and negatively correlated with macrophage (n=78, r=-0.63, p<0.0001) and collagen contents (n=78, r=-0.52, p<0.0001). The ADC values were negatively correlated with erythrocyte (n=77, r=-0.49, p<0.0001), and positively correlated with SMC (n=77, r=0.50, p<0.0001), macrophage (n=77, r=0.51, p<0.0001), hemosiderin (n=77, r=0.42, p<0.0001) and collagen contents (n=77, r=0.38, p<0.0005) .
Discussion: DW-MRI can detect DVT and high SI on the sequence may reflect early phase of DVT.
Conclusion: DW-MRI may provide valuable information for the strategy of anti-thrombotic therapy in patients with DVT.
Acknowledgements
This work was supported by KAKENHI (16K09019).References
No reference found.Figures