4765
T1-mapping Cardiac-Manganese Enhanced MRI: Assessment of Calcium Homeostasis and Ischemic Injury in Mice1Division of Medicine, UCL Centre for Advanced Biomedical Imaging, London, United Kingdom, 2School of Medical Imaging, Universiti Sultan Zainal Abidin, Terengganu Darul Iman, Malaysia, 3Biomedical Engineering, Kings College London, London, United Kingdom, 4Perinatal Imaging & Health, Kings College London, London, United Kingdom
Synopsis
Intracellular MR contrast agents can provide essential information on cell viability. Manganese (Mn2+) is an efficient intracellular MR contrast agent. As an analogue of Calcium, Mn2+-induced changes in T1 and can be used as an indicator of the rate of Ca2+ influx into cardiomyocytes in vivo and could provide additional information to that routinely acquired using late Gd-enhanced MRI. By preloaded the myocardium with Mn2+ prior to coronary occlusion, we showed that MEMRI T1-mapping allows sensitive in vivo detection of subtle changes and accumulation of Mn2+ in viable myocytes in the early phase of myocardial injury.
Introduction
Although manganese-enhanced MRI (MEMRI) can be used to non-invasively image myocardial viability, concerns over Mn2+ cardiotoxicity1,2 have limited the number of MEMRI studies conducted in heart as compared to brain. However, these effects can be counteracted by optimizing Mn dose and calcium supplements2, meaning Mn2+ contrast agents are now in use in clinical trials3. Mn2+ enters viable cardiomyocytes via L-type voltage gate channels and enhances intracellular T1 relaxation. As an analogue of Calcium, Mn2+-induced changes in T1 can be used as an indicator of Ca2+ influx rate into cardiomyocytes in vivo4 and could provide additional information to that routinely acquired using late Gd-enhanced MRI. We hypothesized that Mn2+ mediated changes in T1 could reflect Ca2+ influx in myocardium during ischemic injury. By preloaded the myocardium with Mn2+ prior to coronary occlusion, we aimed to assess the efficacy of MEMRI T1-mapping in monitoring dynamic features of intracellular Ca2+ response to ischemic injury in a mouse model of myocardial infarction (MI). The present study is the first quantitative in vivo MRI assessment of calcium homeostasis in the early phase of myocardial injury.Materials and Methods
All procedures complied with the UK Home Office and local animal care and welfare committees. In the MI group, adult male C57B1/6 mice received intraperitoneal injections of 2 µL per gram body weight of 50mM MnCl2 40 minutes before left anterior descending (LAD) coronary artery occlusion. T1-mapping was used to monitor dynamic alterations of calcium homeostasis at 1, 2 and 3 hours after LAD occlusion and at 2 days, with Mn2+ injected 100min prior to MRI (Mn2+ loading time similar to the 1 hour post-MI group). Imaging was performed in the mid-papillary short axis view as described5 using a Look-locker inversion recovery sequence, TE/TR=0.99/3ms, effective TR=~3s over 3 breaths, 18 gradient-echo inversions with TI at ~100ms intervals dependent upon heart rate, FOV=25.6mm2, matrix=1282, FA=10º, slice thickness=1.0mm using a 9.4T MRI Agilent system. T1 and R1 (1/T1) maps were generated using in-house MATLAB code6. For analysis R1 values were analysed from 3 tissue types: Infarcted hearts were classified into area at risk segments (AAR-MI, n=12) and viable segments (Viable-MI, n=12): These were compared to naïve control heart data (Viable-Naïve, n=12). R1 values of the LV blood pool were also measured.Results
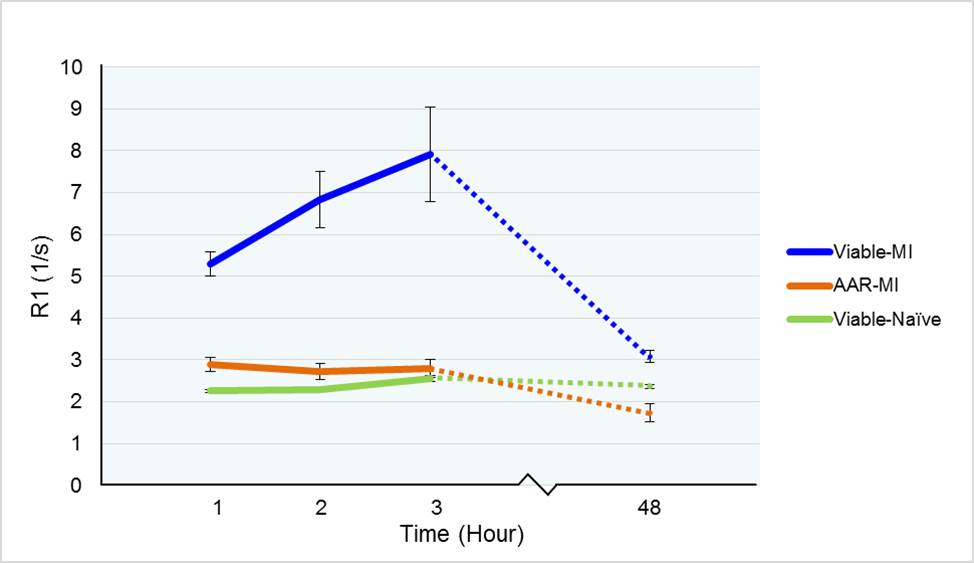
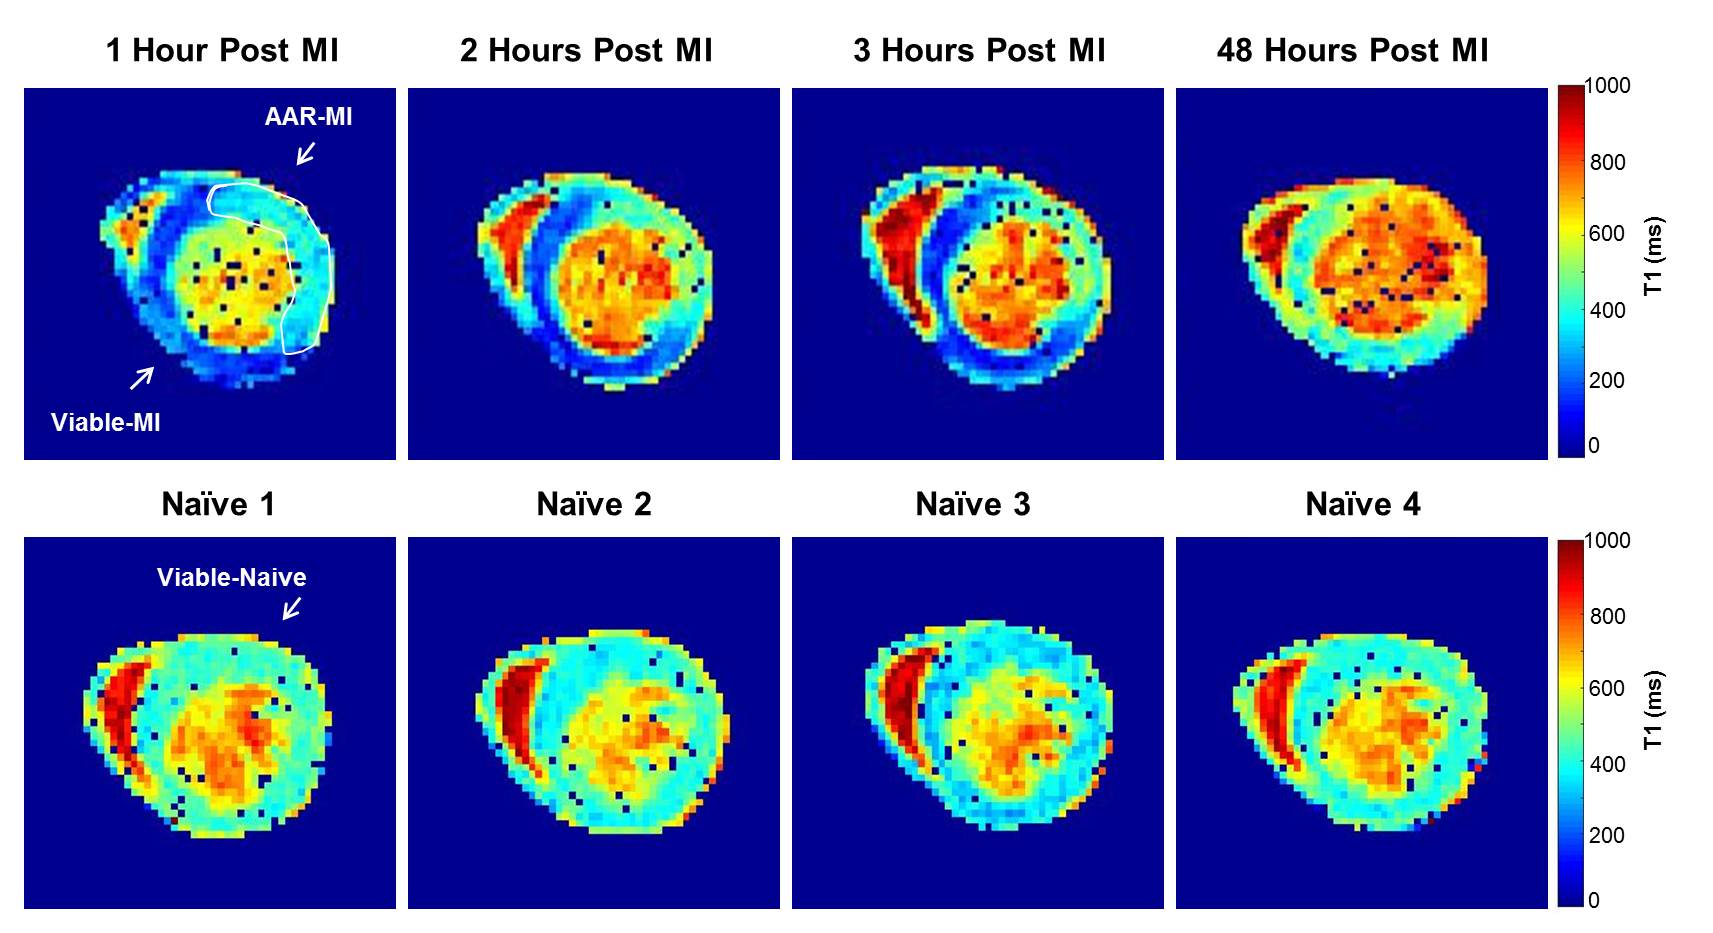
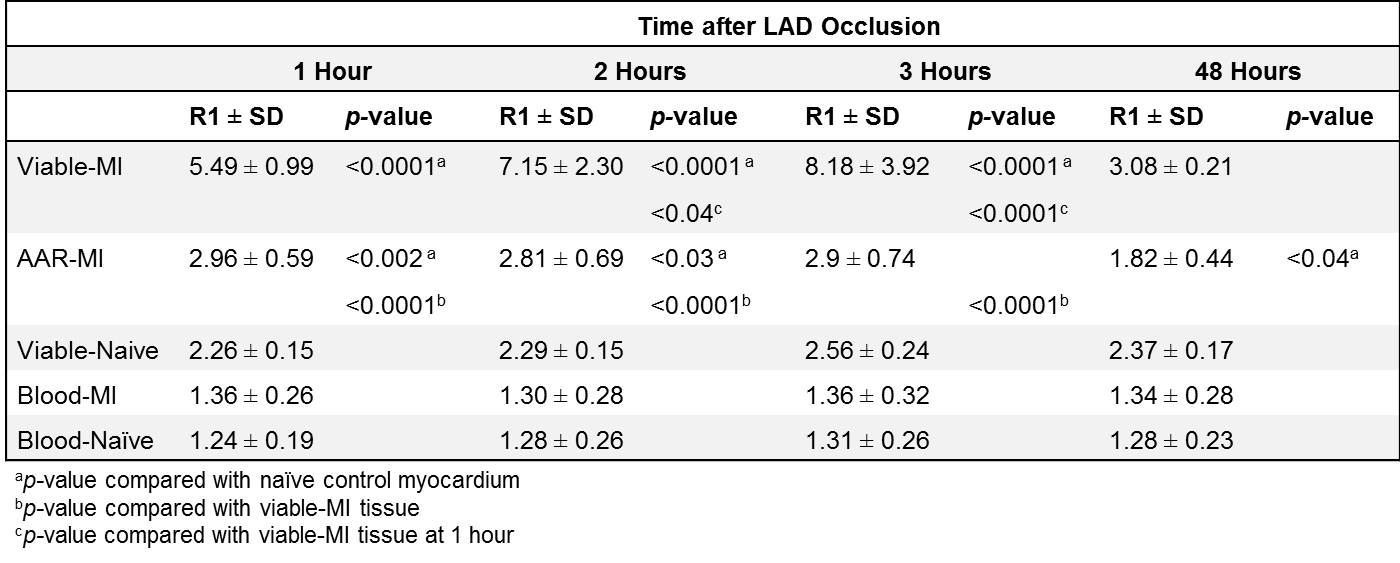
R1 values were evaluated 1, 2 and 3 hours post-MI and compared between the 3 tissue types. R1 values were significantly higher in the Viable-MI tissue compared with AAR-MI tissue at 1, 2 and 3 hours after LAD occlusion (p<0.0001) allowing early delineation of the infarct region (Fig.1 & Fig.2 and Table.1). Interestingly R1 values were slightly, but significantly increased in the AAR-MI tissue at 1 and 2 hours after occlusion compared with values for naïve control animals (p<0.01 and p<0.05 respectively). However, R1 was elevated to an even greater degree in the Viable-MI tissue, and continued to rise at 2 and 3 hours post-MI (p<0.05 and p<0.0001) (Fig.1 & Fig.2 and Table.1). The R1 values of LV blood pool in MI and Naïve groups were similar and did not change over the 3 hours (Fig.1). When the same animals were imaged at 2 days post-MI, R1 values were still significantly higher in the Viable-MI tissue compared with AAR-MI tissue. However at this point viable-MI tissue had a similar R1 to naïve hearts, while R1 in the infarcted AAR-MI was lower than controls (p<0.05) (Fig.1 & Fig.2 and Table.1).Discussion
Acutely after ischemic injury a large increase in Mn2+ uptake in Viable-MI myocytes occurs while a small Mn2+ increase is also present in the AAR-MI. Increased R1 in viable-MI myocytes is likely due to the elevated catecholamine levels acutely post-MI leading to increased cardiac work and thus Ca2+/Mn2+ uptake. The increased R1 at 1 and 2 hours post-MI in the AAR-MI segments following ischemic injury may be a result of calcium overload in the ischemic tissue, which reduces over time as cell integrity is lost. By two days the catecholamine storm has passed and R1 levels in the surviving myocardium have normalised, while Mn2+ uptake in the dead infarct region is reduced due to lack of functional myocytes. It may be possible to exploit the different mechanisms of MEMRI and late Gd-enhancement MRI to yield additional pathophysiological data on cellular function in acute cardiac injury.Conclusion
The present study shows that Cardiac-Manganese Enhanced T1-Mapping allows sensitive in vivo detection of subtle changes and accumulation of Mn2+ in viable myocytes in the early phase after myocardial injury. Preloading of the myocardium with Mn2+ prior to infarction makes this a sensitive approach which could be used to monitor imbalance in Ca2+ homeostasis and quantification of area at risk for myocardial viability assessment and trials of novel therapies.Acknowledgements
The author acknowledge the following financial support: Nur Hayati Jasmin is funded by King's Scholarship Malaysia; DJ Stuckey is funded by British Heart Foundation. Special thanks to Sean Davidson, May Zaw-Thin and John Connell for your valuable contributions.
References
- Jynge P, Brurok H, Asplund A, et al. Cardiovascular safety of MnDPDP and MnCl2. Acta Radiol. 1997;38:740–749.
- Wendland M F. Applications of manganese-enhanced magnetic resonance imaging (MEMRI) to imaging of the heart. NMR in Biomedicine. 2004;17(8):581–594.
- Matsuura Y, Dash R, Kim P J, et al. Dual contrast enhanced cardiac MRI using manganese and gadolinium in patients with severe ischemic cardiomyopathy detects the peri-infarct region (PIR). Journal of Cardiovascular Magnetic Resonance. 2014;16(Suppl 1):O96.
- Waghorn B, Edwards T, Yang Y, et al. Monitoring dynamic alterations in calcium homeostasis by T1-weighted and T1-mapping cardiac manganese-enhanced MRI in a murine myocardial infarction model. NMR in Biomedicine. 2008;21:1102–1111.
- Stuckey D J, McSweeney S J, Thin M Z, et al. T1 Mapping Detects Pharmacological Retardation of Diffuse Cardiac Fibrosis in Mouse Pressure-Overload Hypertrophy. Circulation: Cardiovascular Imaging. 2014;7:240–249.
- Jackson L H, Vlachodimitropoulou E, Shangaris P, Roberts T A, et al. Non-invasive MRI biomarkers for the early assessment of iron overload in a humanized mouse model of β-thalassemia. Scientific Reports. 2017;7(February): 43439.
Figures