4762
A Normalized Segmented T2STIR-bSSFP Technique for High Resolution Edema Imaging1Shenzhen Institutes of Advanced Technology,Chinese Academy of Sciences, Shenzhen, China
Synopsis
High resolution edema image is highly desired for reducing particle volume effect (PVE) on thin myocardium. In this work, we proposed a normalized segmented T2STIR-bSSFP to improve base resolution from 192 to 320 in edema imaging as well as maintain high contrast of edema to myocardium. The results show that the proposed method can reduce PVE on thin myocardium and makes edema imaging for the right ventricle myocardium being possible.
INTRODUCTION
Dark blood T2-weighted TSE was usually used in the diagnosis of myocardial edema1. However, its sensitivity to cardiac motion may result in signal inhomogeneity in the image2. Single-shot T2STIR-prepared bSSFP (T2STIR-bSSFP) can overcome this issue and provide high contrast between edematous and normal myocardium3. But its spatial resolution is limited due to a single heartbeat acquisition window. High resolution edema image is highly desired for reducing particle volume effect (PVE) on thin myocardium and makes edema imaging for right ventricle (RV) being possible4,5. In this study, we present a normalized segmented T2STIR-bSSFP technique to improve the spatial resolution in edema imaging and maintain the high contrast of edema to myocardium.METHODS
Theory:
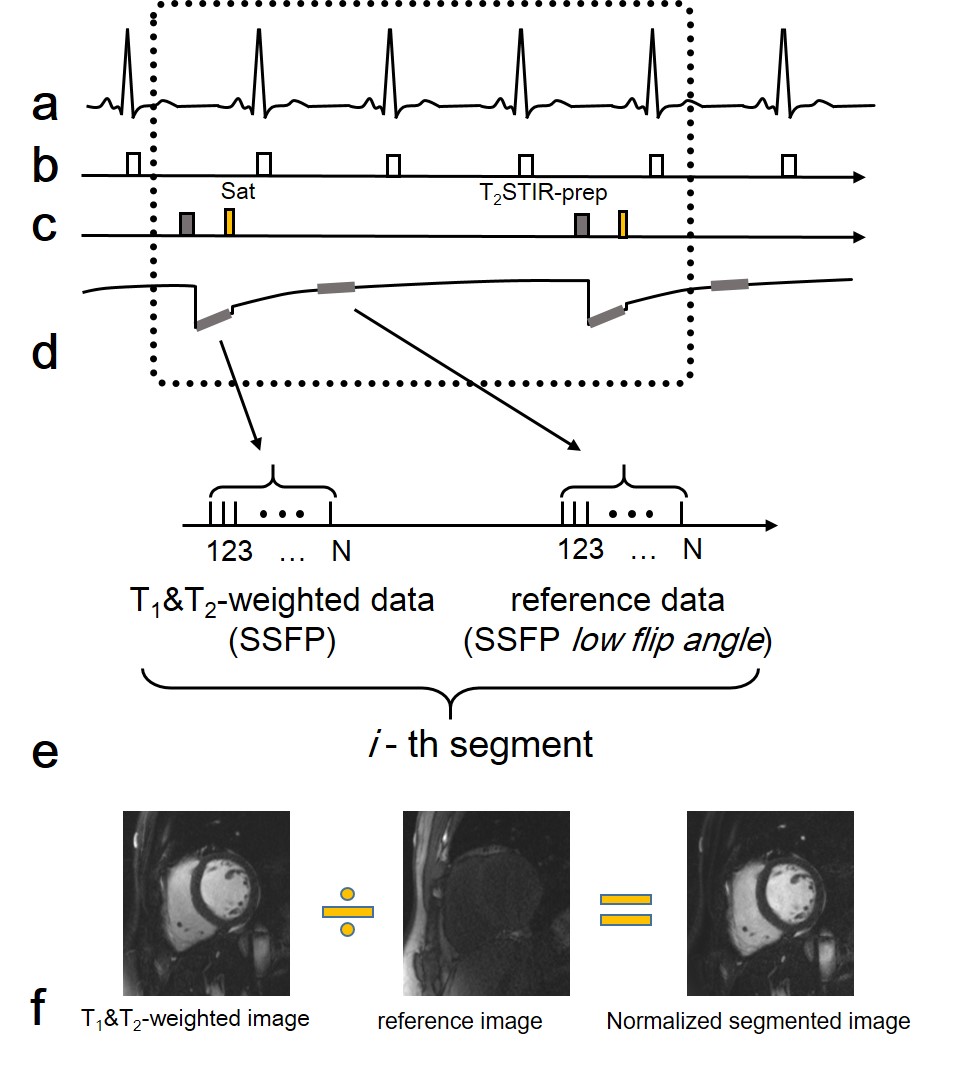
The single-shot T2STIR-bSSFP was extended to segmented acquisition for achieving high resolution imaging. Since T1 and T2 values of edema are both elevated in T2STIR-bSSFP, directly extending to the segmented version will reduce the contrast between edema and normal myocardium, due to insufficient recovery of longitudinal magnetization. Here, three strategies were proposed to maintain the contrast (see Figure 1), (1) 2 RR intervals were used for magnetization recovery between segments; (2) a saturation pulse was applied immediately after T2STIR-bSSFP readout. This strategy accelerates the T1 relaxation, since the longitudinal magnetization was still negative when readout was completed; (3) a low flip angle bSSFP readout was inserted in the next RR intervals to acquire a reference image. After these strategies, readout for each segment was adjusted to the same cardiac phase. Normalized image was obtained by dividing the T1&T2-weighted image by the reference image. The number of segments was limited to 4 for minimizing breath-holding time and the first segment was discarded. Finally, a total of 11 RR intervals were acquired.
Experiment:
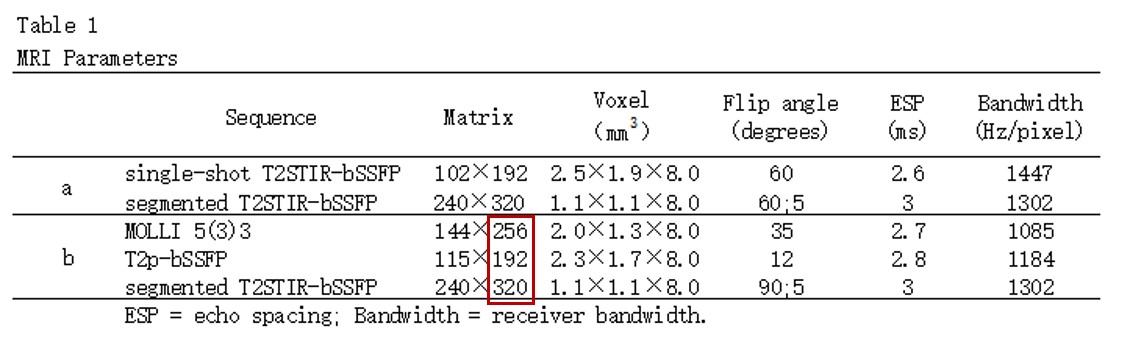
Simulations: Bloch equation simulations were used to calculate the contrast in single-shot and segmented T2STIR-bSSFP sequence with T1/T2 for normal myocardium (T1/T2=1149/44ms) and edema (T1/T2=1503/69ms) using MATLAB (MathWorks, USA). TEprep of the T2STIR module varied from 40ms to 70ms. RR interval=800ms. Other parameters are listed in Table 1(a).
Phantom experiments: Phantoms of myocardium and edema were prepared using two difference mixtures of agarose and NiSO4·6H2O to approximate the above T1 and T2 values. Phantoms were imaged with TEprep from 40ms to 70ms with step 5ms. Imaging parameters are identical to the simulations.
In-vivo experiments: These sequences were performed on a 3T clinical MR system (TIM TRIO, Siemens, Germany). A 32-elements cardiac phased-array coil was used. TEprep=60ms. Parallel imaging was used for 2× acceleration. Besides, T1 map6 and T2 map7 were performed to show the elevated T1 and T2 values in edematous myocardium. The experimental parameters are depicted in Table 1(b).
RESULTS
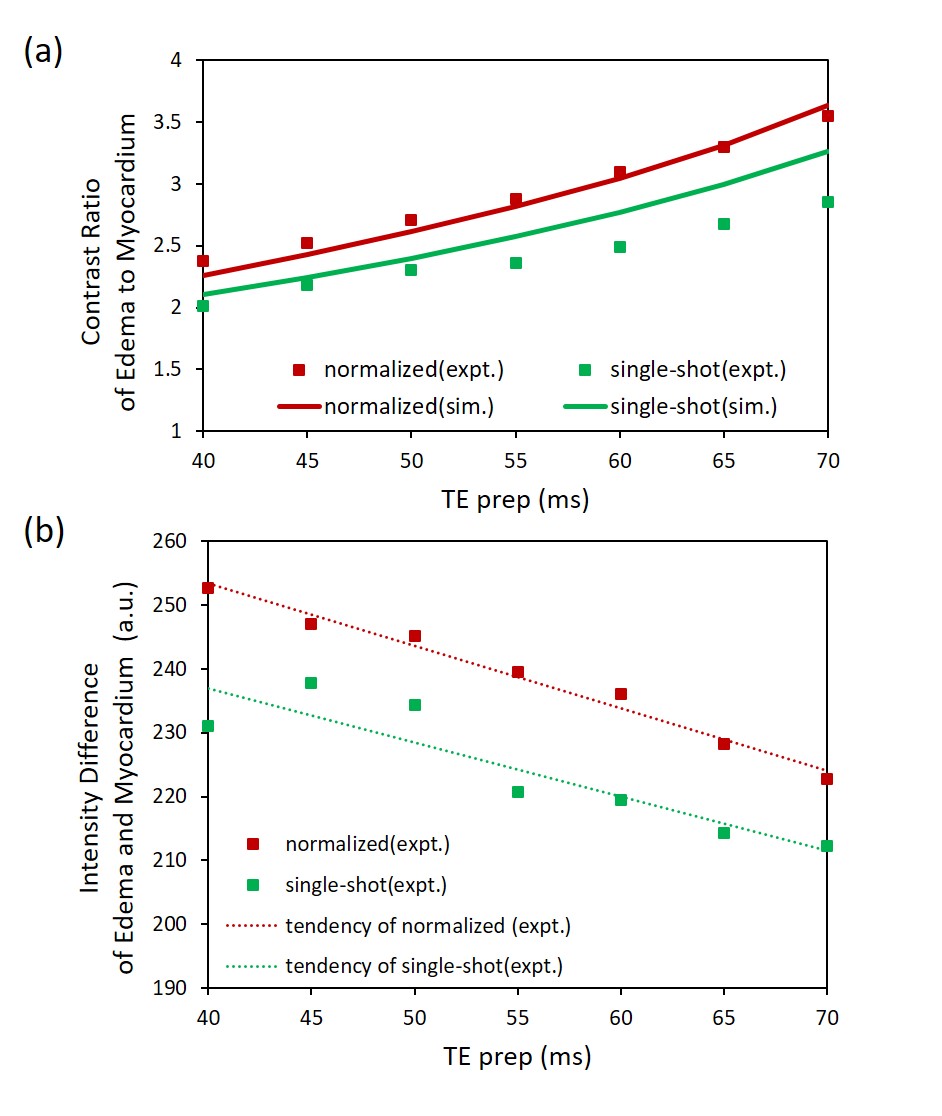
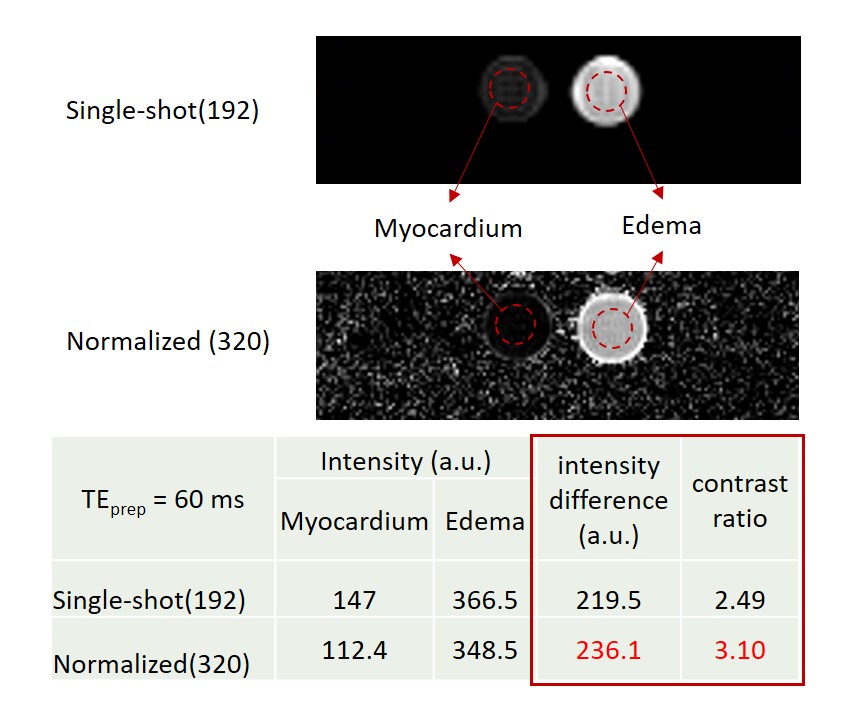
Figure 2 depicts the contrast ratio and intensity difference during all TE preparation times in simulation and phantom experiments. Contrasts in the normalized segmented method are better than that in the single-shot acquisition method. Figure 3 summarizes results from the phantom experiments when TEprep=60ms.
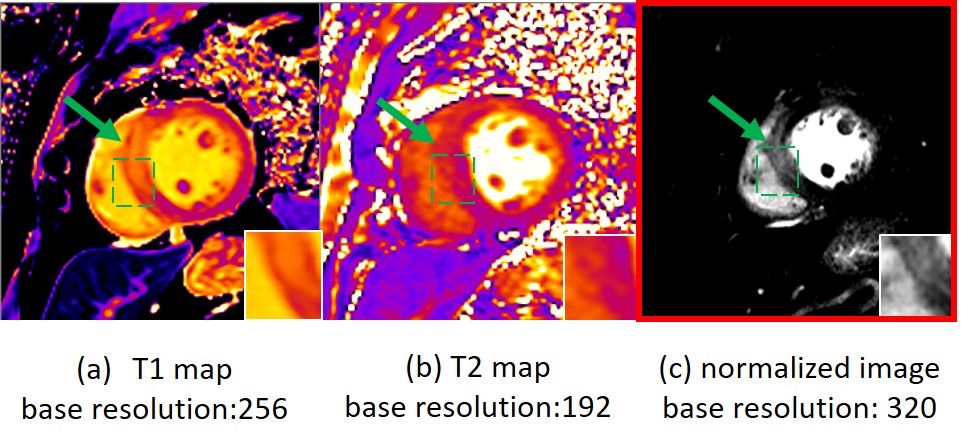
In patient studies, we chose TEprep=60ms to contain more T2-weighted information for better characterizing pathological changes of myocardium. Figure 4 shows a patient case. Green arrow in normalized image indicates edema at anteroseptal and inferoseptal segments in agreement with T1 and T2 maps. Though subtle difference between edema and myocardium is demonstrated in T2 map, intensity of edema is higher in normalized segmented image, compared to the remote myocardium.
DISCUSSION
The normalized method indeed improves image contrast compared to the single-shot method, as shown in Figure 2 and 3. In this study, contrast ratio instead of CNR was used to estimate the tissue contrast, since the scale of intensity has changed in normalized signals. Contrast ratio eliminates the influence of signal scale and the dependence on noise, therefore it can be used to estimate contrast and compare the two methods in the same TE preparation time.
Though no edema image using the single-shot method was shown here, as observed from the virtual boxes in T1 map and T2 map (see Figure 4), we expect blurring occurred near the edge of the heart in single-shot T2STIR-bSSFP due to insufficient spatial resolution. Since base resolution has been improved to 320, edema imaging for the RV is possible with voxel size on the order of 1 mm.5
CONCLUSION
A normalized segmented technique is proposed to improve base resolution as well as maintain the high contrast of edema to myocardium. The experiments show that it helps to decrease PVE on thin myocardium at higher resolution. In the future, we will focus on acquiring high spatial resolution edema image while free-breathing for those having difficulty in performing the necessary breath-holds.Acknowledgements
No acknowledgement found.References
1. Francone M, Carbone I, Agati L, et al. Utility of T2-weighted short-tau inversion recovery (STIR) sequences in cardiac MRI: an overview of clinical applications in ischaemic and non-ischaemic heart disease. Radiologia Medica. 2011. 116(1): 32-46.
2. Payne AR, Casey M, McClure J, et al. Bright blood T2 weighted MRI has higher diagnostic accuracy than dark blood stir MRI for detection of acute myocardial infarction and for assessment of the ischemic area-at-risk and myocardial salvage. Circulation Cardiovascular Imaging. 2011. 4(3):210-219.
3. Yanjie Zhu, Dan Yang, Yucheng Chen, et al. Myocardial Edema Imaging using Single-shot T2STIR Prepared bSSFP. Proc. 25th Annual Meeting of ISMRM, Hawaii, USA, 2017.
4. Chenxi Hu, Albert J. Sinusas, Steffen Huber, T1-refBlochi: high resolution 3D post-contrast T1 myocardial mapping based on a single 3D late gadolinium enhancement volume, Bloch equations, and a reference T1. Journal of Cardiovascular Magnetic Resonance. 2017. 19: 63.
5. Kellman P, Arai A E. Cardiac imaging techniques for physicians: late enhancement. Journal of Magnetic Resonance Imaging. 2012. 36(3): 529-542.
6. Kellman P, Wilson JR, Xue H, et al. Extracellular volume fraction mapping in the myocardium, part 1: evaluation of an automated method. Journal of Cardiovascular Magnetic Resonance. 2012. 14:63.
7. Giri S, Chung Y, Merchant A, et al. T2 quantification for improved detection of myocardial edema. Journal of Cardiovascular Magnetic Resonance. 2009. 11(1): 56-56.
Figures