4756
Volumetric black-blood fast spin echo with variable refocusing pulses for the visualization of whole-heart and great vessels1School of Biomedical Engineering and Imaging Sciences, King's College London, London, United Kingdom, 2Department of Pediatrics and Radiology, UT Southwestern Medical Center, Dallas, TX, United States
Synopsis
We describe the use of black-blood 3D fast spin echo with variable refocusing flip angles for whole-heart imaging. The technique allows efficient, volumetric high-resolution imaging of the heart and great vessels, and improves aortic vessel wall delineation compared to conventional 2D double-inversion recovery. It also provides complementary diagnostic information to 3D bright-blood bSSFP, particularly for the visualization of pulmonary veins. This was demonstrated in a study of 8 patients with congenital heart disease.
Introduction
Cardiovascular MR allows for visualization of myocardium and vessel wall with positive contrast, by suppressing signal from the blood pool, so called black-blood imaging.1,2 Conventional black-blood CMR is limited to 2D image acquisition due to the need for thin slice acquisition necessary for sufficient through-plane blood flow. Due to technical challenges related to motion sensitivity, whole-heart black-blood imaging has so far mainly employed less efficient but more motion tolerant and flow independent gradient echo acquisitions.3,4 A few studies have described cardiac and respiratory motion compensated black-blood three-dimensional fast spin echo (3D-FSE).5,6 Nevertheless, no evaluation has been performed of 3D-FSE for whole-heart black-blood imaging.
The purpose of this study was to assess the feasibility of black-blood 3D-FSE for the visualization of the whole heart and great vessels and compare it to the clinically available 2D-DIR sequence. We also report initial patient experience in patients with congenital heart disease.
Methods
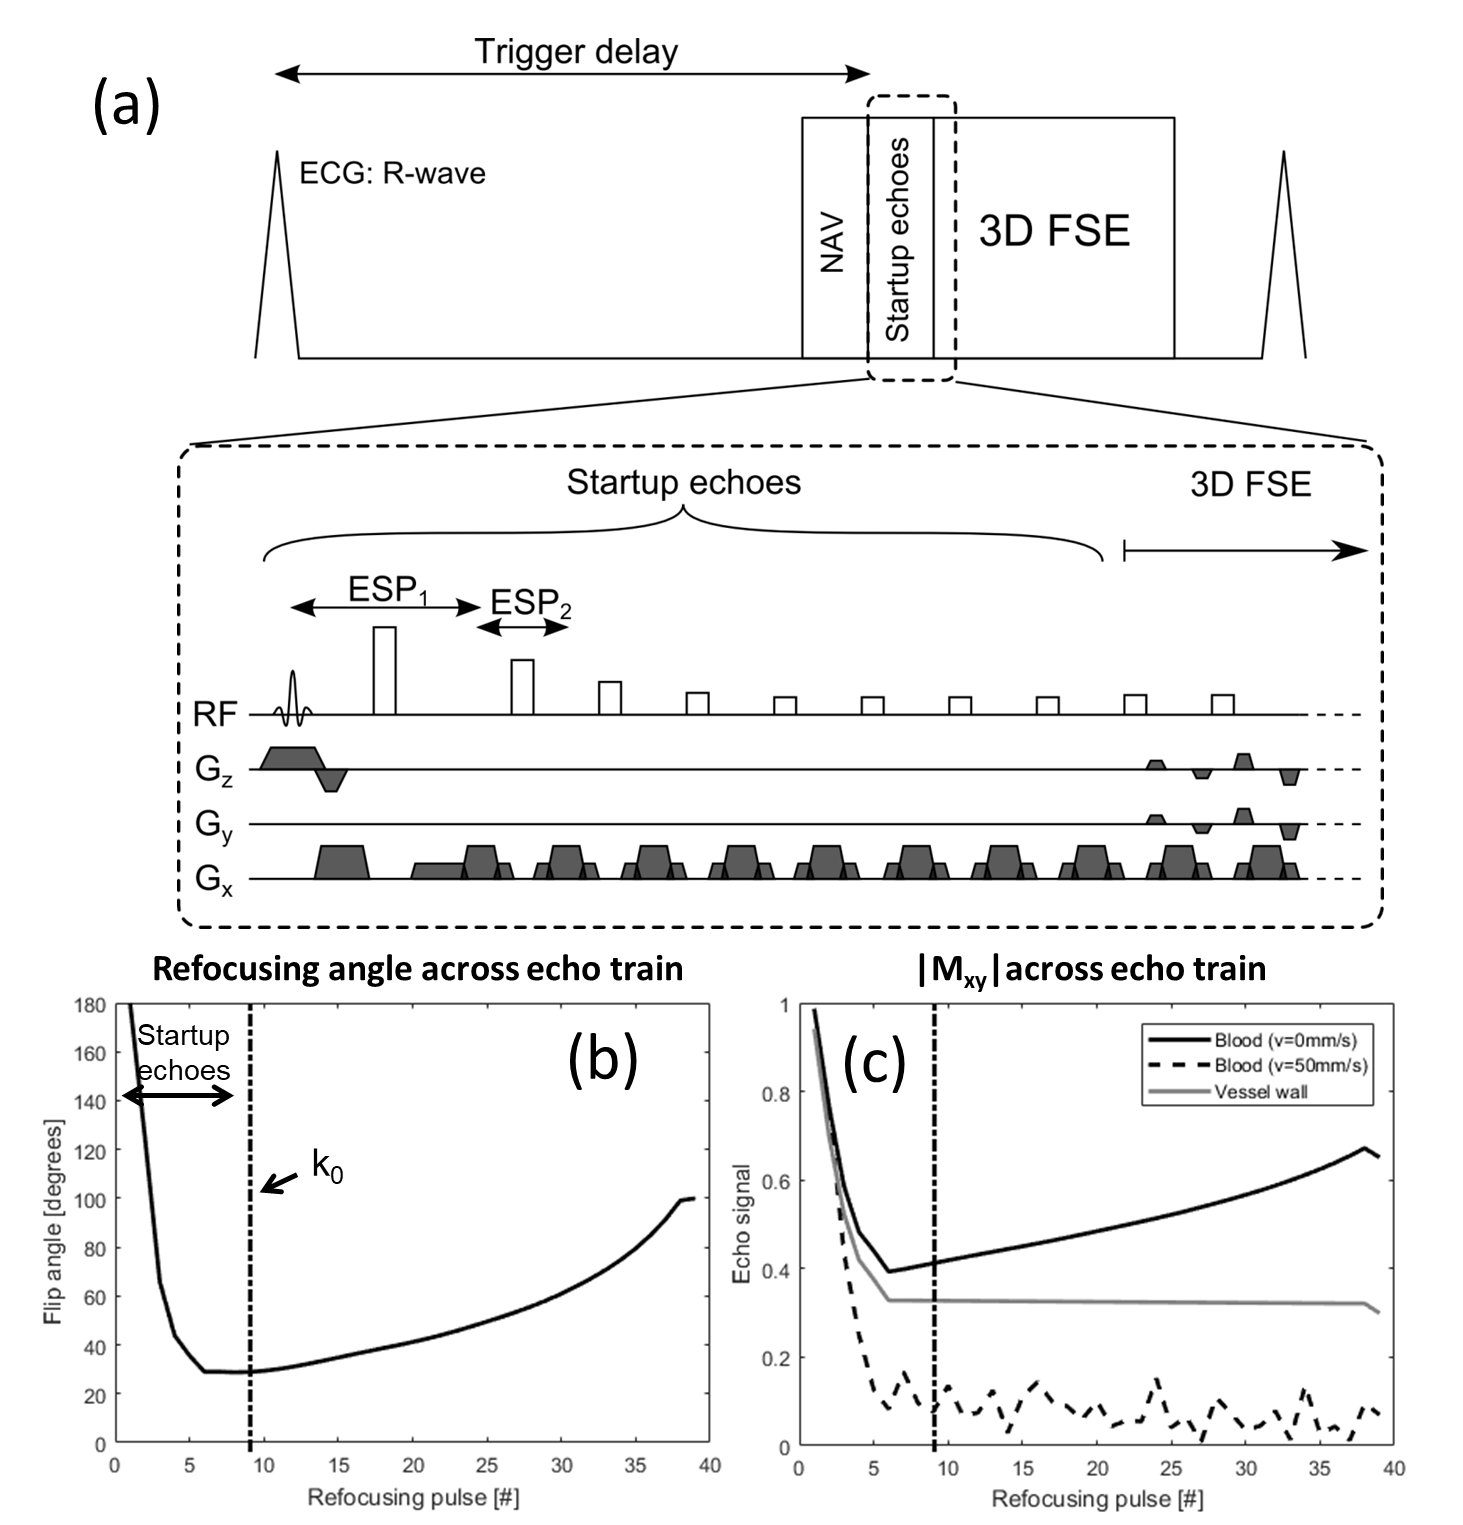
MRI experiments were performed on a clinical 3T (healthy subjects) and 1.5T (CHD patients) Philips scanner (Philips Healthcare, Best, The Netherlands). The 3D-FSE sequence used a selective 90° excitation pulse and non-selective refocusing pulses7 (Figure 1). Refocusing flip angles were modulated to yield constant transverse magnetization across the echo train (T1=880ms and T2=40ms).8 Centric view-ordering scheme was used to ensure highest temporal correlation between respiratory navigator motion measurements and acquisition k-space center. Eight startup echoes were used to avoid the rapidly changing transverse magnetization at the start of the echo train, and allow signal from flowing blood to de-phase (Figure 1c).
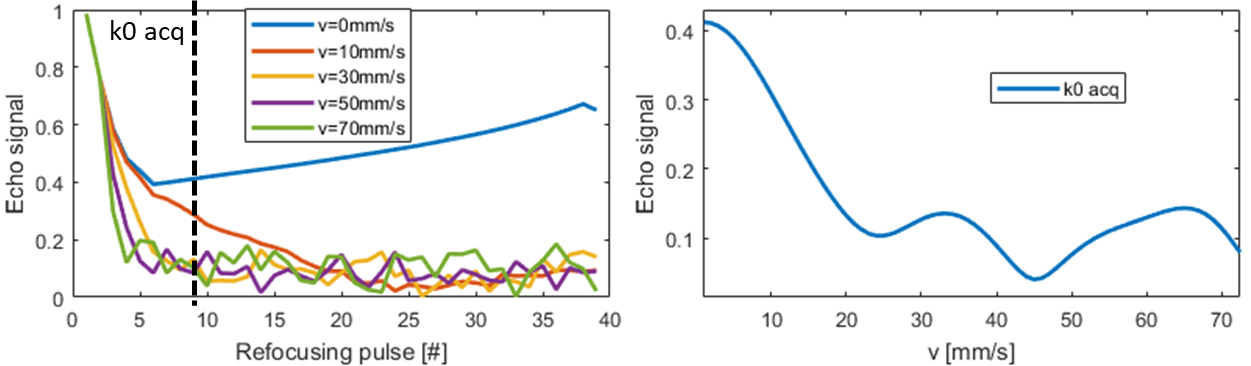
In a simulation study, velocities from 0mm/s to 100mm/s were simulated to determine the flow sensitivity of 1.0mm resolution 3D-FSE. Relaxation times of blood at 3T were used (T1=1600 ms; T2=250 ms).
Ten healthy subjects (mean age ± standard deviation = 30±4 years, 2 male) were scanned with 3D-FSE with 1mm isotropic resolution. 2D-DIR was acquired for comparison of aortic dimensions. The scans were synchronized with an electrocardiogram and triggered to the diastolic rest period. For the 3D-FSE scans a pencil beam navigator with a 5 mm gating window and tracking factor of 0.6 was used. The 2D-DIR was acquired during a breath-hold. The images were compared in terms of aortic vessel wall thickness and sharpness.
Eight patients with CHD were recruited. The findings of the 3D-FSE were compared to conventional balanced Steady-State Free Precession (3D-bSSFP). The relative success rates of achieving a full sequential segmental diagnosis (i.e. identifying all thoracic cardiovascular morphological elements) was compared between sequences. A structure was recorded as visualized if its connections were identified and there was no more than mild image blurring affecting that structure.
Results
The simulations results are shown in Figure 2. For this particular 3D-FSE sequence, blood is well suppressed for velocities higher than 15-20mm/s.
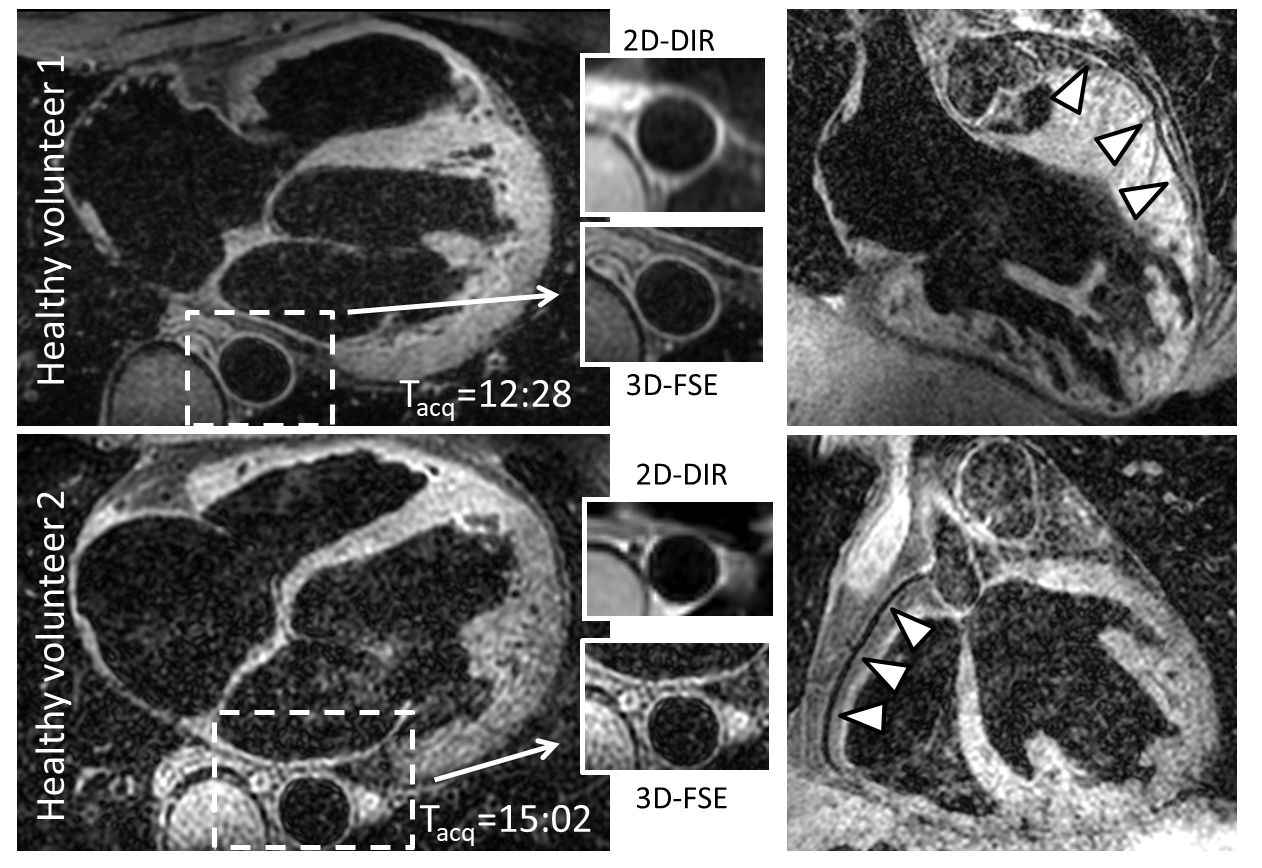
Images from 2 healthy subjects are shown in Figure 3.The measured aortic lumen area (3D-FSE: 1.99cm2±0.29cm2 vs 2D DIR: 1.97cm2±0.32cm2; P=N.S.) and inner vessel wall sharpness (3D-FSE: 69.4%±10.9% vs 2D-DIR: 68.4%±10.3%; P=N.S.) were similar for 2D-DIR and 3D-FSE. However, the mean outer vessel wall sharpness (3D-FSE: 53.9%±12.3% vs 2D-DIR: 41.8%±15.7%; P<0.01) and mean vessel wall thickness (3D-FSE: 1.62mm±0.29mm vs 2D-DIR: 2.30mm±0.51mm; P<0.01) was significantly different. The average scan time±standard deviation for the 3D-FSE was 13:21±3:10 (min:sec).
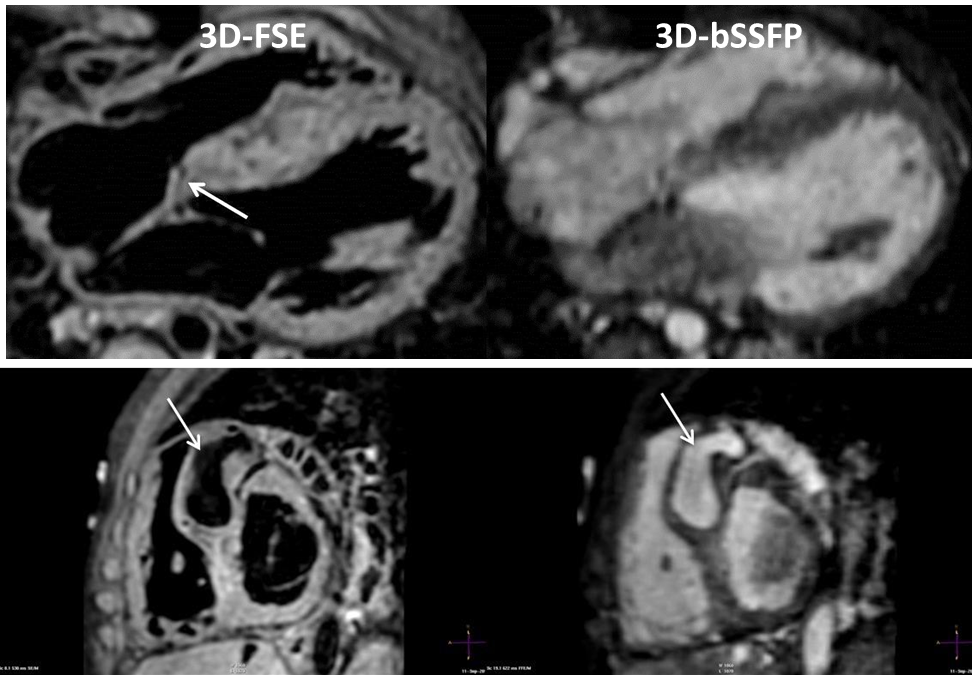
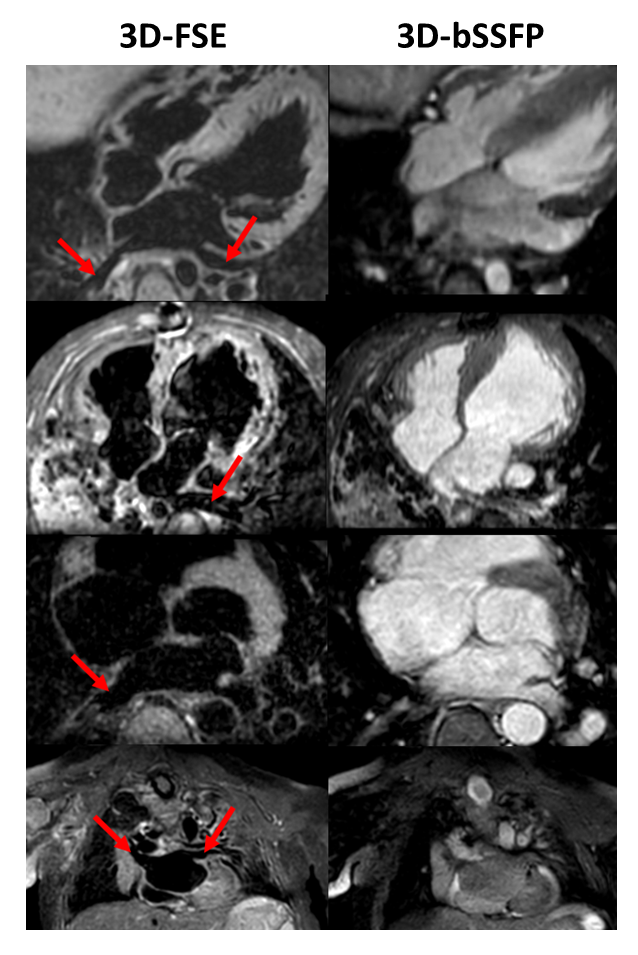
In patients with CHD, 3D-bSSFP failed to achieve diagnostic accuracy in all but 1 case (12.5% success rate). Failure was due to inadequate visualization of one or more pulmonary veins or poor image quality of common carotid and subclavian arteries. In contrast, 3D-FSE achieved full segmental diagnoses in 3 cases (37.5% success rate). All failed cases were due to inadequate quality of coronary origins while pulmonary vein visualization was successful in all cases. The combination of 3D-bSSFP and 3D-FSE was able to provide the full segmental morphological diagnosis for all cases. A case where a coronary fistula was visualized with 3D-FSE but not 3D-bSSFP is shown in Figure 4. Example images from 4 CHD patients with improved visualization of pulmonary veins are shown in Figure 5.
Discussion
Here, feasibility of 3D-FSE for whole-heart imaging has been established. 3D-FSE performs favorably in terms of vessel wall sharpness relative to 2D DIR and offers very clear advantages in pulmonary vein imaging compared to 3D-bSSFP, whereas 3D-bSSFP give superior coronary imaging. However, 3D-FSE has limitations in ability to suppress blood and is intrinsically motion sensitive. The combination of 3D-bSSFP and 3D-FSE is very successful in achieving a full sequential segmental diagnosis in CHD.Acknowledgements
No acknowledgement found.References
1. Edelman RR, Chien D, Kim D. Fast selective black blood MR imaging. Radiology 1991;181(3):655-660.
2. Simonetti OP, Finn JP, White RD, Laub G, Henry DA. "Black blood" T2-weighted inversion-recovery MR imaging of the heart. Radiology 1996;199(1):49-57.
3. Andia ME, Henningsson M, Hussain T, Phinikaridou A, Protti A, Greil G, Botnar RM. Flow-independent 3D whole-heart vessel wall imaging using an interleaved T2-preparation acquisition. Magn Reson Med 2013 Jan;69(1):150-7.
4. Varela M, Morgan R, Theron A, et al. Novel MRI Technique Enables Non-Invasive Measurement of Atrial Wall Thickness. IEEE transactions on medical imaging 2017;36(8):1607-1614.
5. Mihai G, Varghese J, Lu B, Zhu H, Simonetti OP, Rajagopalan S. Reproducibility of thoracic and abdominal aortic wall measurements with three-dimensional, variable flip angle (SPACE) MRI. JMRI 2015;41(1):202-212.
6. Srinivasan S, Hu P, Kissinger KV, et al. Free-breathing 3D whole-heart black-blood imaging with motion sensitized driven equilibrium. JMRI 2012;36(2):379-386.
7. Mugler JP, 3rd. Optimized three-dimensional fast-spin-echo MRI. Journal of magnetic resonance imaging : JMRI 2014;39(4):745-767.
8. Coolen BF, Poot DH, Liem MI, et al. Three-dimensional quantitative T1 and T2 mapping of the carotid artery: Sequence design and in vivo feasibility. Magn Reson Med 2016;75(3):1008-1017.
Figures