4747
Gd-EOB-DTPA-Enhanced MRI for Assessment of Liver Function: Comparison between Signal Intensity and T1 Relaxation Time-Based Indices1Department of Radiology, the Third People’s Hospital of Nantong, Nantong, China, 2Philips Healthcare Shanghai, Shanghai, China
Synopsis
The purpose of this study was to compare the ability of Gd-EOB-DTPA-enhanced signal intensity (SI) and T1 relaxation time-based indices for evaluation of liver function. We used Gd-EOB-DTPA-enhanced MRI and Look-Locker sequences to acquire conventional MRI and T1mapping images. The SI values of the liver, paravertebral muscle, T1 relaxation times of the liver before Gd-EOB-DTPA administration and in HBP were measured, the relative enhancement of the liver, increase rates of liver-to-muscle ratio, reduction rates of T1 relaxation time and ΔR1 were calculated, our study showed that the indices derived from T1 relaxation time were superior to SI-based indices.
INTRODUCTION
The evaluation of liver function is important in selecting therapeutic approaches in patients with chronic liver disease especially liver tumors. Gd-EOB-DTPA is a hepatocyte-specific contrast agent for MRI of the liver, uptake and metabolism of Gd-EOB-DTPA is related to hepatocyte function. The aim of this study was to compare the diagnostic performance of Gd-EOB-DTPA-enhanced SI and T1 relaxation time-based indices for evaluation of liver function.METHODS
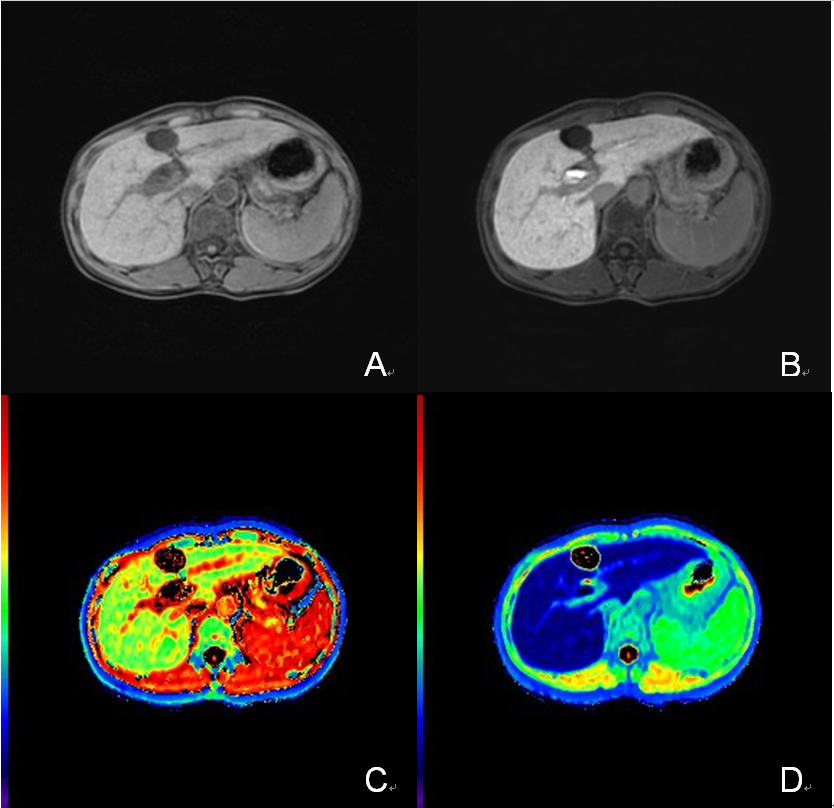
101 patients with chronic viral hepatitis B and cirrhosis were separated into three groups in this prospective study: liver cirrhosis with Child-Pugh A (LCA, n=48), Child-Pugh B (LCB, n=40), Child-Pugh C (LCC, n=13). 21 healthy volunteers with normal liver function (NLF) were enrolled as control group. All subjects were underwent Gd-EOB-DTPA-enhanced MR imaging [native phase, arterial phase, portal venous phase, delayed phase and hepatobiliary phase (HBP)]. Look-Locker sequences with the same geometry position (the level of porta hepatis) were performed before Gd-EOB-DTPA administration and in HBP to acquire T1mapping. The SI values of the liver (SIpre/SIHBP), SI values of the paravertebral muscle (musclepre/muscleHBP) and T1 relaxation time of the liver (T1pre/T1HBP) before Gd-EOB-DTPA administration and in HBP were measured. The relative enhancement of the liver (RE), increase rates of liver-to-muscle ratio (rLMR), reduction rates of T1 relaxation time of the liver (rrT1) and ΔR1 were calculated. One-way ANOVA was performed to compare SI and T1 relaxation time-based indices among different liver function groups. ROC curve analysis was used to evaluate the diagnostic performance of SI and T1 relaxation time-based indices in discriminating NLF-CH-LCA from LCB-LCC.
The SI and T1 relaxation time-based indices were calculated according to the following formula:
RE=(SIHBP- SIpre)/ SIpre
rLMR=[( SIHBP/ muscleHBP)-( SIpre/ musclepre)]/ ( SIpre/ musclepre)
rrT1=[(T1pre-T1HBP)/ T1pre]*100%
ΔR1=(1/ T1HBP)-(1/ T1pre)
RESULTS
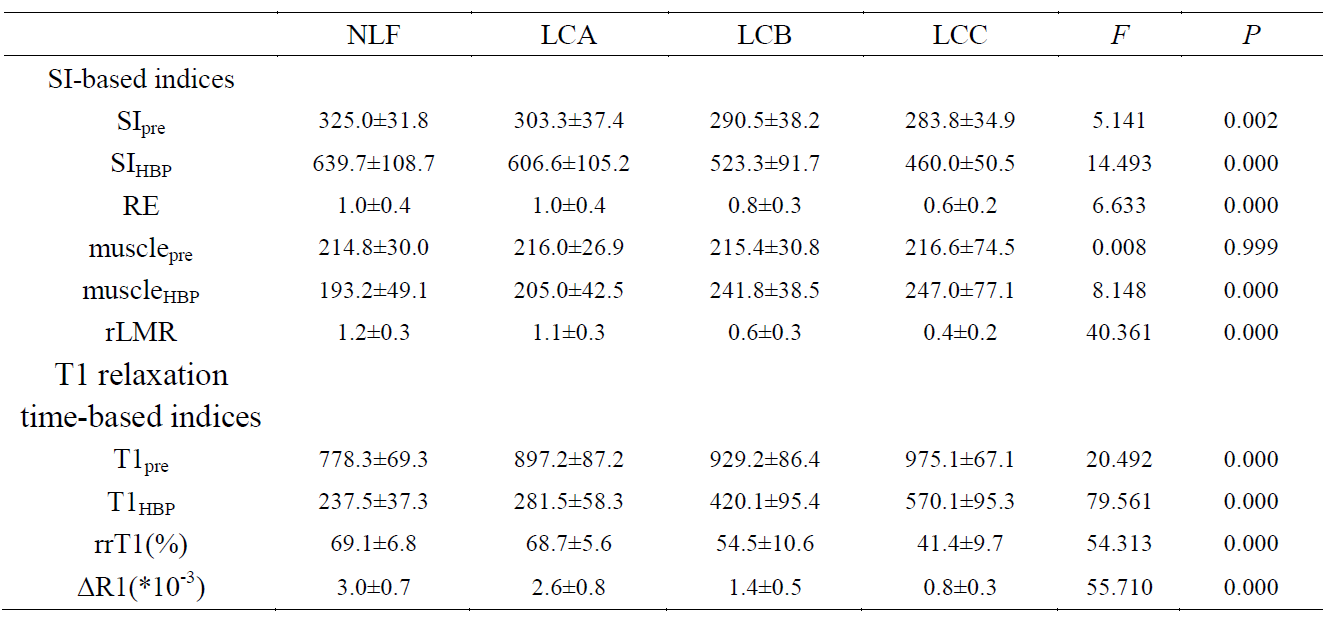
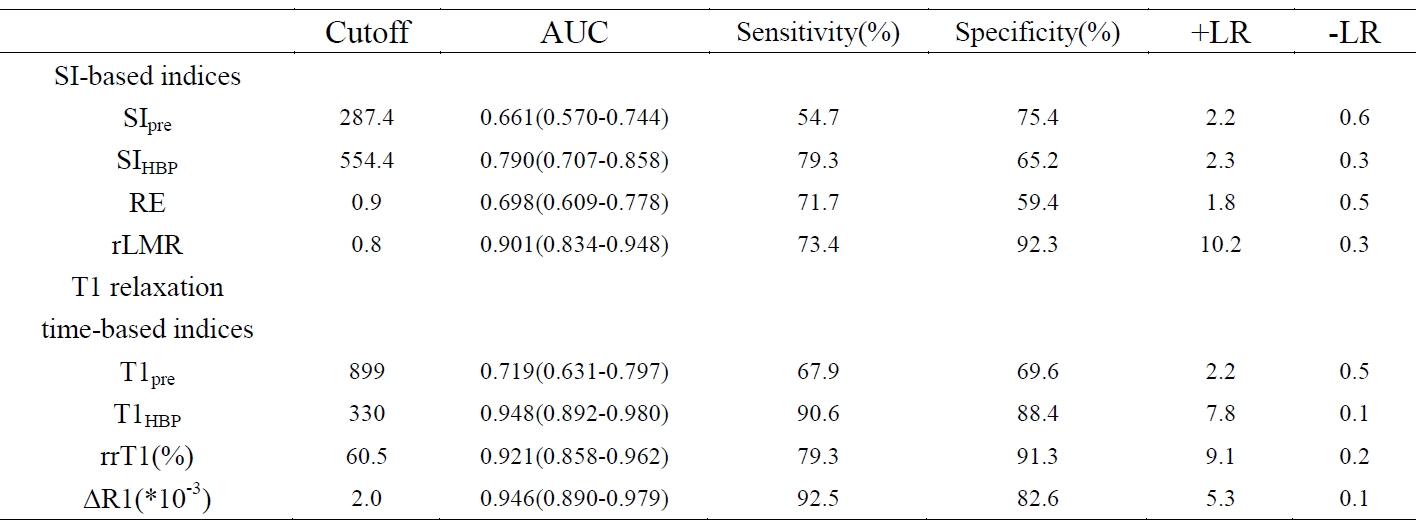
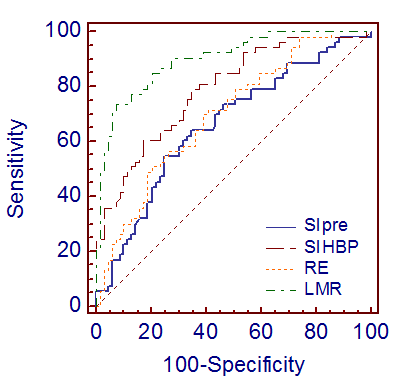
SI and T1 relaxation time-based indices of different groups were shown in table 1. Diagnostic performance for discriminating NLF-CH-LCA from LCB-LCC were shown in table 2.
SIpre showed significantly different (P<0.05) between NLF and LCB or NLF and LCC. RE showed significantly different (P<0.05) between LCC and NLF or LCA, between LCA and LCB. SIHBP and rLMR were significantly (P<0.05) higher in NLF and LCA compared to LCB or LCC. T1pre was significantly (P<0.05) higher in NLF compared to other groups, significantly different (P<0.05) was also found between LCA and LCC. T1HBP, rrT1 and ΔR1 showed significantly different (P<0.05) between any two groups except between NLF and LCA.
DISCUSSION
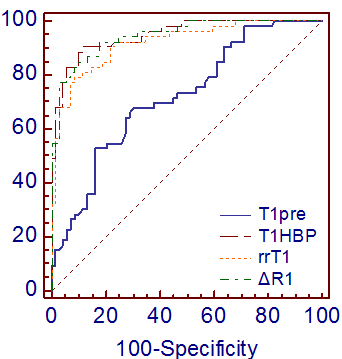
Liver function can be evaluated by using SI and T1 relaxation time of the liver before and after Gd-EOB-DTPA enhancement[1-5]. Our study showed that the SI values of the liver in HBP were higher than before Gd-EOB-DTPA administration in all liver function groups, T1 relaxation times in HBP were lower than before. SIpre, SIHBP, RE, rLMR, rrT1 and ΔR1 showed a constant decrease from NLF, LCA, LCB to LCC, T1pre and T1HBP increased from NLF to LCC. In our study, AUCs of SI-based indices (SIpre, SIHBP, RE and rLMR) for the assessment of poor liver function (LCB-LCC) were 0.661, 0.790, 0.698 and 0.901, respectively, AUC of rLMR was significantly higher than other three indices, AUCs of T1-based indices (T1pre, T1HBP, rrT1 and ΔR1) for the diagnosis of LCB-LCC were 0.719, 0.948, 0.921 and 0.946, respectively, AUCs of T1HBP, rrT1 and ΔR1 were significantly higher than T1pre.CONCLUSIONS
Gd-EOB-DTPA-enhanced SI and T1 relaxation time-based indices are feasible for assessing liver function. The indices post-enhancement are better than pre-enhancement, the indices after rectification are more reliable than before, the indices derived from T1 relaxation time are superior to SI-based indices.Acknowledgements
No acknowledgement found.References
[1] Haimerl M, Verloh N, Zeman F, et al. Gd-EOB-DTPA-enhanced MRI for evaluation of liver function: Comparison between signalintensity-based indices and T1 relaxometry[J]. Sci Rep, 2017, 7: 43347.
[2] Kamimura K, Fukukura Y, Yoneyama T, et al. Quantitative Evaluation of Liver Function With T1 Relaxation Time Index on Gd-EOB-DTPA-Enhanced MRI: Comparison With Signal Intensity-Based Indices[J]. J Magn Reson Imaging, 2014, 40(4): 884-889.
[3] Katsube T , Okada M, Kumano S, et al. Estimation of liver function using T1mapping on Gd-EOB-DTPA-enhanced magnetic resonance imaging[J]. Invest Radiol, 2011, 46(4): 277-283.
[4] Verloh N, Haimerl M, Zeman F, et al. Assessing liver function by liver enhancement during the hepatobiliary phase with Gd-EOB-DTPA-enhanced MRI at 3 Tesla[J]. Eur Radiol, 2014, 24(5): 1013-1019.
[5] Haimerl M, Verloh N, Zeman F, et al. Assessment of clinical signs of liver cirrhosis using T1 mapping on Gd-EOB-DTPA-enhanced 3T MRI[J]. PLoS One, 2013, 8(12): e85658.
Figures