4746
Evaluation of Fat-Only Self Gated Signal for Respiratory Motion Detection and Compensation in the Liver1Radiological Sciences, University of California Los Angeles, Los Angeles, CA, United States
Synopsis
A dual-echo 3D golden angle radial gradient echo sequence can be used for generating a fat-only self-gated signal for respiratory motion detection. We have demonstrated that respiratory motion extraction and compensation in the liver can be achieved using fat-only self-navigated signal with minimal error in the fat-water separation (< 15%). Using this technique has implications of a more robust motion correction for liver DCE-MRI due to its inherent separation between respiratory motion signal and contrast uptake.
Introduction
Respiratory motion is still a major limiting factor in liver quantitative dynamic contrast enhanced MRI (DCE-MRI)1. A self-gated signal (SGS) obtained from the central k-space data (DC) of a 3D golden angle radial acquisition has well been studied for respiratory motion detection and compensation2–4. However, in liver DCE-MRI, the central k-space data are comprised of both the contrast uptakes as well as the respiratory motion. The separation between these two is non-trivial. We have previously proposed a method for accurately detecting the respiratory motion using fat-only SGS (SGSF) that can be potentially useful in the presence of contrast uptake5. In this work we further demonstrate the feasibility of SGSF by i) performing numerical simulations of the fat-water separation with contrast uptake and respiratory motion, ii) comparing SGSF to an external video source of respiratory motion, and iii) using SGSF for respiratory motion compensation in normal liver at 3T.Theory & Methods
The SGSF is determined by first obtaining the DC component along the z-direction from the in-phase (IP) and out-of-phase (OP) echoes on a 3D golden angle radial GRE sequence. The SGS for IP and OP echoes can then be written as
$$$SGS_{OP}(t) = ∑_{x}∑_{y}([W(x,y)C(t) - F(x,y)]R(t)e^{i2πΔf(x,y)TE_{1}}e^{iφ_{1}(x,y)}ΔxΔy)$$$ [1]
$$$SGS_{IP}(t) = ∑_{x}∑_{y}([W(x,y)C(t) + F(x,y)]R(t)e^{i2πΔf(x,y)TE_{2}}e^{iφ_{1}(x,y)}ΔxΔy)$$$ [2]
where W and F are the water and fat signal contained in the voxel, t is time, C(t) is the contrast uptake curve (assuming that it only occurs in non-fatty tissue), R(t) is the respiratory motion, Δf is the frequency shift due to B0 field inhomogeneity, and Φ1 is the static phase that may arise from other system errors. Assuming Δf is small (~0Hz) and negligible, the true SGSF (SGSF,true) can be computed by using the two-point Dixon method6:
$$$SGS_{F}(t) = ∑_{x}∑_{y}([F(x,y)]R(t)e^{iφ_{1}(x,y)ΔxΔy})$$$ [3]
However, due to B0 inhomogenities, Δf is non-negligible making fat and water signals not easily separated.
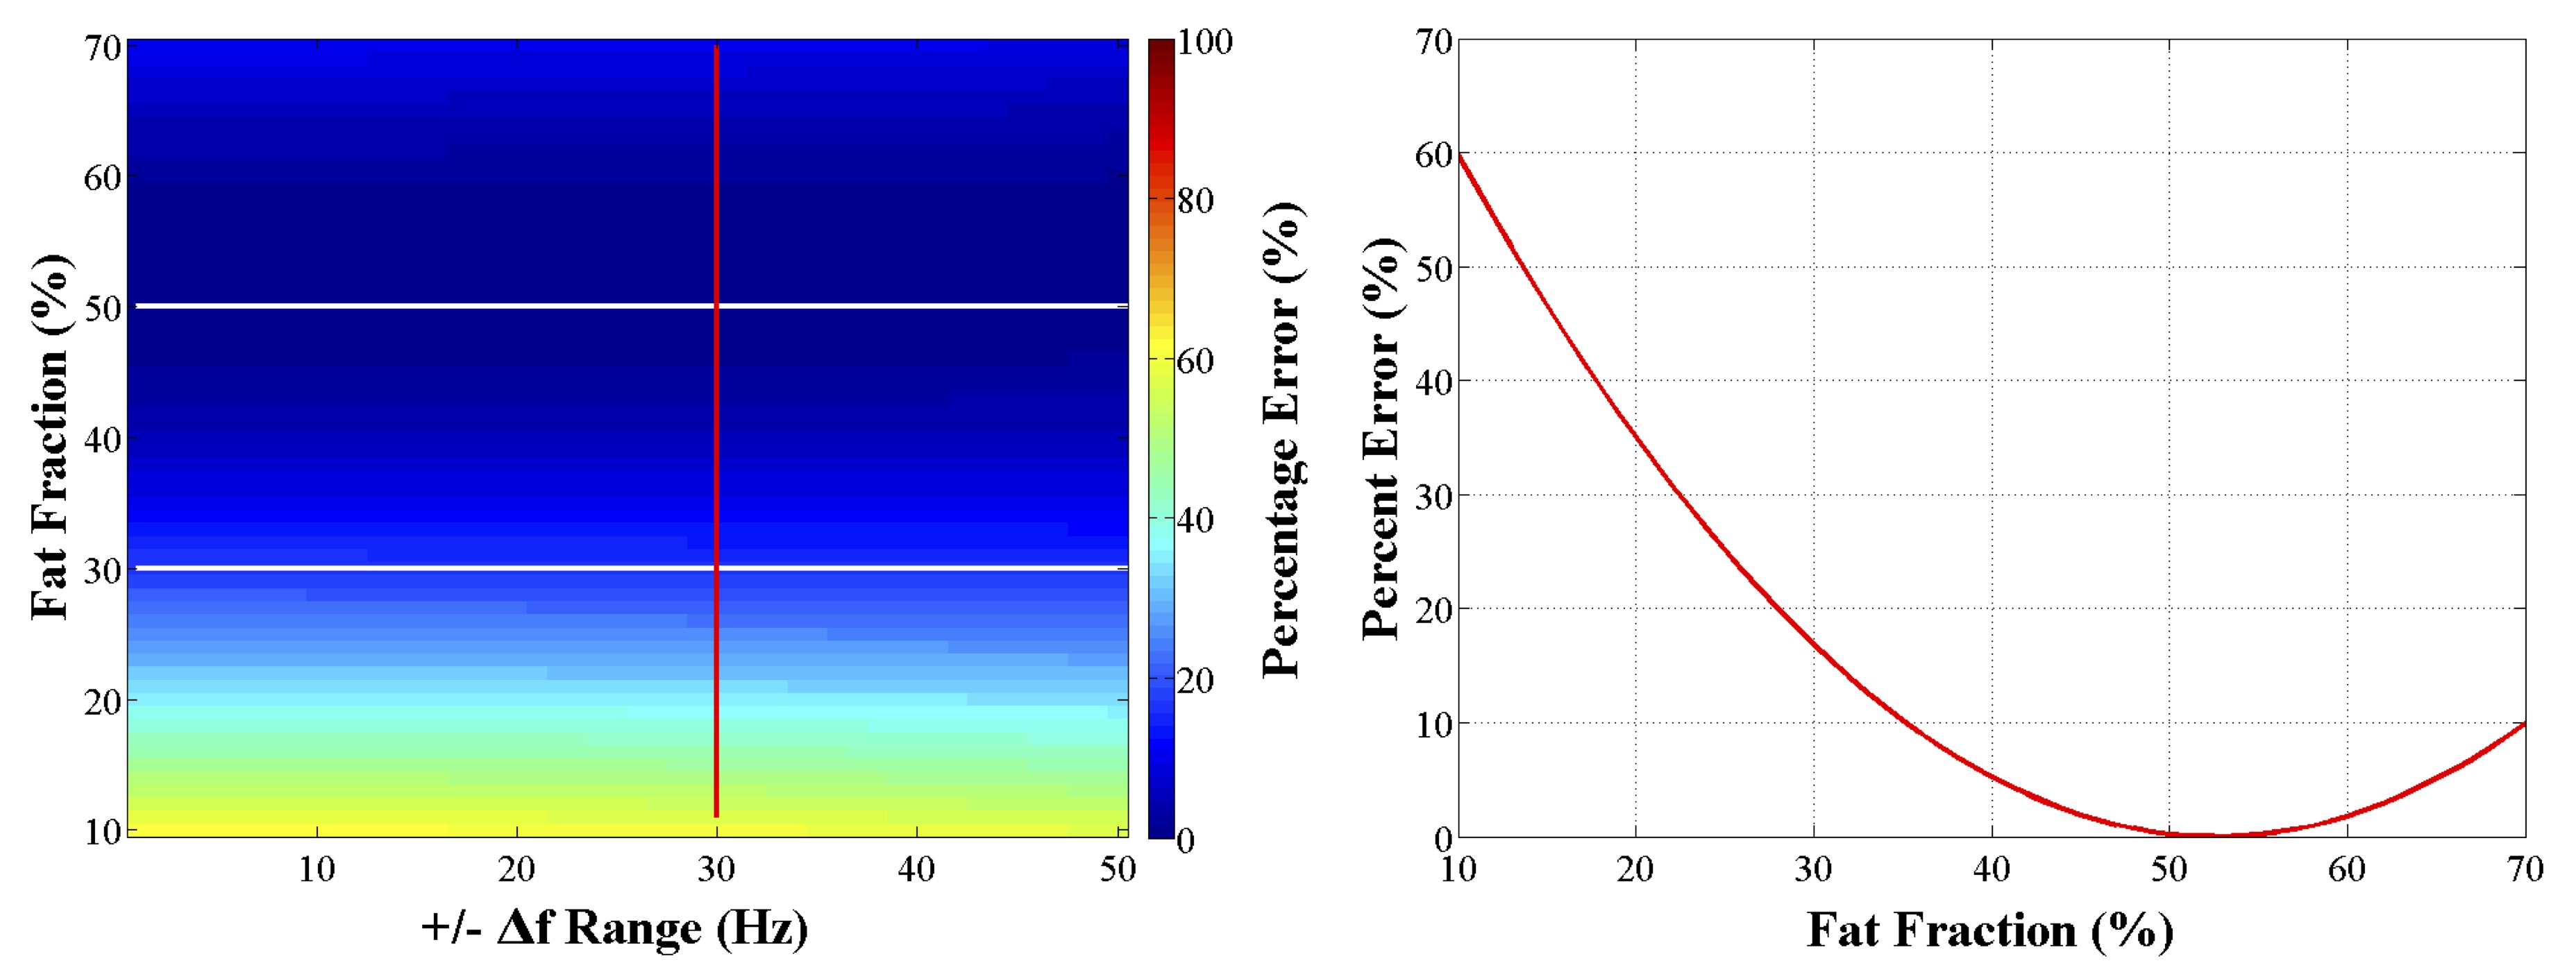
Numerical simulations were performed to evaluate the accuracy of the extracted SGSF using the two-point Dixon fat-water separation. We used equations [1], [2], and [3] to generate SGSF,true and measured SGSF. We used fat fraction ($$$FF = \frac{F}{(F+W)}100\%$$$) values between 10-70%, linear varying frequency shift (Δf = ±0-50Hz)7, and $$$R(t) = sin(0.25t)$$$. C(t) was generated using sample prostate DCE-MRI images. The mean squared error (MSE) between SGSF,true and SGSF (MSEF,F,true) and the MSE between SGSF,true and the true water SGSW,true (MSEW,F,true) were determined. MSEW,F,true represents the maximum possible error that MSEF,F,true can have and a relative percentage error (PE) was calculated as follows:
$$$PE(FF,Δf) = \frac{MSE_{F,F,true}}{MSE_{W,F,true}}100\%$$$ [4]
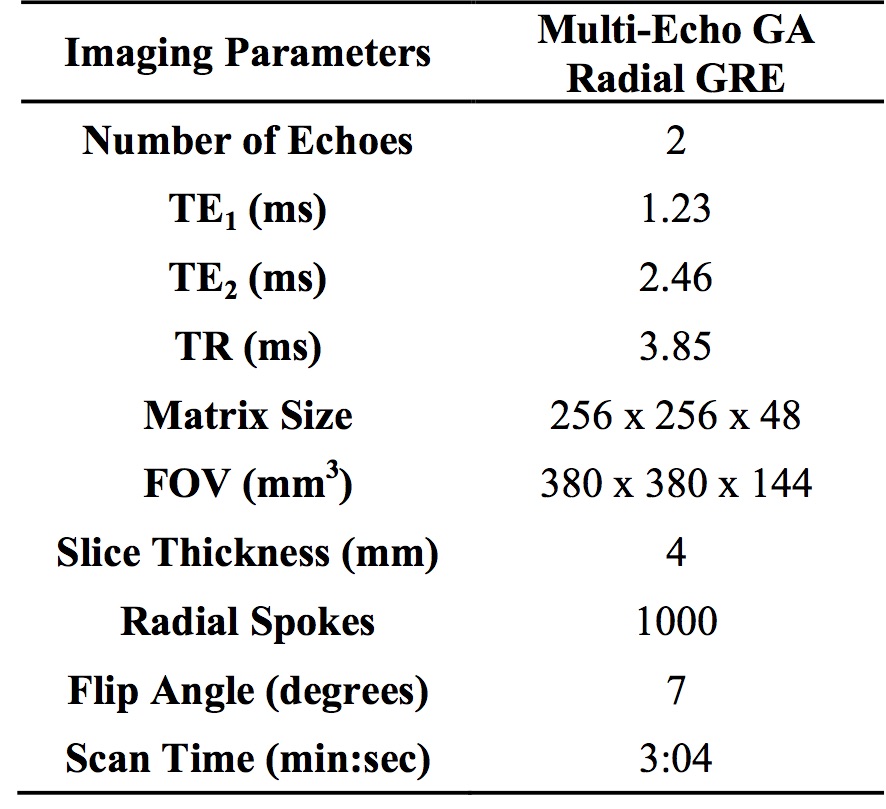
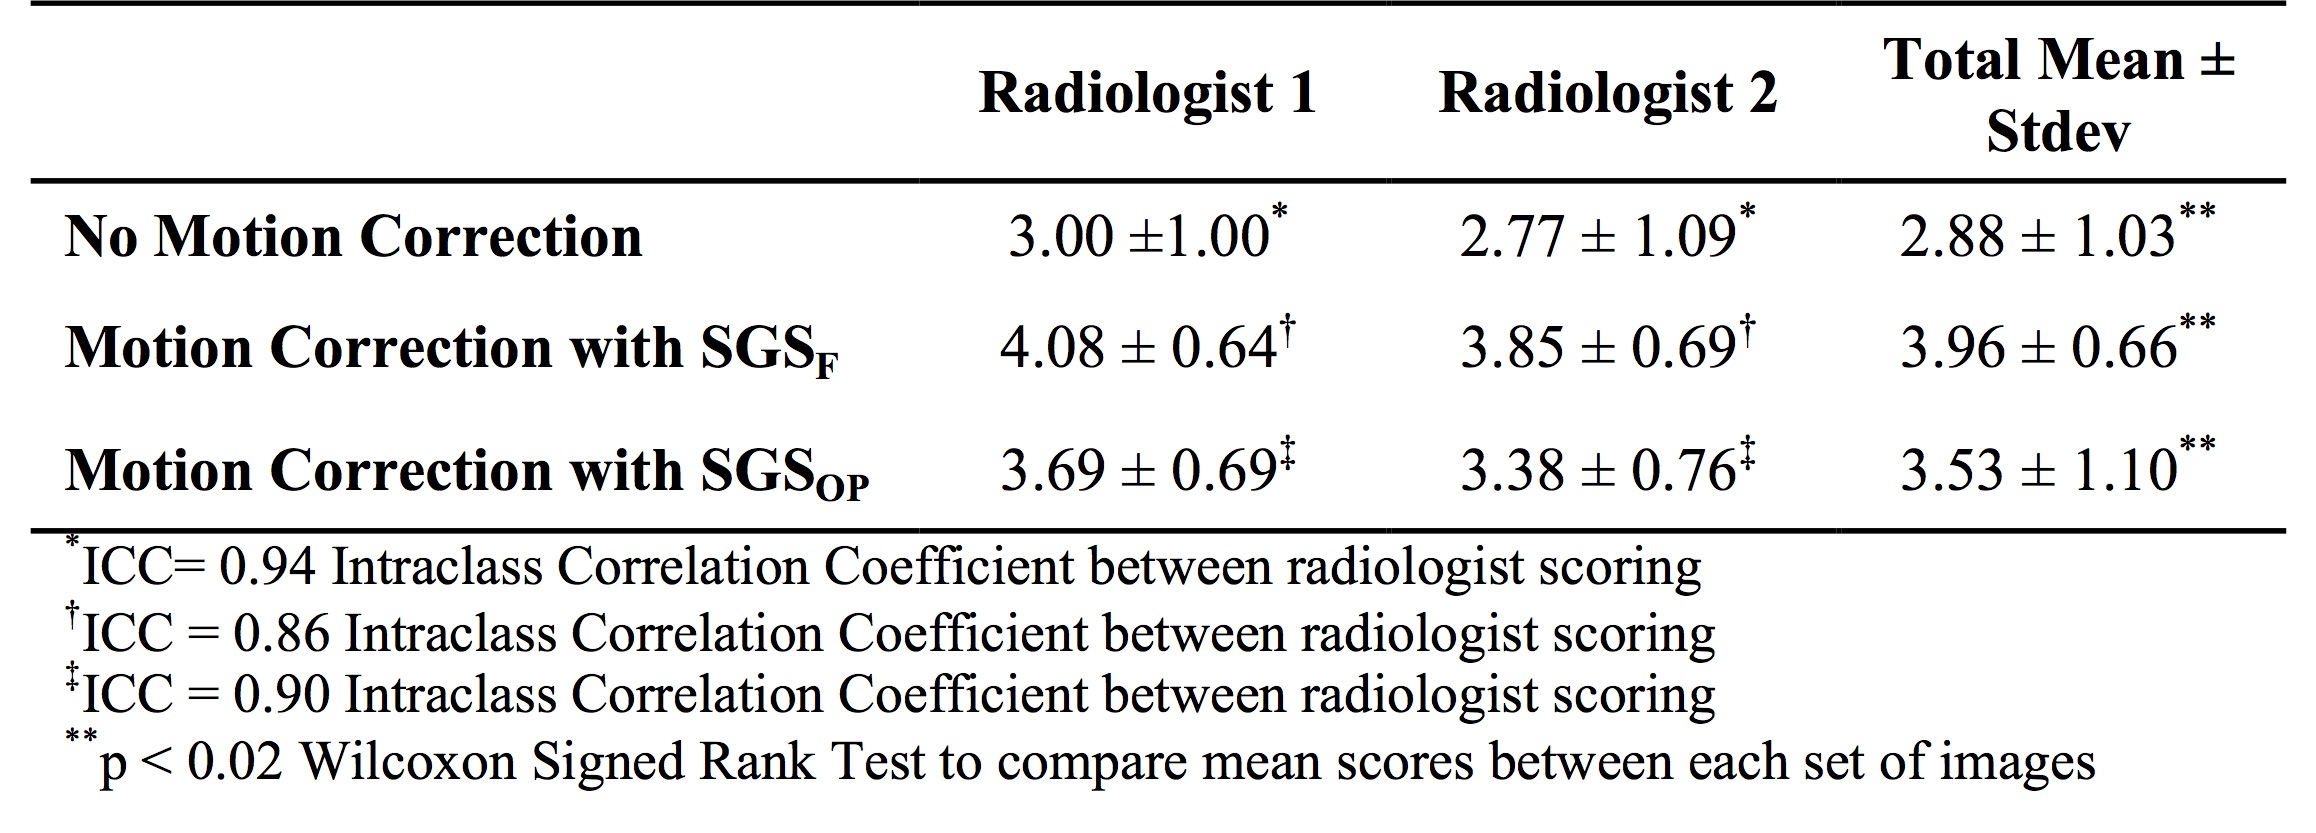
Thirteen healthy volunteers were scanned on a 3T scanner (Prisma, Siemens Healthcare, Erlangen, Germany). See figure 1 for imaging protocols. The SGSF and the SGSOP were compared to a video of the subject’s chest to detect respiratory motion. A correlation coefficient was determined between the video motion curve and SGSF and SGSOP. SGSF and SGSOP were then used to reconstruct images for motion compensation. Two experienced radiologists scored the three sets of images from 1 to 5 based on the motion artifacts (1 = severe motion artifacts, and 5 = no detectable motion artifacts). An intraclass correlation coefficient (ICC) test for comparison of radiologist scoring and Wilcoxon signed rank test for compare the means between the mean scores of the images with and without motion correction.
Results
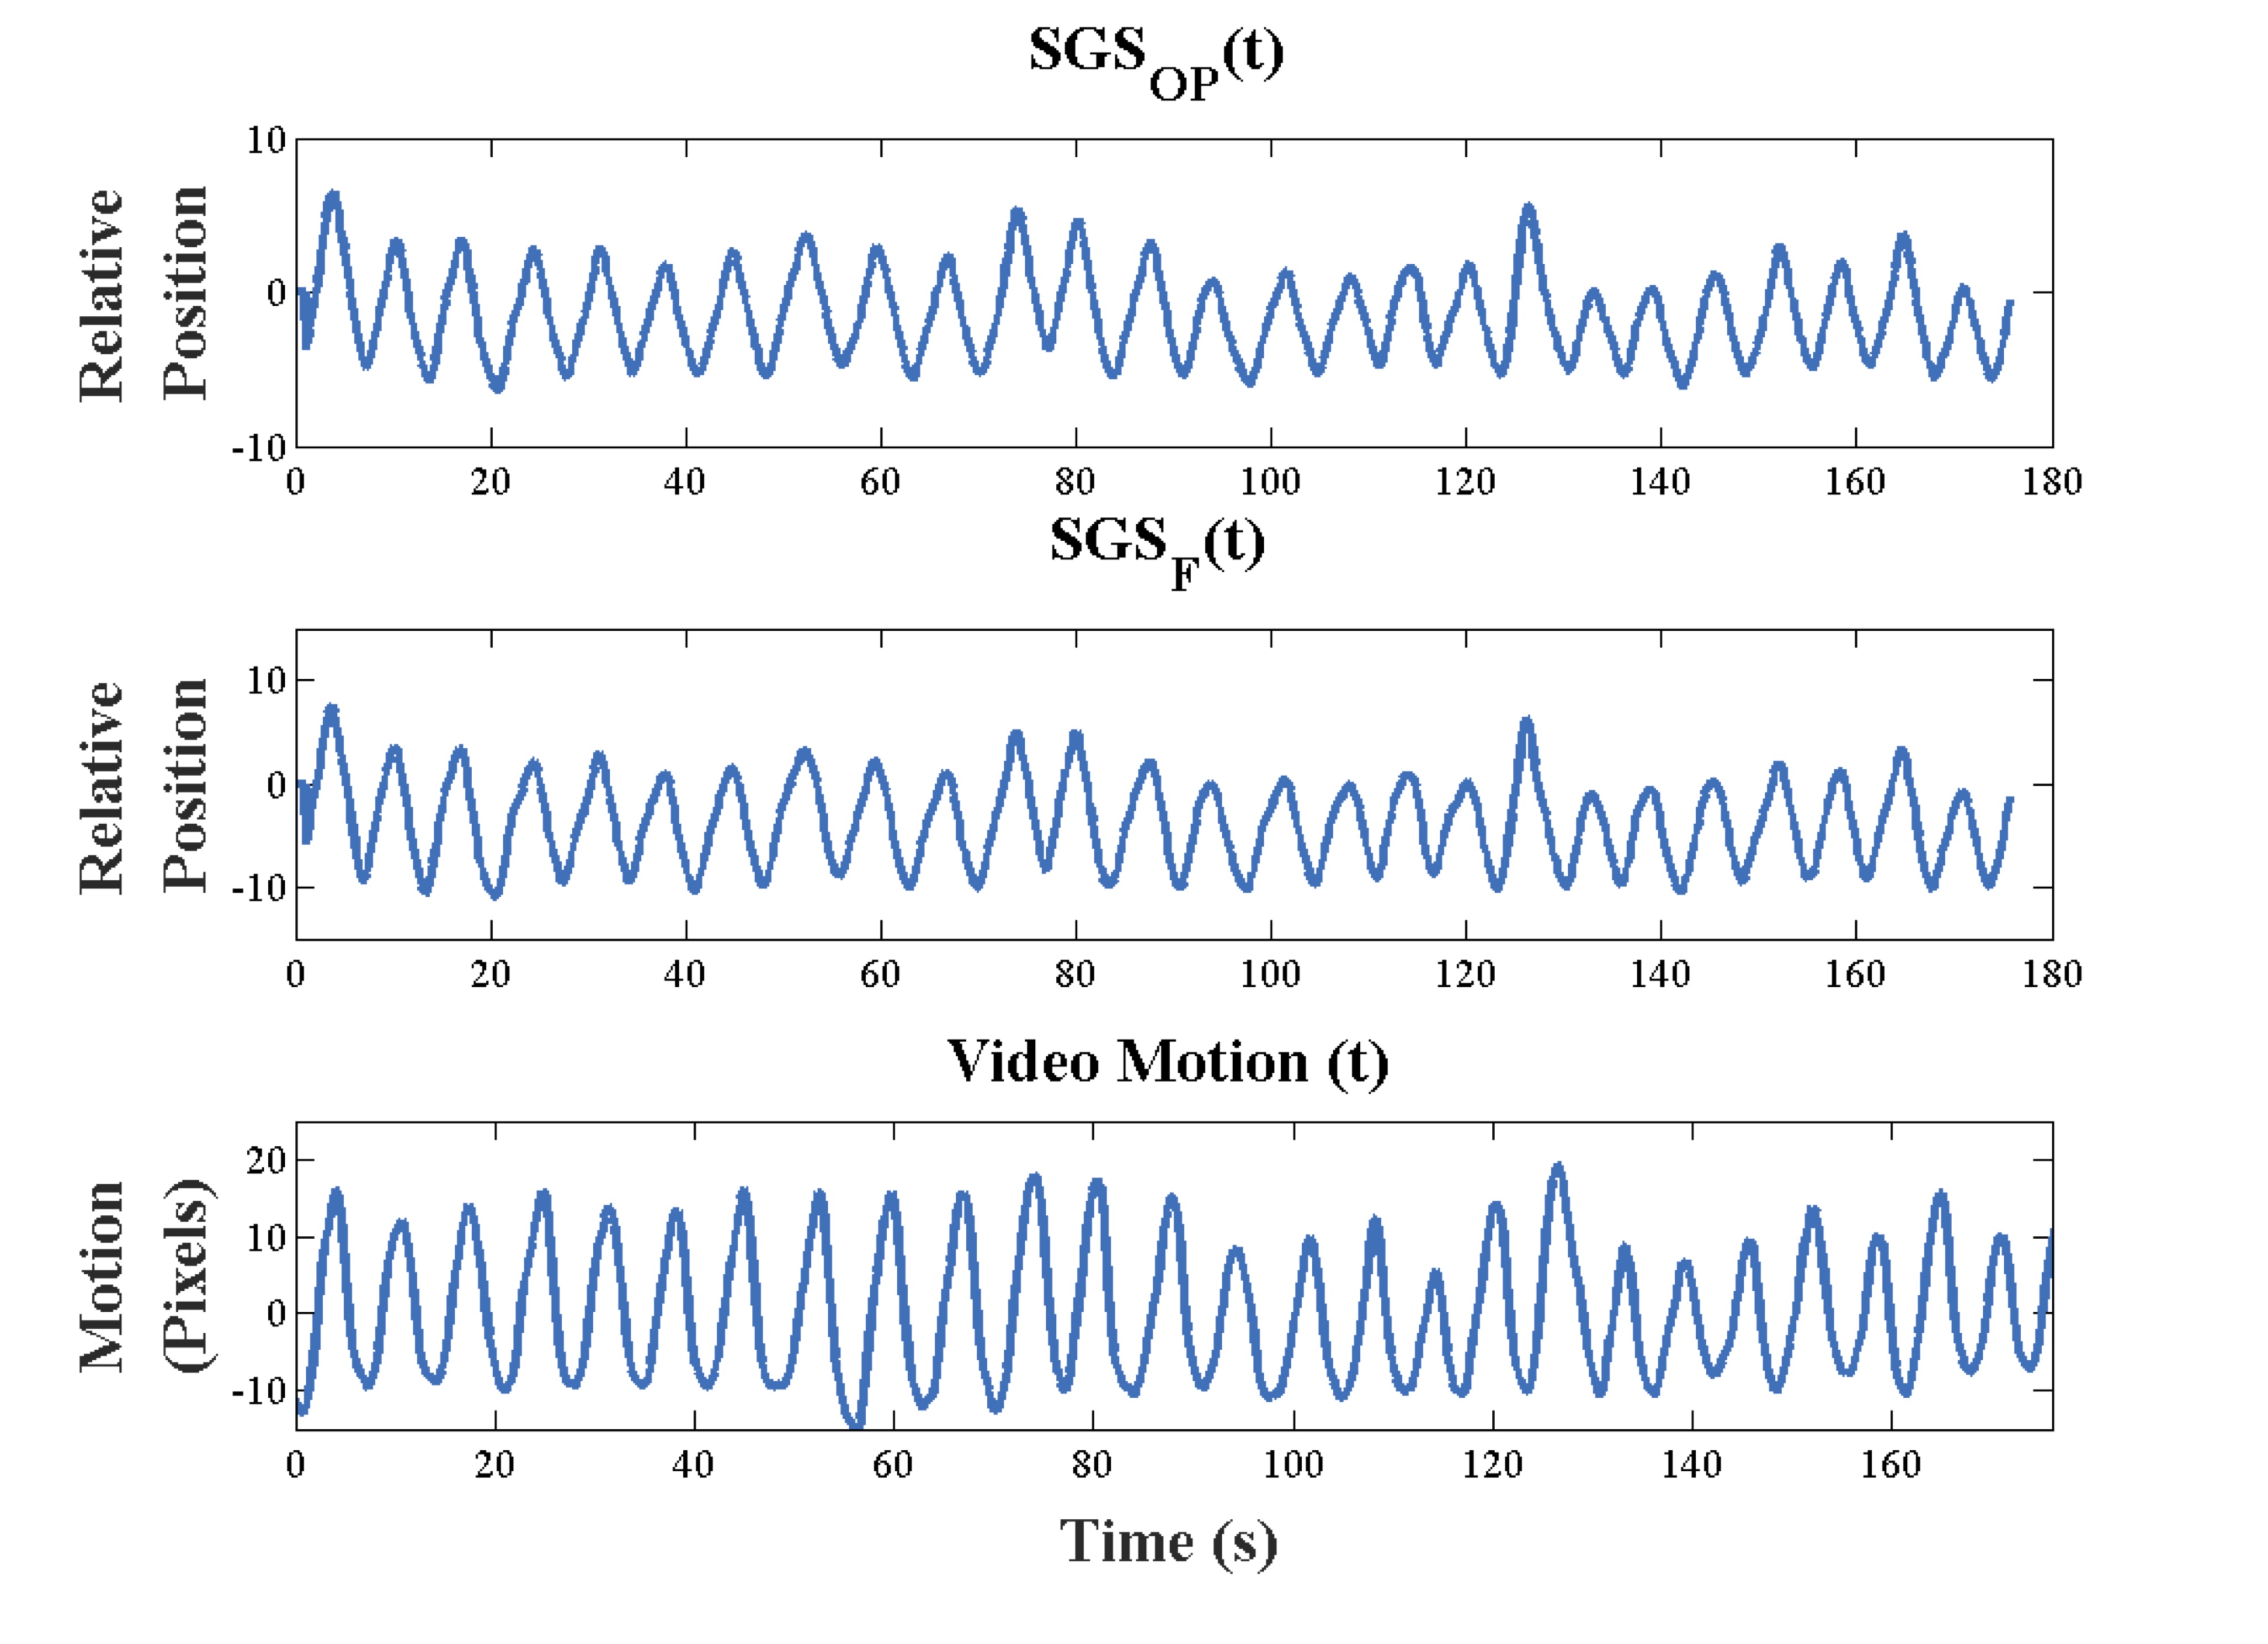
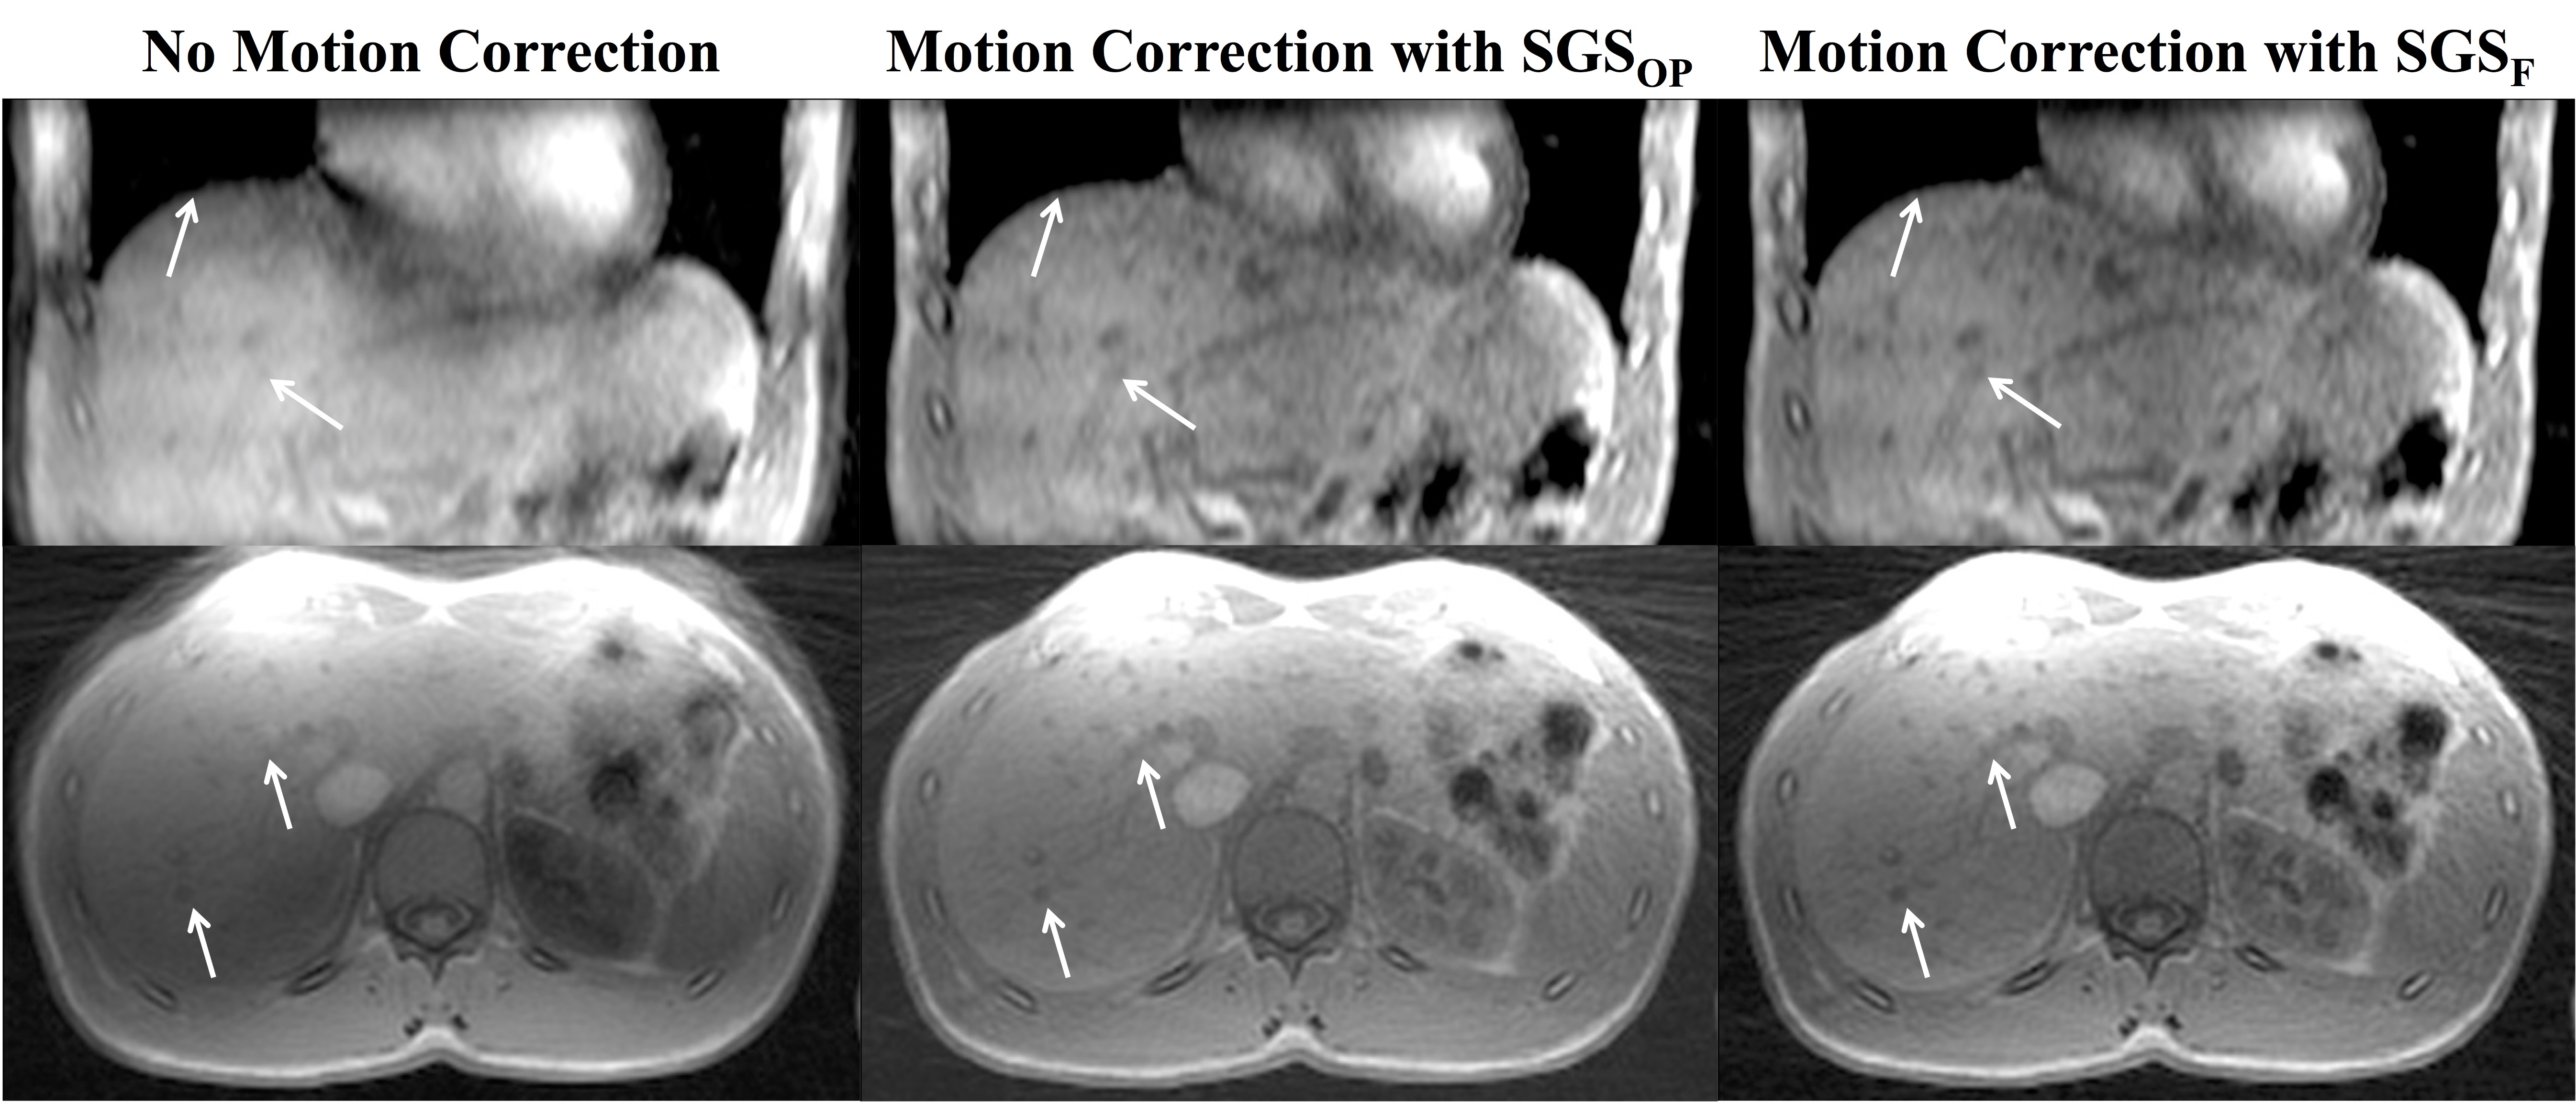
Numerical simulations (figure 2) showed that there is minimal change of the MSE PE as Δf increases (~1-5% change). A representative plot of the SGSOP(t), SGSF(t), and video motion(t) time curves is shown in figure 3. The mean correlation coefficient was higher for the SGSF(t) vs. video motion(t) (0.87 ± 0.08) compared to SGSOP(t) vs. video motion(t) (0.83 ± 0.11), however it was not significantly higher. The average radiologist scores were 2.88 ± 1.03, 3.96 ± 0.66, and 3.53 ± 1.10 (see table 2) for images without and with SGSF and SGSOP motion correction, respectively (p < 0.02 between all mean scores).Discussion & Conclusions
We have demonstrated that respiratory motion extraction and compensation in the liver can be achieved using fat-only self-navigated signal with minimal error in the fat-water separation (< 15%). The SGSF is comparable to an external respiratory source (mean linear correlation coefficient = 0.87 ± 0.08) as well as to the conventional SGS (mean linear correlation slope = 0.91 ± 0.12). Images with motion correction using SGSF all had a radiologist score that were all clinically relevant and statistically significant, compared to no motion corrected images (p < 0.01). Using this technique has potential implications for more robust motion correction for liver DCE-MRI, that is yet to be studied.Acknowledgements
Funding for project is provided by NICHD U01-HD087221.References
1. Alıcıoglu B, Guler O, Bulakbası N, Akpınar S, Tosun O, Comunoglu C. Utility of semiquantitative parameters to differentiate benign and malignant focal hepatic lesions. Clin Imaging. 2013;37(4):692-696. doi:10.1016/j.clinimag.2013.01.012.
2. Lin W, Guo J, Rosen MA, Song HK. Respiratory motion-compensated radial dynamic contrast-enhanced (DCE)-MRI of chest and abdominal lesions. Magn Reson Med. 2008;60(5):1135-1146. doi:10.1002/mrm.21740.
3. Feng L, Axel L, Chandarana H, Block KT, Sodickson DK, Otazo R. XD-GRASP: Golden-angle radial MRI with reconstruction of extra motion-state dimensions using compressed sensing. Magn Reson Med. 2016;0(2):n/a-n/a. doi:10.1002/mrm.25665.
4. Brau ACS, Brittain JH. Generalized self-navigated motion detection technique: Preliminary investigation in abdominal imaging. Magn Reson Med. 2006;55(2):263-270. doi:10.1002/mrm.20785.
5. Martin T, Armstrong T, Felker E, et al. Respiratory Motion Compensation in the Liver using Fat-Only Self Gated Signal. In: Proceedings 25th Scientific Meeting, International Society for Magnetic Resonance in Medicine. ; 2017:1026.
6. Dixon W. Simple proton spectroscopic imaging. Radiology. 1984.
7. Guiu B, Petit J-M, Loffroy R, et al. Quantification of Liver Fat Content: Comparison of Triple-Echo Chemical Shift Gradient-Echo Imaging and in Vivo Proton MR Spectroscopy. Radiology. 2009;250(1):95-102. doi:10.1148/radiol.2493080217.
Figures