4744
4D Flow MRI: A Preliminary Analysis of Changes in Arterial Flow During Liver Embolization In Swine1Medical Physics, University of Wisconsin Madison, Madison, WI, United States, 2Radiology, University of Wisconsin Madison, Madison, WI, United States
Synopsis
Transarterial embolization is a common treatment for liver tumors. Currently, radiographic techniques are used clinically to provide anatomical and qualitative hemodynamic information in assessment and treatment of liver tumors. The addition of 4D Flow MRI has the potential to provide functional information about the hemodynamic changes occurring pre, during and post treatment. We completed a feasibility study in a swine, in which clear flow changes were seen in the hepatic vascular system. The additional information provided by 4D Flow MRI has potential to improve the care of cancer patients.
Purpose
Transarterial embolization (TAE) is an effective, minimally invasive treatment for patients with liver cancer. During TAE, the arterial blood supply of the tumor is targeted and cutoff in order to induce ischemia and necrosis. Consequently, major alterations occur in the structure, resistance, and circulation patterns of the vascular tree supplying the tumor and background liver. Understanding baseline flow states and treatment-related changes in flow is critical when determining the optimal treatment pathway for a patient. Radiographic techniques are currently used for treatment planning and assessing angiographic end-points. These techniques provide anatomic and qualitative hemodynamic information. We hypothesize that 4D Flow MRI can improve the care of cancer patients by providing comprehensive information of vascular anatomy and macroscopic flow before and after interventions. Here, we report on a pilot study to monitor hepatic vascular hemodynamics pre- and post-embolization in an in vivo swine model.Methods
All procedures were approved by the institution’s animal care and use committee. A swine (55 kg) was sedated with 1.5% isoflurane supplemented with O2. First, 4D Flow MRI data of the abdomen were acquired with a radially undersampled sequence, PC VIPR1 , on a clinical 3T system (Discovery MR750, GE Healthcare): imaging volume: 32x32x32 cm, acquired spatial resolution=1 mm isotropic, VENC=50 cm/s, scan time: 15.6 min; retrospective cardiac and respiratory gating. Then, the swine was transferred to the Angio Suite and the proximal left hepatic artery was partially embolized with embolic particles (Embospheres, 100-300 µm) under fluoro-guidance. 3D digital subtraction angiography (DSA) volumes were acquired pre and post embolization with intra-arterial injections. Finally, 4D Flow MRI was repeated with identical parameters ~20 min after the embolization.
4D Flow
Processing: A PC angiogram and velocity vector maps were generated via offline
time averaged reconstruction. The hepatic and splenic arterial networks were
segmented from the PC angiogram using Mimics (Materialize) and visually
compared with the 3D DSA angiograms. Ensight (CEI) was used for the visualization
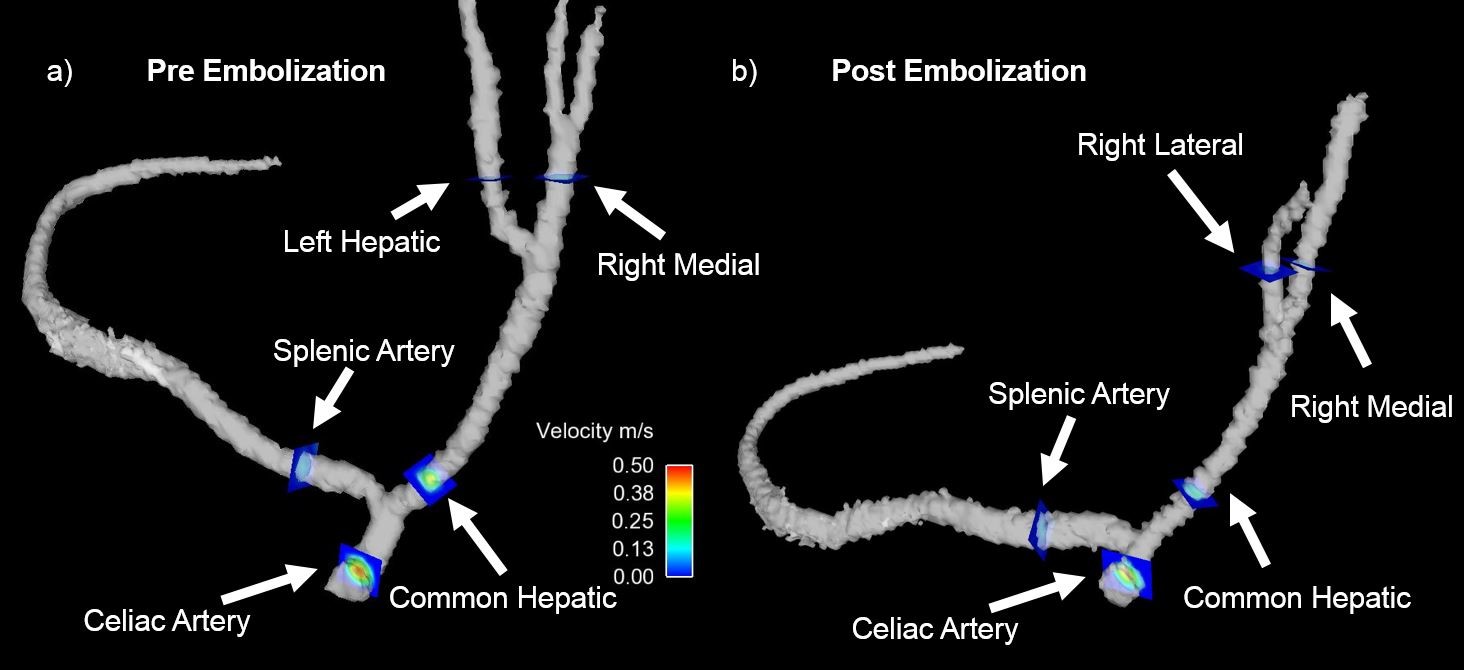
of vessel anatomy and placement of analysis planes (Figure 1): 3 planes aorta
proximal celiac(APC), splenic artery(SA), celiac artery(CA), common hepatic
artery(CHA), left hepatic(LH), right medial(RM), and right lateral(RL) artery. The
analysis planes were exported to a customized software package2 for
manual vessel segmentation and hemodynamic analysis. Flow values from pre- and
post- embolization were compared to assess changes in flow. Errors in flow
consistency were measured through conservation of mass measures.
Results
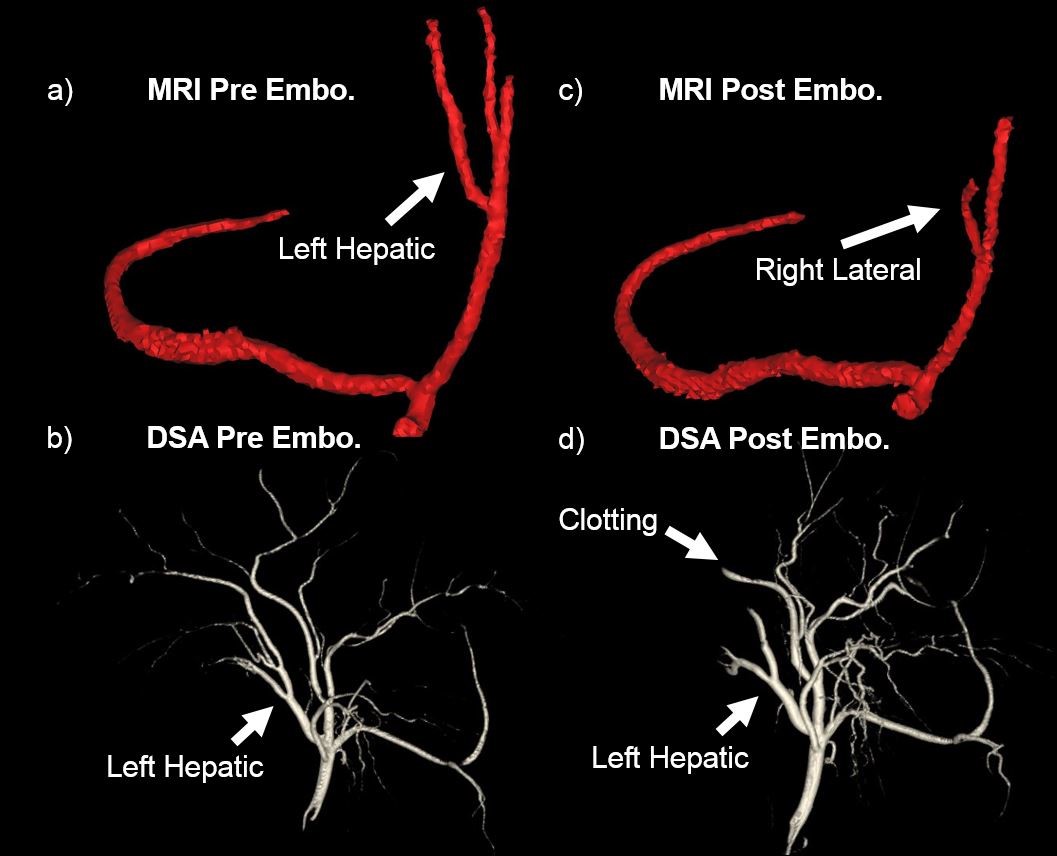
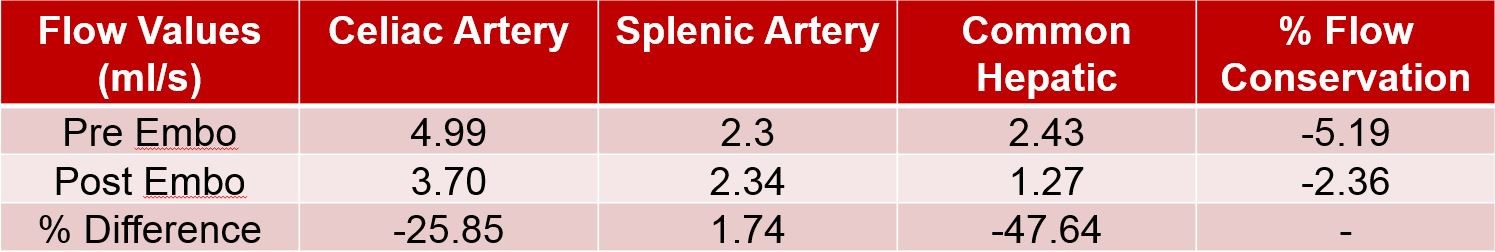
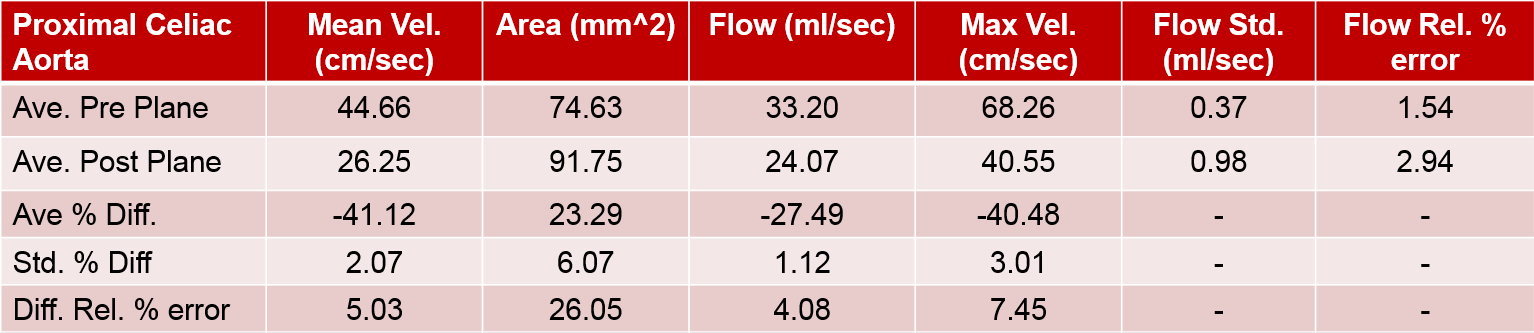
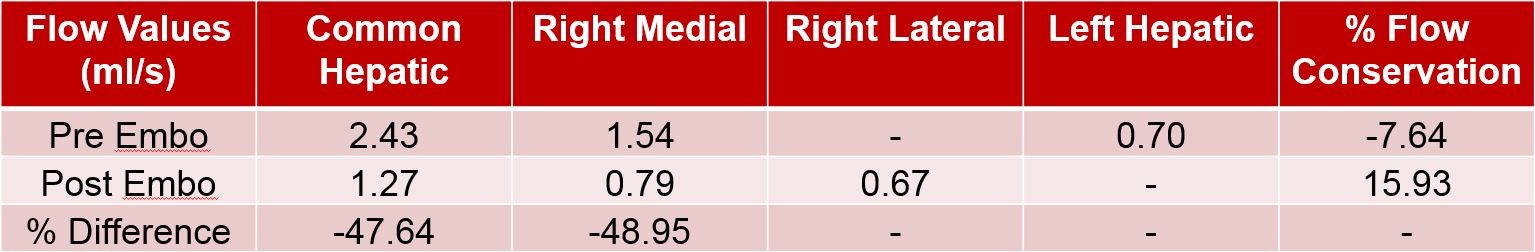
The 3D DSA showed changes in the vascular tree related to the embolization and possible clotting of the RM segment (Figure 2). The post-treatment 4D Flow Angiogram lost the ability to resolve the LH, but showed the previously invisible RL branch. Meanwhile, no significant flow change was observed in the SA (Figure 3) and a decrease in flow of ~50% was seen in the RM and CHA. The conservation of flow at the bifurcation between the CA to the SA and CHA showed an error of 5.2% (pre) and 2.4% (post); decreased flow was observed in the CA and CHA. Flow quantification in the APC showed a flow decrease of 27.5% (Figure 4) while the heart rate between pre- and post MRI scans remained fairly constant (5% decrease). The error in the conservation of flow measures increased in the hepatic vessel network to 7.6% and 16%, respectively (Figure 5).Discussion
As expected, the partially embolized LH was not visible in the 4D Flow angiogram as the remaining flow was very slow. The decreased flow measure in the RM is consistent with the loss of visibility of distal branches of the RM in the post-embolization DSA data, possibly caused by clotting. The ability to resolve the RL in the post- MR images might be a result of the occluded vessels and redistribution of flow to the RL. The overall blood flow to the liver was altered as reflected by the decreased measurements in the CHA. Conserved flow in the SA was unexpected given its relationship to the portal system. The decrease in APC flow could be due to the combination of the embolization and inhaled isofluorane which can cause vasodilation. The low levels of error in the conservation of mass calculations provide confidence in the flow measures.Conclusion
In this pilot study, 4D Flow MRI was successfully used to characterize embolization related changes in hepatic arterial blood flow. Such quantitative hemodynamic measures can possibly supplement the current subjective assessment of embolization success obtained by visual analysis of contrast enhancement patterns when assessing and planning liver embolizations. Future studies with validations of flow measures are warranted.Acknowledgements
No acknowledgement found.References
1) Johnson, K. M. et al Magnetic Resonance in Medicine. 2008; 60(6), 1329-1336. 2) Stalder AF, et al Magnetic Resonance in Medicine 2008;60(5):1218-1231.Figures