4740
The preliminary study of staging liver fibrosis in patients with chronic hepatitis B using MR T1ρ1Radiology department, Tianjin First Center Hospital, Tianjin, China, 2Philips healthcare, Beijing China, Beijing, China
Synopsis
This study explored the value of MR T1ρ in patients with chronic hepatitis B. Twenty normal control subjects and forty-eight patients with chronic hepatitis B, including twenty-two patients who were confirmed by liver biopsy (F1/F2/F3=8/8/6) took the MR T1ρ scan. T1ρ value showed significant increase in patients with chronic hepatitis B compared with normal control subjects, significant correlation with liver fibrosis staging and higher sensitivity and specificity in identifying F1 to F3 of liver fibrosis. We conclude that MR T1ρ can provide reliable T1ρ values and can be used to assess liver fibrosis.
Purpose
Liver fibrosis is a common pathological change of various chronic liver diseases, endangering human health. Liver fibrosis is an abnormal accumulation of collagen, proteoglycans and other macromolecules in the extracellular matrix. Studies estimating liver fibrosis and cirrhosis using magnetic resonance imaging (MRI) T1ρ in animal model and in human have been reported1-3. The purpose of this study was to explore the value of MR T1ρ in staging liver fibrosis in patients with chronic hepatitis B.Materials and methods
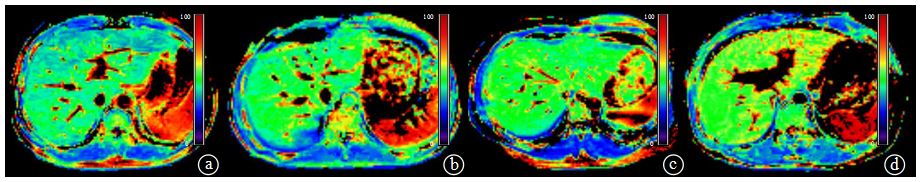
Twenty healthy control subjects (mean age=43.2±12.0 years; F/M=12/8) , forty-eight patients with Hepatitis B virus infection for more than half a year and clinic diagnosis of chronic hepatitis B, including twenty-two patients who were confirmed by liver biopsy (eight patients of stage F1 mean age=39.6±12.1 years, F/M=3/5; eight patients of stage F2,mean age=34.3±6.6 years, F/M=3/5; six patients of stage F2,mean age=39.3±12.6 years, F/M=2/4;) were recruited in this study and scanned with a 3.0T MR scanner (Ingenia, Philips, Healthcare, Best, the Netherlands) using a multi-transmit RF system and a 32 channel phased-array receiver coil. For T1ρ measurement, a rotary echo spin-lock pulse was implemented in a 3D balanced turbo field echo (b-TFE) sequence (TR/TE=3.8/1.82ms, FOV=300×360 mm, resolution=2.5×2.81×6.00mm, slice thickness=6 mm, slice number=8, NSA=2, B1max=11.5μT, TFE factor=64). The spin lock frequency was set to 500Hz and the TSLs (time of spin lock) were 1, 10, 20, 30, 40 and 50ms. The T1ρ map was generated on a pixel-by-pixel basis on Philips Research Integrated Development Environment (PRIDE) software written in Interactive Data Language using a mono-exponential decay model: M(TSL)=M0*exp(-TSL/T1ρ). T1ρ value was measured by two doctors independently with double-blank. The intraclass correlation coefficient (ICC) was used to assess interobserver agreements on T1ρ measurement. The student’s t test was used to compare the T1ρ value of normal control subjects and patients with chronic hepatitis B. Spearman test was used to analyze the correlation between T1ρ value and liver fibrosis staging. Receiver operating characteristic (ROC) curves and the area under the ROC curve (AUC) were used to evaluate the usefulness of T1ρ value for diagnosing the stage of liver fibrosis.Results
The interobserver agreements on T1ρ measurement was good (ICC = 0.989). T1ρ value were (44.00±1.84)ms and (49.90±2.13)ms for normal control subjects and patients with chronic hepatitis B, respectively, and statistically significant differences were observed among above two groups (P<0.001). T1ρ value of F1, F2 and F3 were (48.35±1.31)ms, (50.29±1.64)ms and (52.29±1.53)ms, and T1ρ value and liver fibrosis staging were significantly correlated (R=0.907, P<0.001). ROC analysis showed the AUC of F0 vs. F1-3, F0-1 vs. F2-3, F0-2 vs. F3 were 1.000, 0.967 and 0.958,the threshold were 46.19ms, 49.20ms and 49.51ms, and sensitivity and specificity of 100% and 100%, 92.86% and 92.86%,100% and 80.56%.Discussion
In this study, consistent with the previous literature1-3, T1ρ value showed significant increase in patients with chronic hepatitis B compared with normal control subjects, which may have close relationship with the excessive deposition of collagen and proteoglycans in the extracellular matrix. T1ρ value and liver fibrosis staging were significantly correlated, further demonstrating the value of T1ρ value in assessing the stage of liver fibrosis.T1ρ value showed higher sensitivity and specificity in identifying F1 to F3 of liver fibrosis. However, our study had not included the patients with liver fibrosis F4 and the sample size was small, both may influence the statistical results. Thus, the clinical value of MR T1ρ in differentiating different stage of fibrosis and liver cirrhosis still need further exploration.Acknowledgements
No acknowledgement found.References
1. Zhao F, Wang YX, Yuan J, et al. MR T1ρ as an imaging biomarker for monitoring liver injury progression and regression: an experimental study in rats with carbon tetrachloride intoxication. Eur Radiol. 2012; 22(8): 1709-1716.
2. Rauscher I, Eiber M, Ganter C, et al. Evaluation of T1ρ as a potential MR biomarker for liver cirrhosis: comparison of healthy control subjects and patients with liver cirrhosis. Eur J Radiol. 2014; 83(6): 900-904.
3. Singh A, Reddy D, Haris M, et al. T1ρ MRI of healthy and fibrotic human livers at 1.5 T. J Transl Med. 2015;13:292.
Figures