4739
Selective detection of liver fibrosis: Perfusion with hypercapnia challenge rather than T1 mapping.1Centre for Advanced Biomedical Imaging, University College London, London, United Kingdom, 2Centre for Medical Imaging, University College London, London, United Kingdom, 3University of Liverpool, Liverpool, United Kingdom
Synopsis
Quantitative T1 mapping is starting to be used clinically as a measure of liver fibrosis, but is confounded by the presence of inflammation in the liver. Work presented here describes the development of a new quantitative MRI measure, “change in perfusion in response to CO2 gas challenge”, in mice. This vasoactive challenge takes advantage of the pathological hallmarks of perivascular collagen seen in fibrosis, which is hypothesised to attenuate increases in tissue perfusion during hypercapnia.
Introduction
Quantitative T1 mapping has been identified as a potential tool for liver fibrosis staging1,2. Although inflammation is an important part of the underlying pathology of liver fibrosis, it is also associated with many other liver diseases and is a major component of pathological increases in T1. Additionally, response to novel liver fibrosis therapies includes an inflammatory component, which further confuses the utility of this method. The aim of this study was to develop a quantitative and non-invasive perfusion MRI parameter that is selective for liver fibrosis rather than liver inflammation.Methods
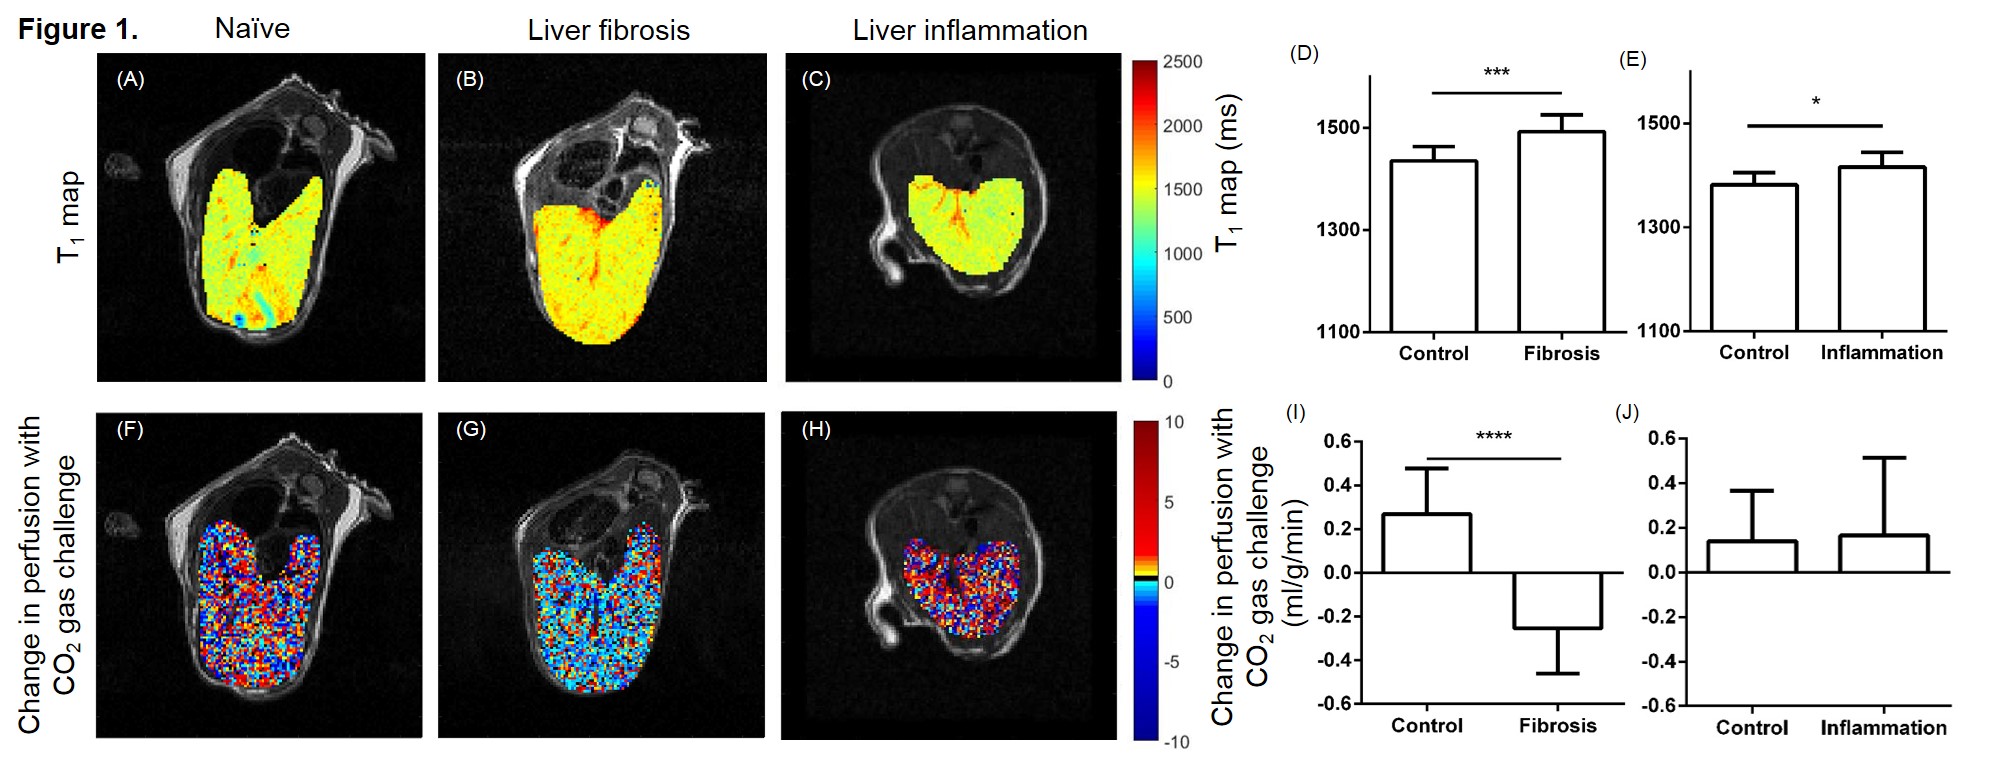
Using mouse models of 6 weeks of carbon tetrachloride (CCl4) induced liver fibrosis and acute lipopolysaccharide (LPS) induced liver inflammation, quantitative measures of T1 and the change in perfusion in response to a 10% CO2 hypercapnia gas challenge were acquired. A multislice flow sensitive alternating inversion recovery arterial spin labelling (FAIR-ASL)3 technique was used with respiration triggering and retrospective respiration gating with 100 Look-Locker gradient echo readouts (TR/TE 3.11/1.16 ms, 3x1 mm thick slices, 1 average, data matrix 128x128, 30x30 mm, ≈6 min) with both slice selective (3 mm) and global (200 mm) inversion pulses. Two perfusion maps were acquired before and 5 minutes after/during a hypercapnia challenge through 10% CO2 in the anaesthesia carrier gas prior to analysis with in-house MATLAB scripts.Results
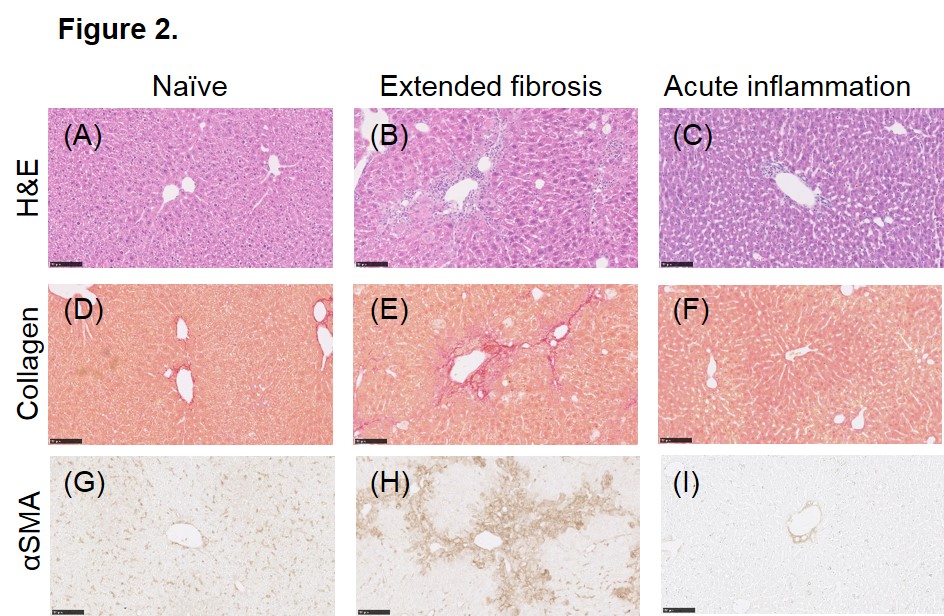
T1 was significantly higher in mice with either liver fibrosis or acute liver inflammation compared to their age-matched controls ((Figure 1 A-E) n=16 fibrosis: 1492 ±32.9 ms vs. n=8 control: 1435 ±27.8 ms; *** P = 0.0004; n=5 inflammation 1416 ±12.6 ms vs. n=7 control 1382 ±23.3 * P = 0.0437). However, mice with liver fibrosis displayed a significantly lower change in perfusion in response to CO2 gas challenge compared to controls, while mice with acute inflammation did not ((Figure 1 F-J) fibrosis: -0.254 ±0.052 ml/g/min vs. controls: 0.269 ±0.074 ml/g/min **** P <0.0001; inflammation: 0.140 ±0.008ml/g/min vs. controls: 0.165 ±0.16 ml/g/min n.s.d P=0.884). Histological tissue staining (Figure 2) of fibrotic liver indicated a high level of perivascular collagen and activated perivascular hepatic stellate cells (α-smooth muscle actin) absent in control and acute inflammation livers.Discussion
Taken together, these results indicate that while quantitative T1 mapping does distinguish fibrotic livers from controls, the cause of this change could likely come as a result of the inflammatory environment that is also present. The novel methodology presented here, of the perfusion change in response to a vasoactive challenge, takes advantage of the pathological hallmarks of liver fibrosis (perivascular collagen deposits and perivascular activated hepatic stellate cells) to develop a quantitative measure of disease that is not present in hepatic inflammation alone. The perivascular pathology is hypothesised to directly impair the ability of liver vasculature to vasodilate. Hepatic perfusion changes with post-prandial challenges are already underway in the clinic4.Conclusion
These results indicate a more cautious approach to interpreting clinical hepatic T1 map data in patients with liver fibrosis is required. The perfusion measurements with a hypercapnia gas challenge appears to selectively detect liver fibrosis rather than hepatic inflammation.
Acknowledgements
The authors acknowledge the following financial support: JJ Connell is funded by the UK Regenerative Medicine Platform. TL Kalber is funded by an EPSRC Early Career Fellowship (EP/L006472/1). MF Lythgoe receives funding from the Medical Research Council (MR/J013110/1); King’s College London and the UCL Comprehensive Cancer Imaging Centre CR-UK & EPSRC, in association with the MRC and DoH (England); the National Centre for the Replacement, Reduction and Refinement of Animal in Research (NC3Rs); UK Regenerative Medicine Platform Safety Hub (MRC: MR/K026739/1); Eli Lilly and Company.References
1. Banerjee R, Pavlides M, Tunnicliffe EM, Piechnik SK, Sarania N, Philips R, et al. Multiparametric magnetic resonance for the non-invasive diagnosis of liver disease. J Hepatol. 2014 Jan;60(1):69–77.
2. Pavlides M, Banerjee R, Sellwood J, Kelly CJ, Robson MD, Booth JC, et al. Multiparametric magnetic resonance imaging predicts clinical outcomes in patients with chronic liver disease. J Hepatol. 2016 Feb;64(2):308–15.
3. Ramasawmy R, Campbell-Washburn AE, Wells JA, Johnson SP, Pedley RB, Walker-Samuel S, et al. Hepatic arterial spin labelling MRI: an initial evaluation in mice. NMR Biomed. 2015 Feb;28(2):272–80.
4. Agrawal S, Hoad CL, Francis ST, Guha IN, Kaye P, Aithal GP. Visual morphometry and three non-invasive markers in the evaluation of liver fibrosis in chronic liver disease. Scand J Gastroenterol. 2016 Sep 23;1–9.
Figures