4738
Comparison of different multi-fat peak models for the assessment of hepatic iron and fat1Dept. of Radiology, Medical University of Innsbruck, Innsbruck, Austria, 2Dept. of Internal Medicine, Medical University of Innsbruck, Innsbruck, Austria
Synopsis
The evaluation of hepatic iron and fat by MR techniques is of increasing interest for clinical routine. The purpose of our study was to investigate the influence of different multi-peak fat models on the obtained R2*, PDFF and goodness of fit values in patients with suspicion of diffuse liver disease. It is shown that the use of multi-peak fat spectrum modeling is highly recommended for accurate quantification of R2* and PDFF . A 6-peak model resulted in the best goodness of fit. The use of a higher number of peaks seems to offer no additional advantage.
Introduction
Magnetic resonance imaging has become widely accepted for the evaluation of diffuse liver disease, especially for the assessment of hepatic iron and fat. Thereby in recent years, especially multi-gradient-echo sequences together with multi-peak fat spectrum modeling1,2 have become increasingly popular for simultaneous hepatic iron and fat quantification. For multi-peak fat spectrum modeling, however, the underlying complex fat spectrum has to be defined prior to data fitting. Chemical-shift data of spectroscopic studies3,4 are usually used for this purpose and have to be properly converted for the actual application (e.g. by considering temperature or pH dependencies). It was the purpose of our study to investigate the influence of different multi-peak fat spectrum models on the obtained R2*, PDFF and goodness of fit values in patients with suspicion of diffuse liver disease.Materials and Methods
After approval by our local institutional review board a total of 134 patients were included in this study. All patients were referred to our radiology department as part of the standard diagnostic procedure for hepatic iron evaluation. MR imaging was performed on a 1.5T whole body MR scanner (Magnetom AvantoFit, Siemens, Germany). For iron and fat quantification a multi-echo gradient-echo sequence with 12 echoes (TR=200ms; TE=0.99ms + n*1.41ms, flip angle: 20°) was used in transversal orientation. During one breath hold one single slice was acquired at a location with maximum liver cross-section. Hepatic R2* values and proton density fat fraction (PDFF) values were calculated for three different ROIs carefully placed in the liver parenchyma to avoid major vessels. Multi-peak fat spectrum modeling was performed off-line on magnitude data using a custom written ImageJ5 plugin based on the following signal model:
$$$S_{n}=\mid\left(M_{w}+c_{n}M_{f}\right)\mid e^{-TE_{n}R_{2eff}^*}$$$ with $$$c_{n}=\sum_iw_{i}e^{j\left(2\pi\triangle f_{i}TE_{n}\right)}$$$
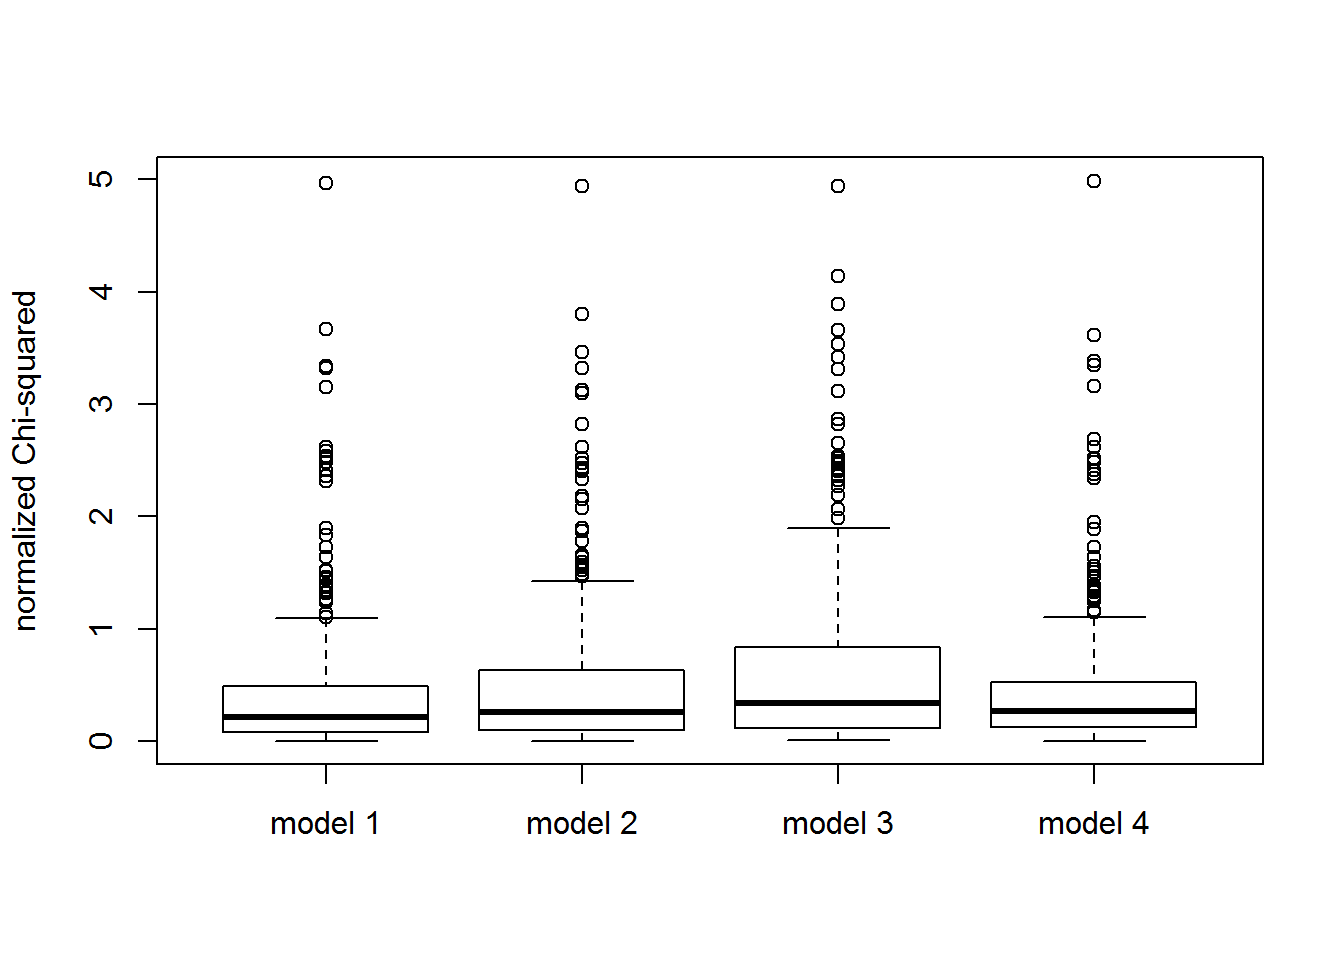
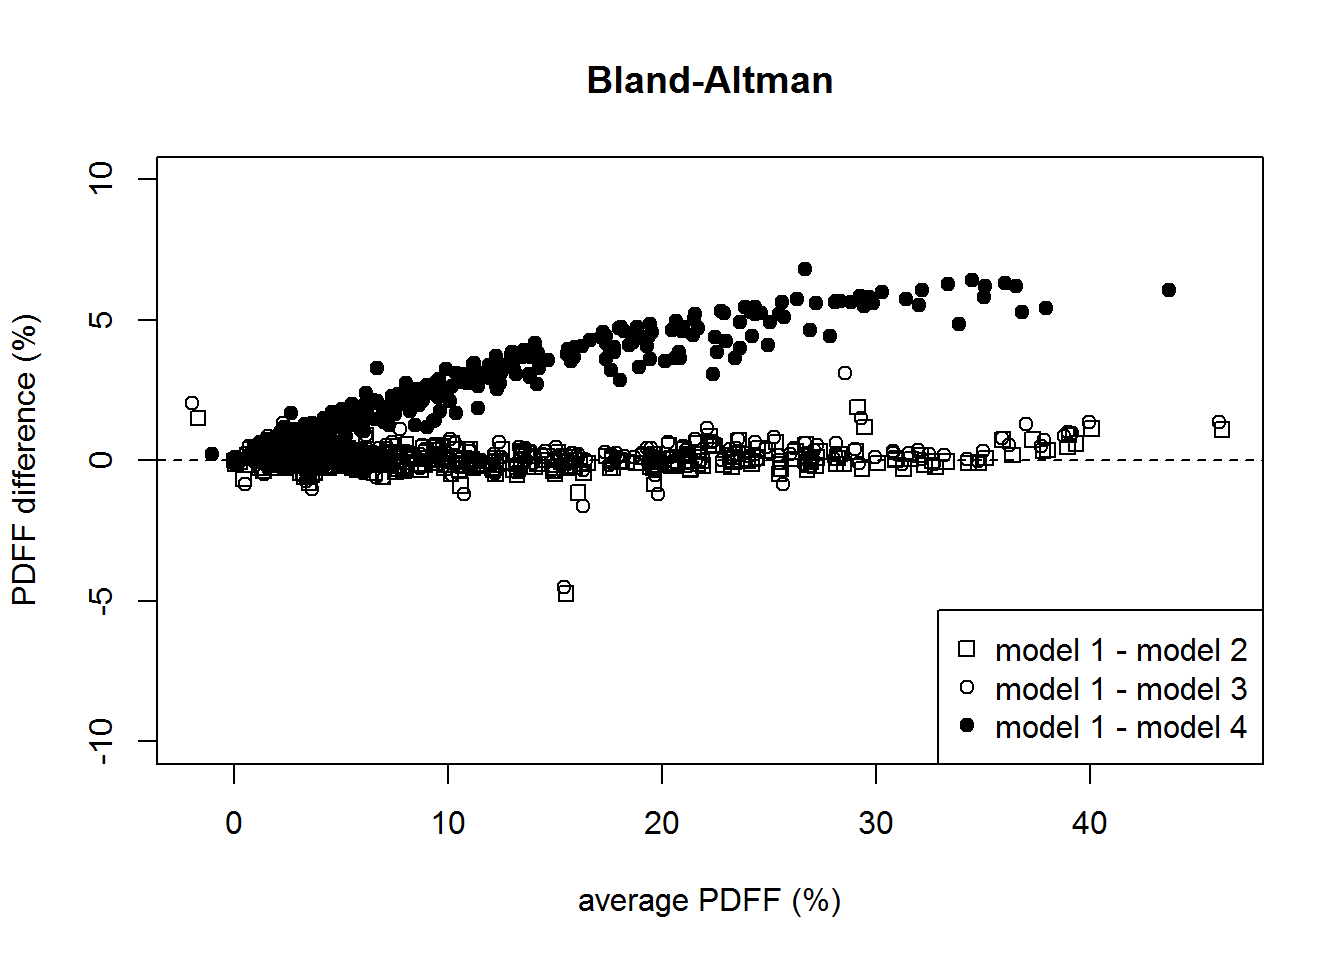
where cn is a complex coefficient defined by the used spectral fat model, wi and ∆fi are the weighting factor and the resonance frequency offset of the i-th fat peak, respectively, TEn is the echo-time of the n-th echo, Mw and Mf are the amplitudes of water an fat, respectively, and R*2eff is the assumed common R2* value for water and fat. Four different spectral fat models, as shown in the tables below, were fitted to the data and the fits were compared using χ²-values as a measure of goodness of fit. In addition the obtained R2* and PDFF values were compared using box plots, Bland-Altman plots and ANOVA.
Results and Discussion
No significant difference of the goodness of fit (figure 2) was found between model 1 and model 2 (p=0.401) and between model 1 and model 4 (p= 0.877). Goodness of fit values for model 3, while still in an acceptable range, were found to be significantly worse (p=0.0062) than for model 1. Interestingly, however, no significant difference between the obtained R2* and PDFF values was found between models 1, 2 and 3, although for high R2* values (R2* > 400 1/s) an increase in the disagreement between these models of up to 5% is observed (figure 3). R2* values for model 4 show a higher tendency for disagreement compared to model 1 over the whole range of R2* values, which is not observed for the other models. For the obtained PDFF values, no significant difference (mean difference 0.02-0.13%) was found between models 1, 2 and 3. For model 4 a systematic underestimation of PDFF values of about 20% is observed (figure 4).Conclusions
In accordance with the work of Wang et al.6, our results show that even though significant differences in the goodness of fit are observed, the obtained R2* and PDFF values for multi-peak fat spectrum modeling are not strongly influenced by the particular details of the underlying model. Using only a single-peak fat model leads to similar goodness of fit values as compared to the more complex models, however, especially the obtained PDFF values are significantly underestimated due to the neglect of the underlying complex hepatic fat spectrum. Due to this, the use of multi-peak fat spectrum modeling is highly recommended for accurate R2* and PDFF quantification. As the 6-peak model (model 1) resulted in the best goodness of fit, the use of a higher number of fat peaks (model 2 and model 3) seems to offer no additional advantages.Acknowledgements
No acknowledgement found.References
1. Yu H, Shimakawa A, McKenzie CA, et al. Multiecho water-fat separation and simultaneous R 2* estimation with multifrequency fat spectrum modeling. Magnetic Resonance in Medicine 2008; 60: 1122-1134.
2. Hernando D, Kramer JH, Reeder, S. Multipeak fat-corrected complex R2* relaxometry: Theory, optimization, and clinical validation. Magnetic Resonance in Medicine 2013; 70: 1319-1331
3. Hamilton G, Yokoo T, Bydder M, et al. In vivo characterization of the liver fat 1H MR spectrum. NMR in Biomedicine 2011; 24: 784-790.
4. Ren J, Dimitrov I, Sherry AD, et al. Composition of adipose tissue and marrow fat in humans by 1H NMR at 7 Tesla. J Lipid Res 2008; 49: 2055-2062.
5. Schneider CA, Rasband WS, Eliceiri KW. NIH Image to ImageJ: 25 years of image analysis. Nature methods 2012; 9: 671-675.
6. Wang X, Hernando D, Reeder S. Sensitivity of chemical shift-encoded fat quantification to calibration of fat MR spectrum. Magnetic Resonance in Medicine 2016; 75: 845-851.
Figures