4737
Transducer-Free Hepatic Magnetic Resonance Elastography using Cardiac Wave Induction at 0.3ms Temporal Resolution1Imaging Sciences and Biomedical Engineering, King's College London, London, United Kingdom, 2Department of Radiology and Nuclear Medicine, Academic Medical Center, Amsterdam, Netherlands, 3Philips Healthcare, Guildford, United Kingdom, 4Biomedical and Metabolic Imaging Branch, The National Institute of Diabetes and Digestive and Kidney Diseases, The National Institutes of Health, Bethesda, MD, United States
Synopsis
Hepatic MRE is a promising non-invasive tool for diagnosing liver fibrosis. To facilitate clinical translation, we developed a method to eliminate the need for mechanical actuators for wave generation. Propagation of the transient cardiac shear waves within the liver caused by cardiac-valve closure can be imaged at a very high temporal resolution (0.3ms) using a 2D motion-sensitised pencil beam, with total data acquisition time fitting into four consecutive breath holds. These images were used to estimate liver stiffness, with a high temporal resolution allowing for reliable fitting to the space-time images and thus robust speed estimates.
Introduction
Hepatic magnetic resonance elastography (MRE) demonstrates a good correlation between liver stiffness and level of fibrosis found in liver biopsy, making it a promising non-invasive method for screening and follow-up of patients with (suspected) liver fibrosis [1]. A possible improvement to facilitate clinical translation would be elimination of the need for mechanical actuators for wave generation. Studies have shown that cardiac motion can be used to assess liver stiffness using tagged magnetic resonance imaging techniques, in which deformation levels caused by cardiac motion change with the increase of liver stiffness. However, these approaches do not yield absolute quantification of liver stiffness [2,3]. Previous transient 2D-MRE approaches showed good correlation between stiffness determined via cardiac induced shear waves and harmonic MRE, but shows variances in estimated stiffness [4]. Here we propose using a 2D motion-sensitised pencil beam, initially developed for cardiac MRE [5], to capture propagation of the transient cardiac shear waves within the liver at a very high temporal resolution (0.3ms), with total data acquisition time fitting into 4 consecutive breath holds.Methods
Six healthy volunteers were included in this study, MRI scans were performed on a Philips 3T scanner. The navigator was positioned adjacent to the heart in liver segment 2,3, 4A and 4B pointing downwards in feet-direction (Fig. 1). The ECG-triggered sequence consists of a block of ~40 consecutive 2D pencil beam image shots (30mm, 80mm length, 20ms duration) played throughout a single R-R interval repeated for 60 consecutive R-R intervals, divided into 4 breath holds. Image shots in subsequent R-R intervals are time-shifted relative to the QRS-start. With typically 35-40 shots per R-R interval (depending on the person’s heart rate), 15sec breath hold time, and 4 repetitive breath holds, a temporal resolution of 0.3ms can be achieved. Motion sensitisation was chosen orthogonal to the long-axis of the 2D pencil beam, predominantly encoding shear waves. The phase images of all image shots yield a space-time image of transient shear wave propagation within the liver segment covered by the image volume. Shear wave speed was determined by fitting a straight line along the phase perturbations occurring at the 1st and 2nd heart sound (Fig.2A).Results
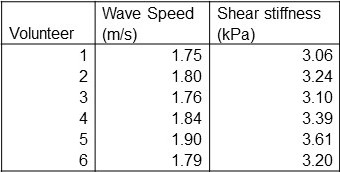
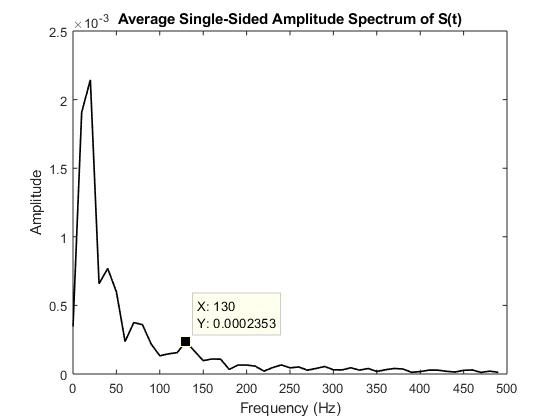
Space-time images from all volunteers showed two distinct time points where shear waves propagated from the heart downwards into the liver (Fig.2B,C). Those times correspond to the 1st heart sound (atrioventricular-valve closure) at approximately 80-100 ms and to the 2nd heart sound (aortic-/pulmonary-valve closure) at approximately 300-320 ms (Fig.2A). The values of wave speed and corresponding shear stiffness (assuming no loss effects) are listed in table 1. On average a stiffness of 3.27 kPa +/- 0.34kPa is found. As there were multiple waves, the speed was based on the wave originating from the 2nd heart sound. Compared to classical MRE performed at 40Hz, transient shear stiffness’s were higher by about a factor 3-4. When analyzing the spectrum of the 2nd heart sound (Fig.3), the emission spectrum shows a peak at 130Hz. As dispersion properties of liver tissue are approximately linear with frequency, a stiffness of ~1kPa measured at 40Hz increases to about 3kPa at 130Hz, explaining the discrepancy. Also, the higher frequency propagates faster through the liver than low frequencies, explaining the difference in wave speed between the start and the end of the 2nd heart sound (Fig.2D).Discussion
This study shows that the proposed approach allows the visualisation of transient shear waves in the liver induced by cardiac motion at very high temporal resolution (0.3ms). Specifically, using waves created by cardiac-valve closure it is possible to determine shear wave speed without a transducer. Importantly, the high temporal resolution allows reliable fitting to the space-time images and thus robust speed estimates. The results show a fast wave propagation, caused by the high-frequency content of the wave generated from cardiac valve closure. A fibrotic liver stiffness of ~6kPa measured at 40Hz would yield about 4m/s at 130Hz. Our data show that the propagation can be visualised along 80mm, which would result in approximately 60 timepoints where the wave is visible. We plan to apply this approach now to liver fibrosis patients and compare diagnostic efficiency to classical 3D MRE.Conclusion
Hepatic 2D motion-sensitised pencil beam MRE demonstrates that intrinsic waves generated by cardiac motion can be used to estimate stiffness of the liver, without the need for an external transducer. This could be an improvement that could facilitate clinical implementation of MRE, for example for screening and follow-up of liver fibrosis, once the technique is validated in a larger, more varied population.Acknowledgements
This project has received funding from the European Union’s Horizon 2020 research and innovation programme under grant agreement No 668039 and from the British Council's Newton Fund Institutional Links with grant agreement ID 172707526. Co-funded by the Erasmus+ programme of the European Union.
References
1. Srinivasa Babu A, Wells ML, Teytelboym OM, et al. Elastography in chronic liver disease: modalities, techniques, limitations, and future directions. Radiographics. 2016;36:1987–2006.
2. Harouni AA, Gharib AM, Osman NF, Morse C, Heller T, Abd-Elmoniem KZ. Assessment of liver fibrosis using fast strain-encoded MRI driven by inherent cardiac motion. Magnetic Resonance in Medicine 74:106–114 (2015).
3. Kim KE, Park MS, Chung S, et al. Magnetization-tagged MRI is a simple method for predicting liver fibrosis. Clin Mol Hepatol. 2016 Mar;22(1):140-5.
4. Olsen DA, Song P, Glaser KJ, Ehman RL. Cardiac-gated hepatic MR elastography with intrinsic transient waveforms. Proc Intl Soc Mag Reson Med. 2011;19:43.
5. Webb J, Runge J, Martorell J, et al. Using transient intrinsic torsional shear wave propagation to measure Left Ventricular Myocardial stiffness with a 2D pencil beam navigator at 0.5ms temporal resolution: Initial results from phantom studies and volunteers. ISMRM 2017.
Figures
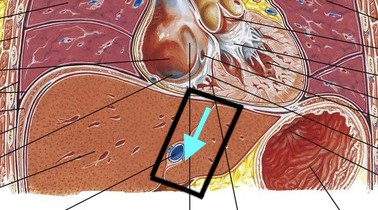
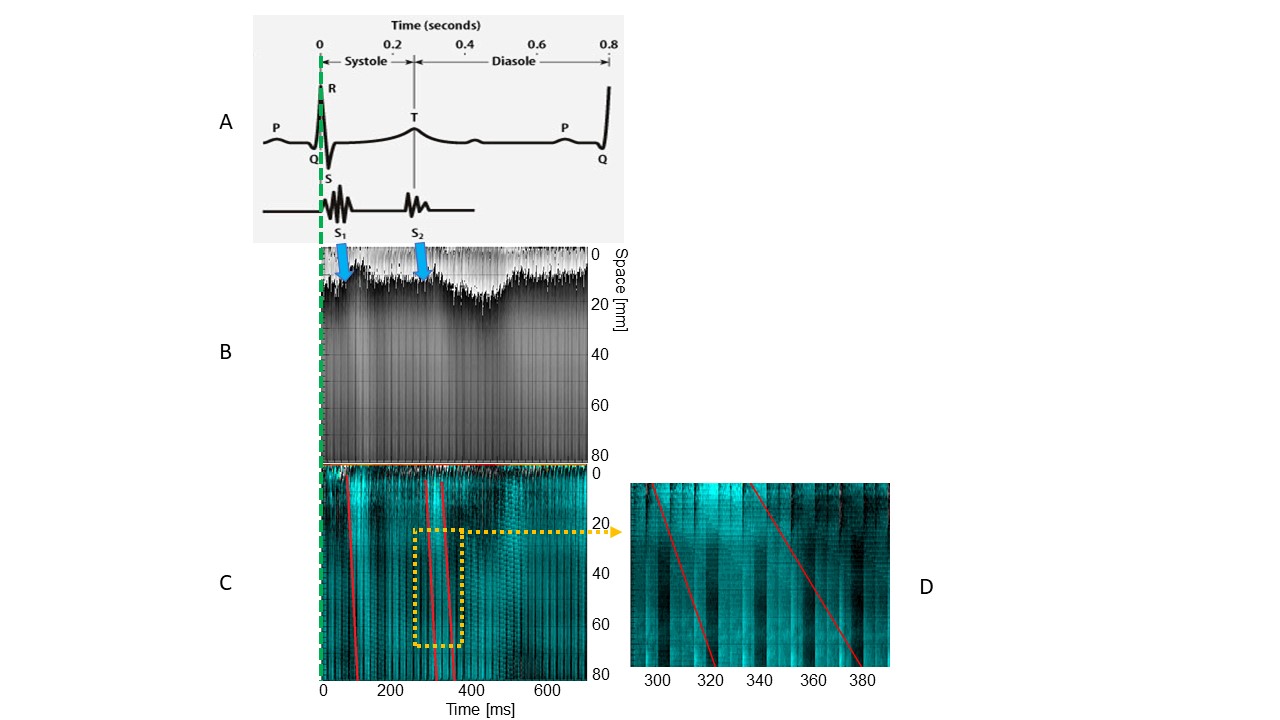
Figure 2.
A. 1st heart sound (S1) and 2nd heart sound (S2) relative to time after R in QRS complex
B. Example of phase image showing wave propagation in liver in space and time in relation to time after R
C. Same image after filtering. Red lines represent wave speed.
D. Wave at 2nd heart sound zoomed in. Note the difference in wave speed at the beginning of the 2nd heart sound compared to the end of the 2nd heart sound.