4736
MRI markers of liver related outcomes1Sir Peter Mansfield Imaging Centre, School of Physics and Astronomy, University of Nottingham, Nottingham, United Kingdom, 2NIHR Nottingham Biomedical Research Centre, University of Nottingham, Nottingham, United Kingdom
Synopsis
We used quantitative MR measures to assess changes in microstructure and haemodynamics in the liver and kidney of 60 patients with compensated cirrhosis (CC), 9 patients with decompensated cirrhosis (DC) and 40 healthy volunteers (HV). Liver T1 and perfusion was significantly reduced and renal T1 significantly increased with disease severity. In this prospective study, 1 in 6 CC patients have since had a Liver Related Outcome (LRO). These patients showed significant changes in baseline MR measures suggesting these MR measures in our multi-parametric MRI protocol can be used as a marker of LRO.
Purpose
Monitoring structural and haemodynamic changes in cirrhosis patients may provide clinicians with important information about organ structure and function, and potentially aid in treatment choice. Here, we explore whether MRI haemodynamic and structural parameters have the sensitivity to differentiate disease severity and determine future liver related outcome (LRO).Methods
60 patients with compensated cirrhosis (CC) of varied aetiology (Non-Alcoholic Fatty Liver Disease (NAFLD), 16 patients, 27%; Hepatitis-C Virus (HCV), 12 patients, 20%; Alcoholic Liver Disease (ALD), 21 patients, 35%; Other, 11, 18%), 7 decompensated cirrhosis (DC) patients and 40 healthy volunteers (HV) were recruited to an MRI scan session. MRI scans of the 60 CC patients were taken as early as 2010, and patients were subsequently followed clinically to assess whether MR measures can provide an indicator of decompensation in this cohort.
Patients attended an MRI scan after an overnight fast. Data was collected on a 1.5T Philips Achieva scanner (SENSE-XL Torso coil) to assess structure and haemodynamics in liver/splanchnic/cardiac/renal organs.
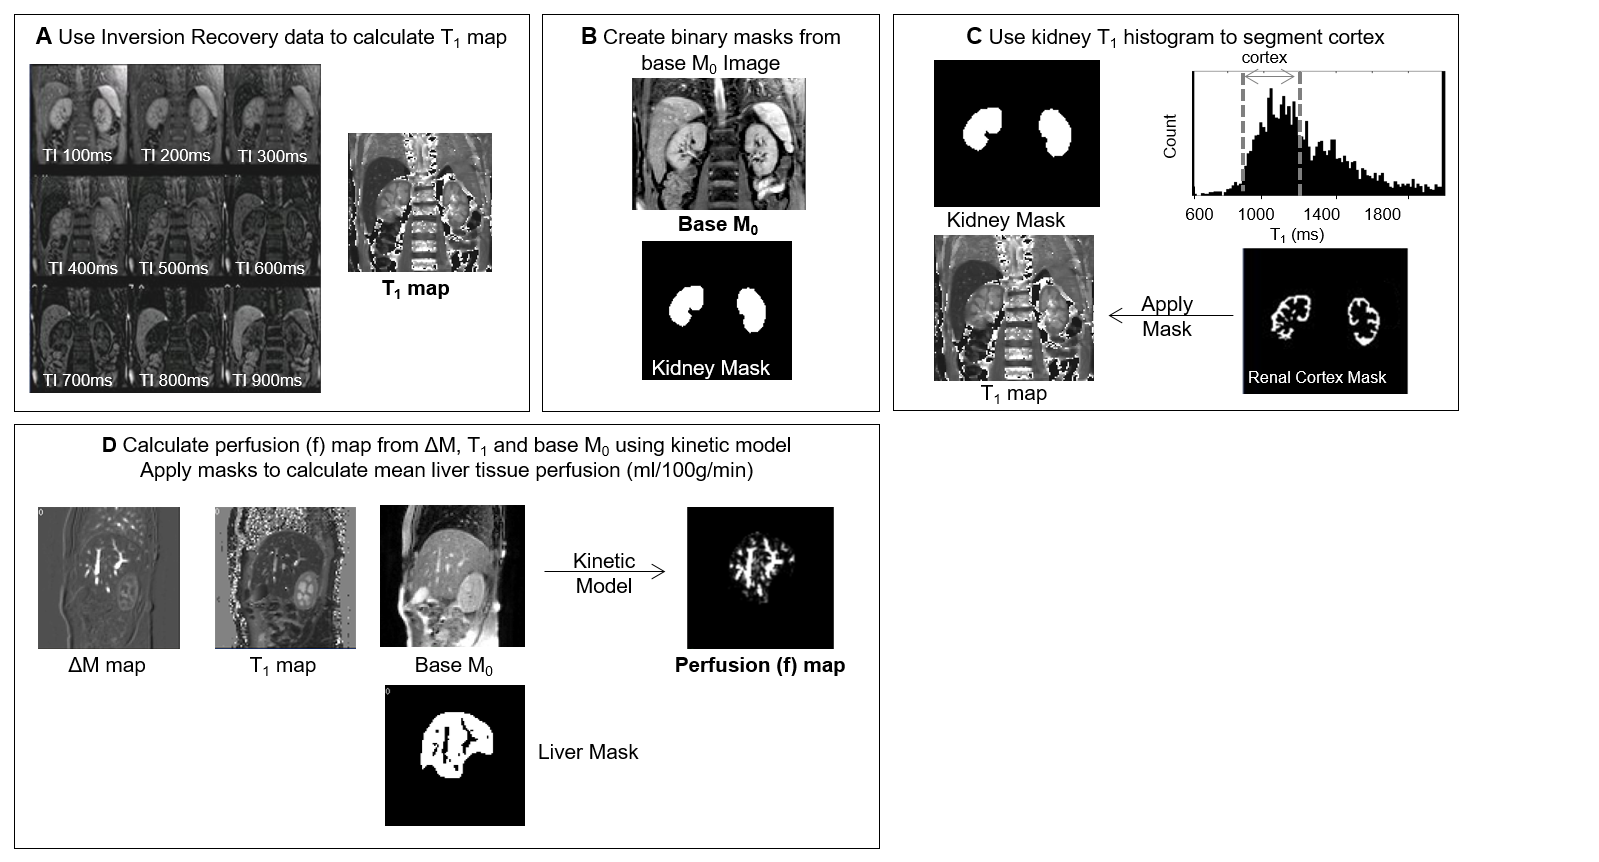
Structural assessment: Liver T1 maps were calculated from a modified respiratory-triggered fat suppressed SE-EPI inversion-recovery scheme (13 inversion times (TI), 100-1500 ms, 100 ms steps, acquisition time of ~2 minutes) and fit to generate T1 and M0 maps1. Median (SD) T1 values were calculated within liver masks excluding vessels (Fig.1). Renal T1 maps2 were formed using a modified respiratory-triggered inversion-recovery sequence with bFFE readout (9 TI’s (100-900 ms, 100 ms steps), temporal slice spacing (144 ms), ascend/descend slice order acquisition to increase the dynamic range of inversion times, acquisition time ~3 minutes (Fig.1). A histogram of T1 values within a binary kidney mask was created and the median T1 of renal cortex and medulla determined1. In addition, liver and kidney volume was estimated from bTFE localiser scans.
Haemodynamic assessment: Liver and kidney perfusion was measured using a respiratory-triggered flow alternating inversion recovery (FAIR) arterial spin labeling (ASL)2 (3 sagittal slices matched to T1 map, 60 pairs, TE/TR 1.2/2.4ms, SENSE 2, FA 60o, 3x3x8mm3 voxel, post-label delay (TI) 1100ms, in-plane pre-saturation) in ~8 minute acquisition. ASL label/control images were motion corrected to the base magnetisation M0 image. Individual perfusion weighted images (control-label) were calculated, inspected for motion (exclude >1 voxel movement) and averaged to create a single perfusion-weighted image (ΔM). ΔM, M0 and T1 maps were used in a kinetic model to compute perfusion maps (Fig.1). In addition, vessel flow (flux and velocity) was assessed using phase contrast (PC)-MRI with 15 phases across the cardiac cycle (TR/TE 6.9/3.7 ms, FA 25o, NEX 2, reconstructed resolution 1.17x1.17x6 mm3, TFE factor 4-6) with VENC (cm/s) = 100/50 for the hepatic artery (HA)/portal vein (PV).
Results
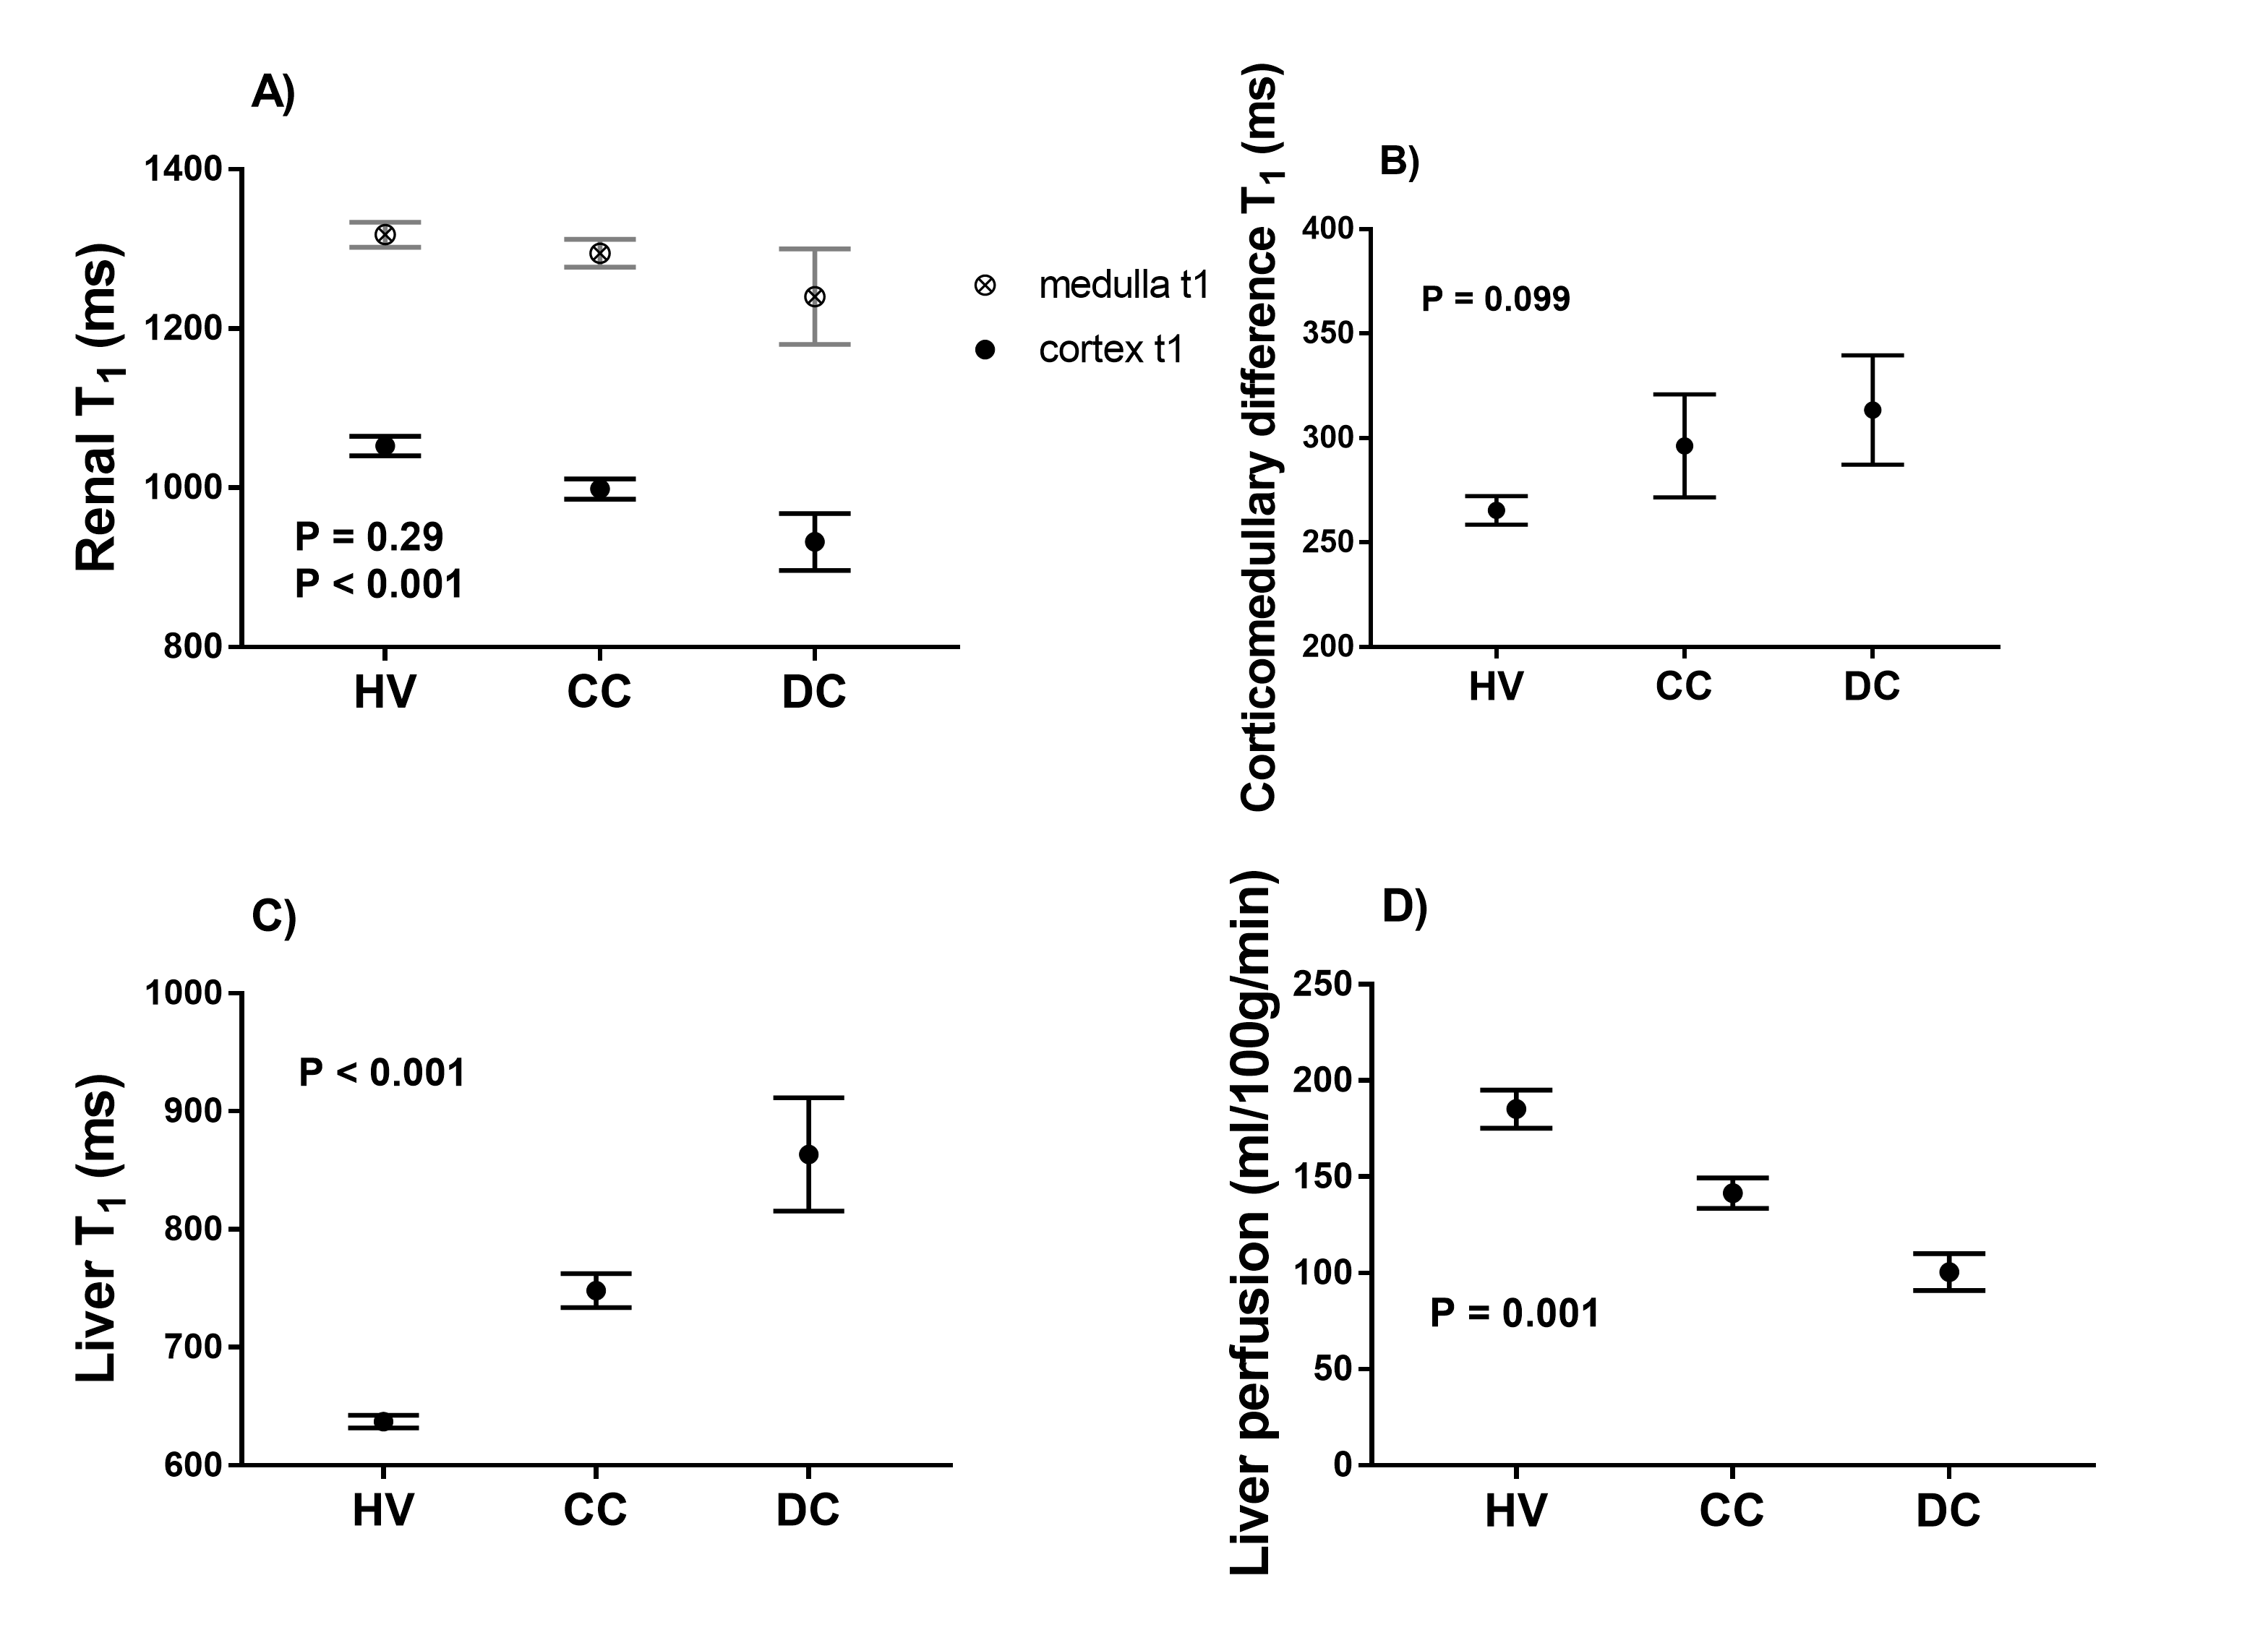
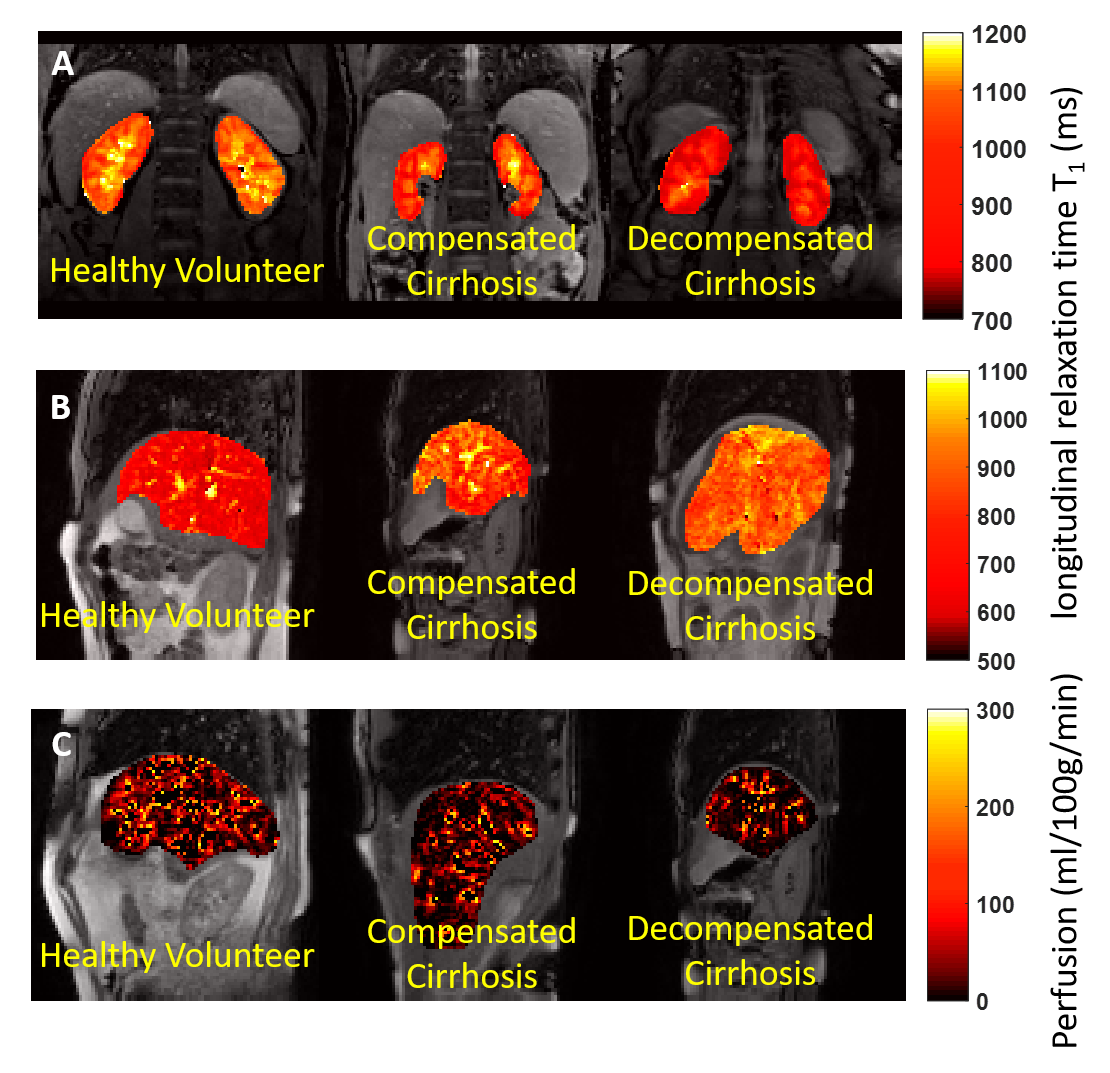
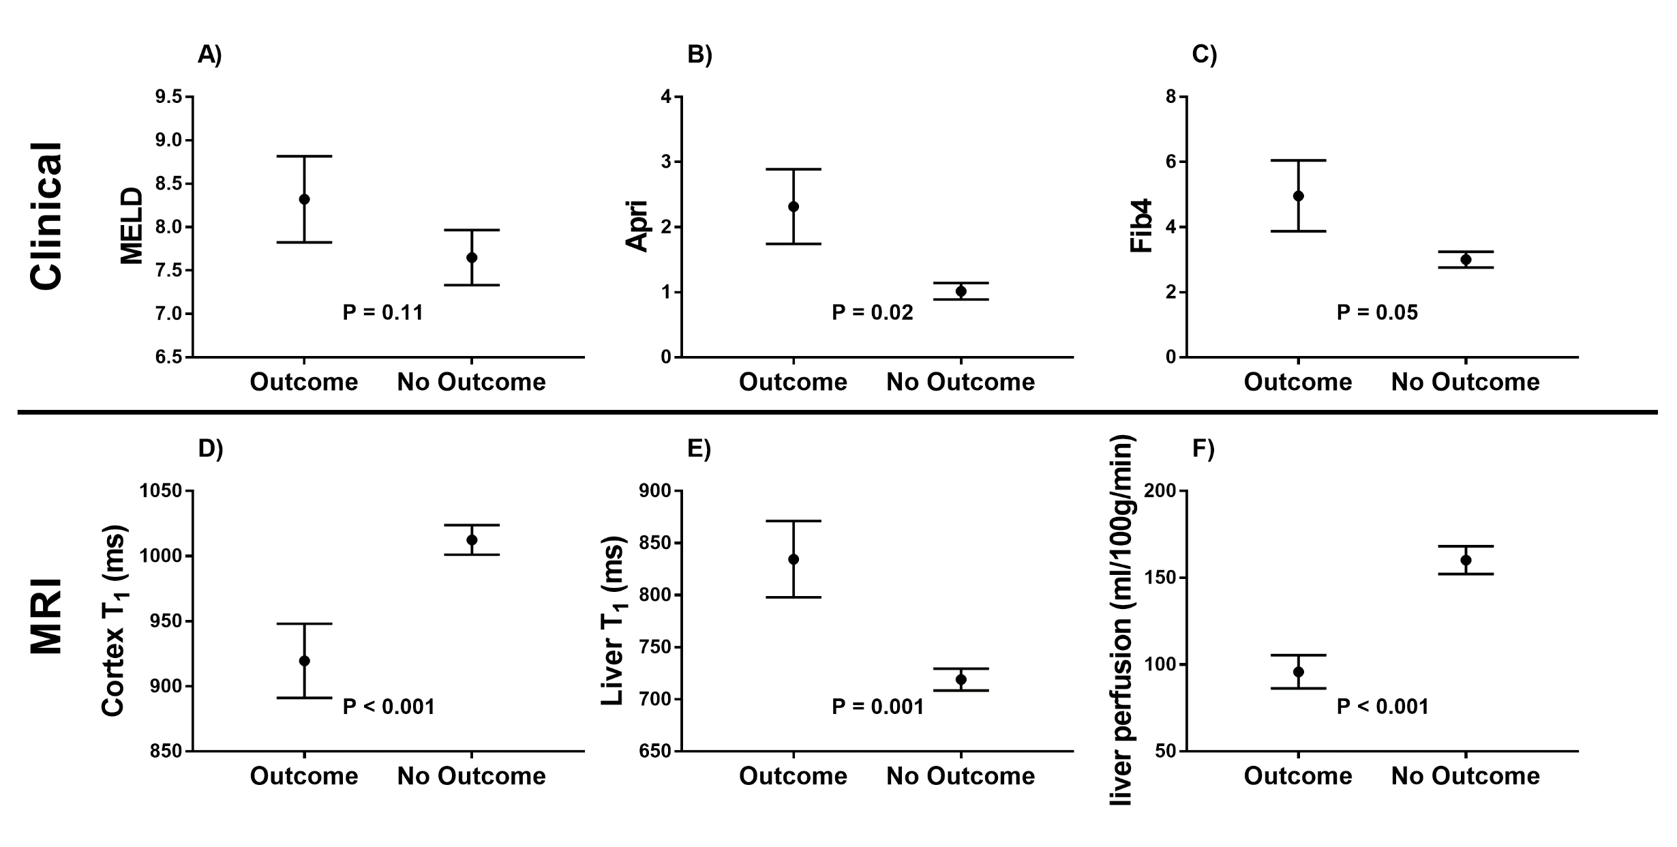
There was a significant reduction in both renal cortex and medulla T1 with increasing disease severity (Fig.2A) and an increase in corticomedullary differentiation (Fig.2B), despite no significant difference in eGFR. Liver T1 significantly increased with disease severity (Fig. 2C), whilst liver perfusion decreased (Fig. 2D). Figure 3 shows example maps for the HV, CC, and DC groups. To date, 11 of the CC patients have had a LRO (9 decompensation, 2 hepatocellular carcinoma (HCC)) with the mean time from baseline scan to LRO of 985 ± 698 days. Figure 4 shows clinical and MRI data for the CC group divided into those patients with and those patients without outcomes. MRI data shows a significant reduction in renal T1, increase in liver T1 and reduction in liver perfusion in those patients who subsequently went on to have a LRO. These changes align with validated measures of liver function (MELD) and fibrosis (APRI and FIB4).Discussion
We show that not only liver T1, but liver perfusion and renal cortex T1, provide clear indicators to delineate severity of liver disease. The increase in liver T1 and reduction of liver perfusion is consistent with our understanding of the progression of liver disease. Previous studies have reported changes in renal T1-weighted image contrast in CC patients compared to healthy volunteers3,4, but no measured values of T1 have to-date been reported. This observed reduction in renal T1 is likely to relate to a flow-related reduction to the kidneys (trend for a reduction in renal perfusion and blood flow with disease severity, but no significant change found). Focusing on the CC patients, we report significant differences in baseline liver T1 and perfusion, and renal cortex T1 in those achieving a LRO compared to those remaining in the compensated state.Conclusion
Renal cortex T1, liver T1 and liver perfusion alter with disease progression and provide an indication of future liver related outcomes.Acknowledgements
Financial support from NIHR Nottingham Biomedical Research Centre, Nottingham University Hospitals NHS Trust and University of Nottingham.References
1.) A study of T1 relaxation time as a measure of liver fibrosis and the influence of confounding histological factors. Hoad CL, Palaniyappan N, Kaye P, Chernova Y, James MW, Costigan C, Austin A, Marciani L, Gowland PA, Guha IN, Francis ST, Aithal GP. NMR Biomed. 2015 Jun;28(6):706-14.
2.) Multiparametric Renal Magnetic Resonance Imaging: Validation, Interventions, and Alterations in Chronic Kidney Disease. Cox EF, Buchanan CE, Bradley CR, Prestwich B, Mahmoud H, Taal M, Selby NM, Francis ST. Front Physiol. 2017 Sep 14;8:696.
3.) Corticomedullary differentiation on T1-Weighted MRI: comparison between cirrhotic and noncirrhotic patients. Lee KS, Muñoz A, Báez AB, Ngo L, Rofsky NM, Pedrosa I. J Magn Reson Imaging. 2012 Mar;35(3):644-9.
4.) Pseudonormal Corticomedullary Differentiation of the Kidney Assessed on T1-weighted Imaging for Chronic Kidney Disease Patients with Cirrhosis. Yamada F, Amano Y, Hidaka F, Fukushima Y, Kumita S. Magn Reson Med Sci. 2015;14(3):165-71.
Figures