4735
Cross-validation of Multi-parametric MRI in Characterizing Steatosis, Inflammation, and Fibrosis in Nonalcoholic Steatohepatitis (NASH) and Alcohol Hepatitis (AH) Mouse Models1Radiology, Mayo clinic, Rochester, MN, United States, 2Gastroenterology and Hepatology, Mayo clinic, Rochester, MN, United States
Synopsis
In this preliminary study, we cross-validated the usefulness of multi-parametric MRI (fat fraction, liver stiffness, and damping ratio) in assessing the disease development and treatment response in both NASH and AH mouse models. Fat fraction has excellent agreement with the steatosis changes in both progressive and regressive AH and NASH models. In AH models, hepatic inflammation indicators have shown promising trends that well agreed each other in ALT and damping ratio. For the NASH model, both liver stiffness and damping ratio increased progressively in the fast-food-diet group, and the changes of stiffness was consistent with the end-point histology of fibrosis.
Introduction
Liver stiffness measured from MR elastography (MRE) has emerged as the most reliable method for detecting and staging liver fibrosis in patients with chronic liver diseases [1-2]. Another MRE-assessed parameter, damping ratio, has recently shown to be able to distinguish inflammation from fibrosis in preclinical models [3]. Together with the MRI-assessed fat fraction, MRE-assessed stiffness and damping ratio have shown great potential in predicting nonalcoholic fatty liver disease activity score (NAS) in both preclinical and clinical subjects [4]. Given nonalcoholic steatohepatitis (NASH) and alcohol hepatitis (AH) are extremely similar in the pathological findings, in this preliminary study, we will further cross-validate the usefulness of multi-parametric MRI (including fat fraction, stiffness, and damping ratio) in assessing the disease development and treatment response in both NASH and AH mouse models.Methods
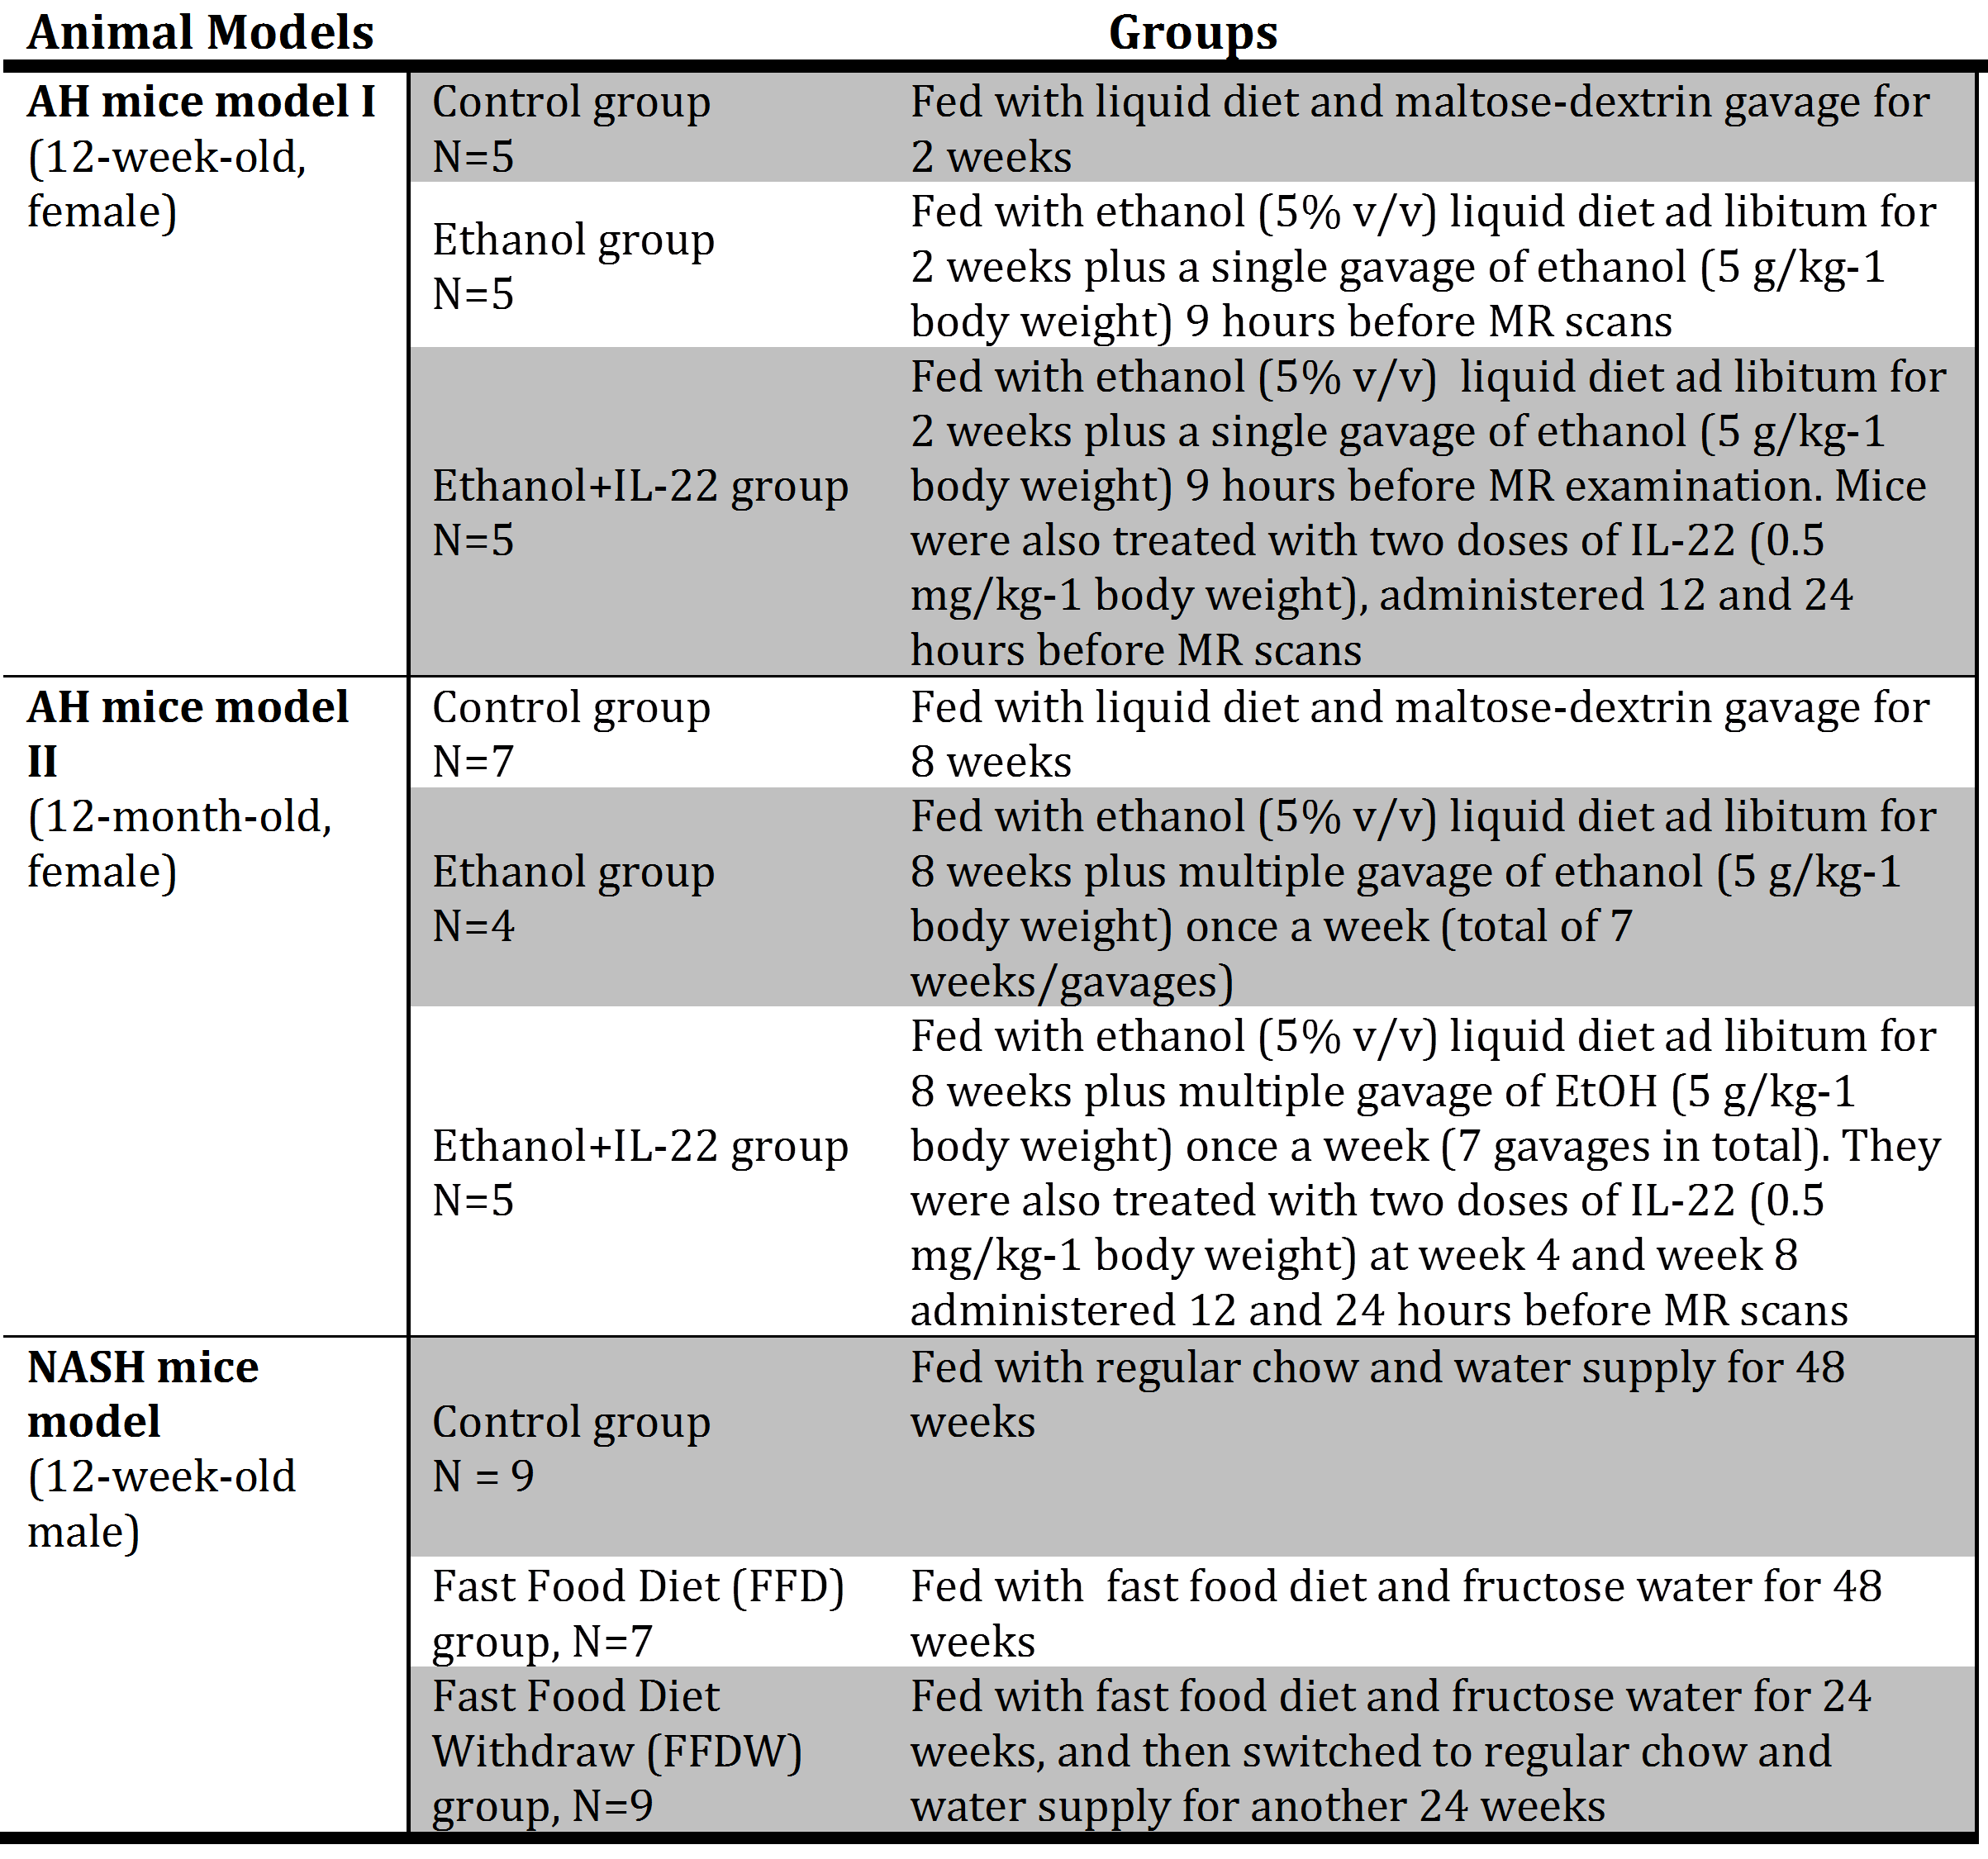
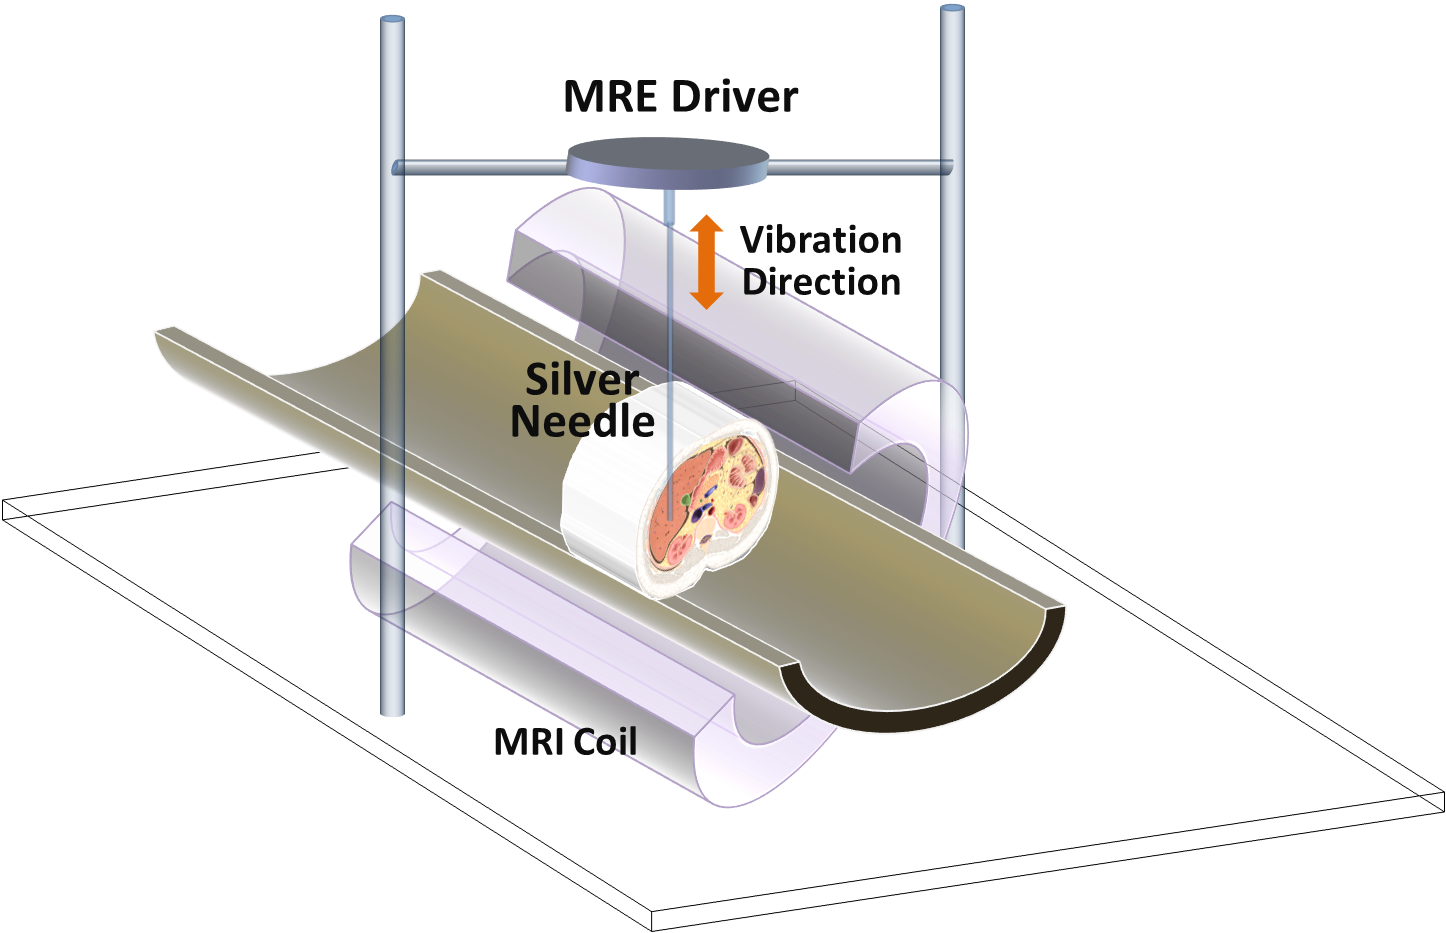
All animal studies were reviewed and approved by our institutional animal care and use committee (IACUC). Details of AH and NASH mouse models are described in Tab.1. Longitudinal multi-frequency 3D MRE (80-200Hz) and 2-point Dixon imaging were performed on all mice in vivo on a 3T whole-body MR scanner [3]. The experimental setup for mouse liver MRE is shown in Fig.1. Complete histologic analyses have been obtained at the end-point after euthanasia. In the AH mouse models, liver triglyceride (TG) content, serum alanine aminotransferase (ALT), and tissue alpha smooth muscle actin (αSMA) mRNA measurement were used as surrogate measures representing steatosis, inflammation, and fibrosis, respectively. In the NASH mouse model, steatosis grade, lobular inflammation, and fibrosis stage were determined by histology. For all animal experiments, MRE gave an output of complex shear modulus, from which one can derive liver stiffness, storage modulus, loss modulus, and damping ratio at multiple mechanical frequencies. Fat fraction was calculated with a 2-point Dixon method. Pairwise comparisons were performed for the mean values of liver stiffness, damping ratio, and fat fraction among different groups. A significance level of 0.05 was used.Results
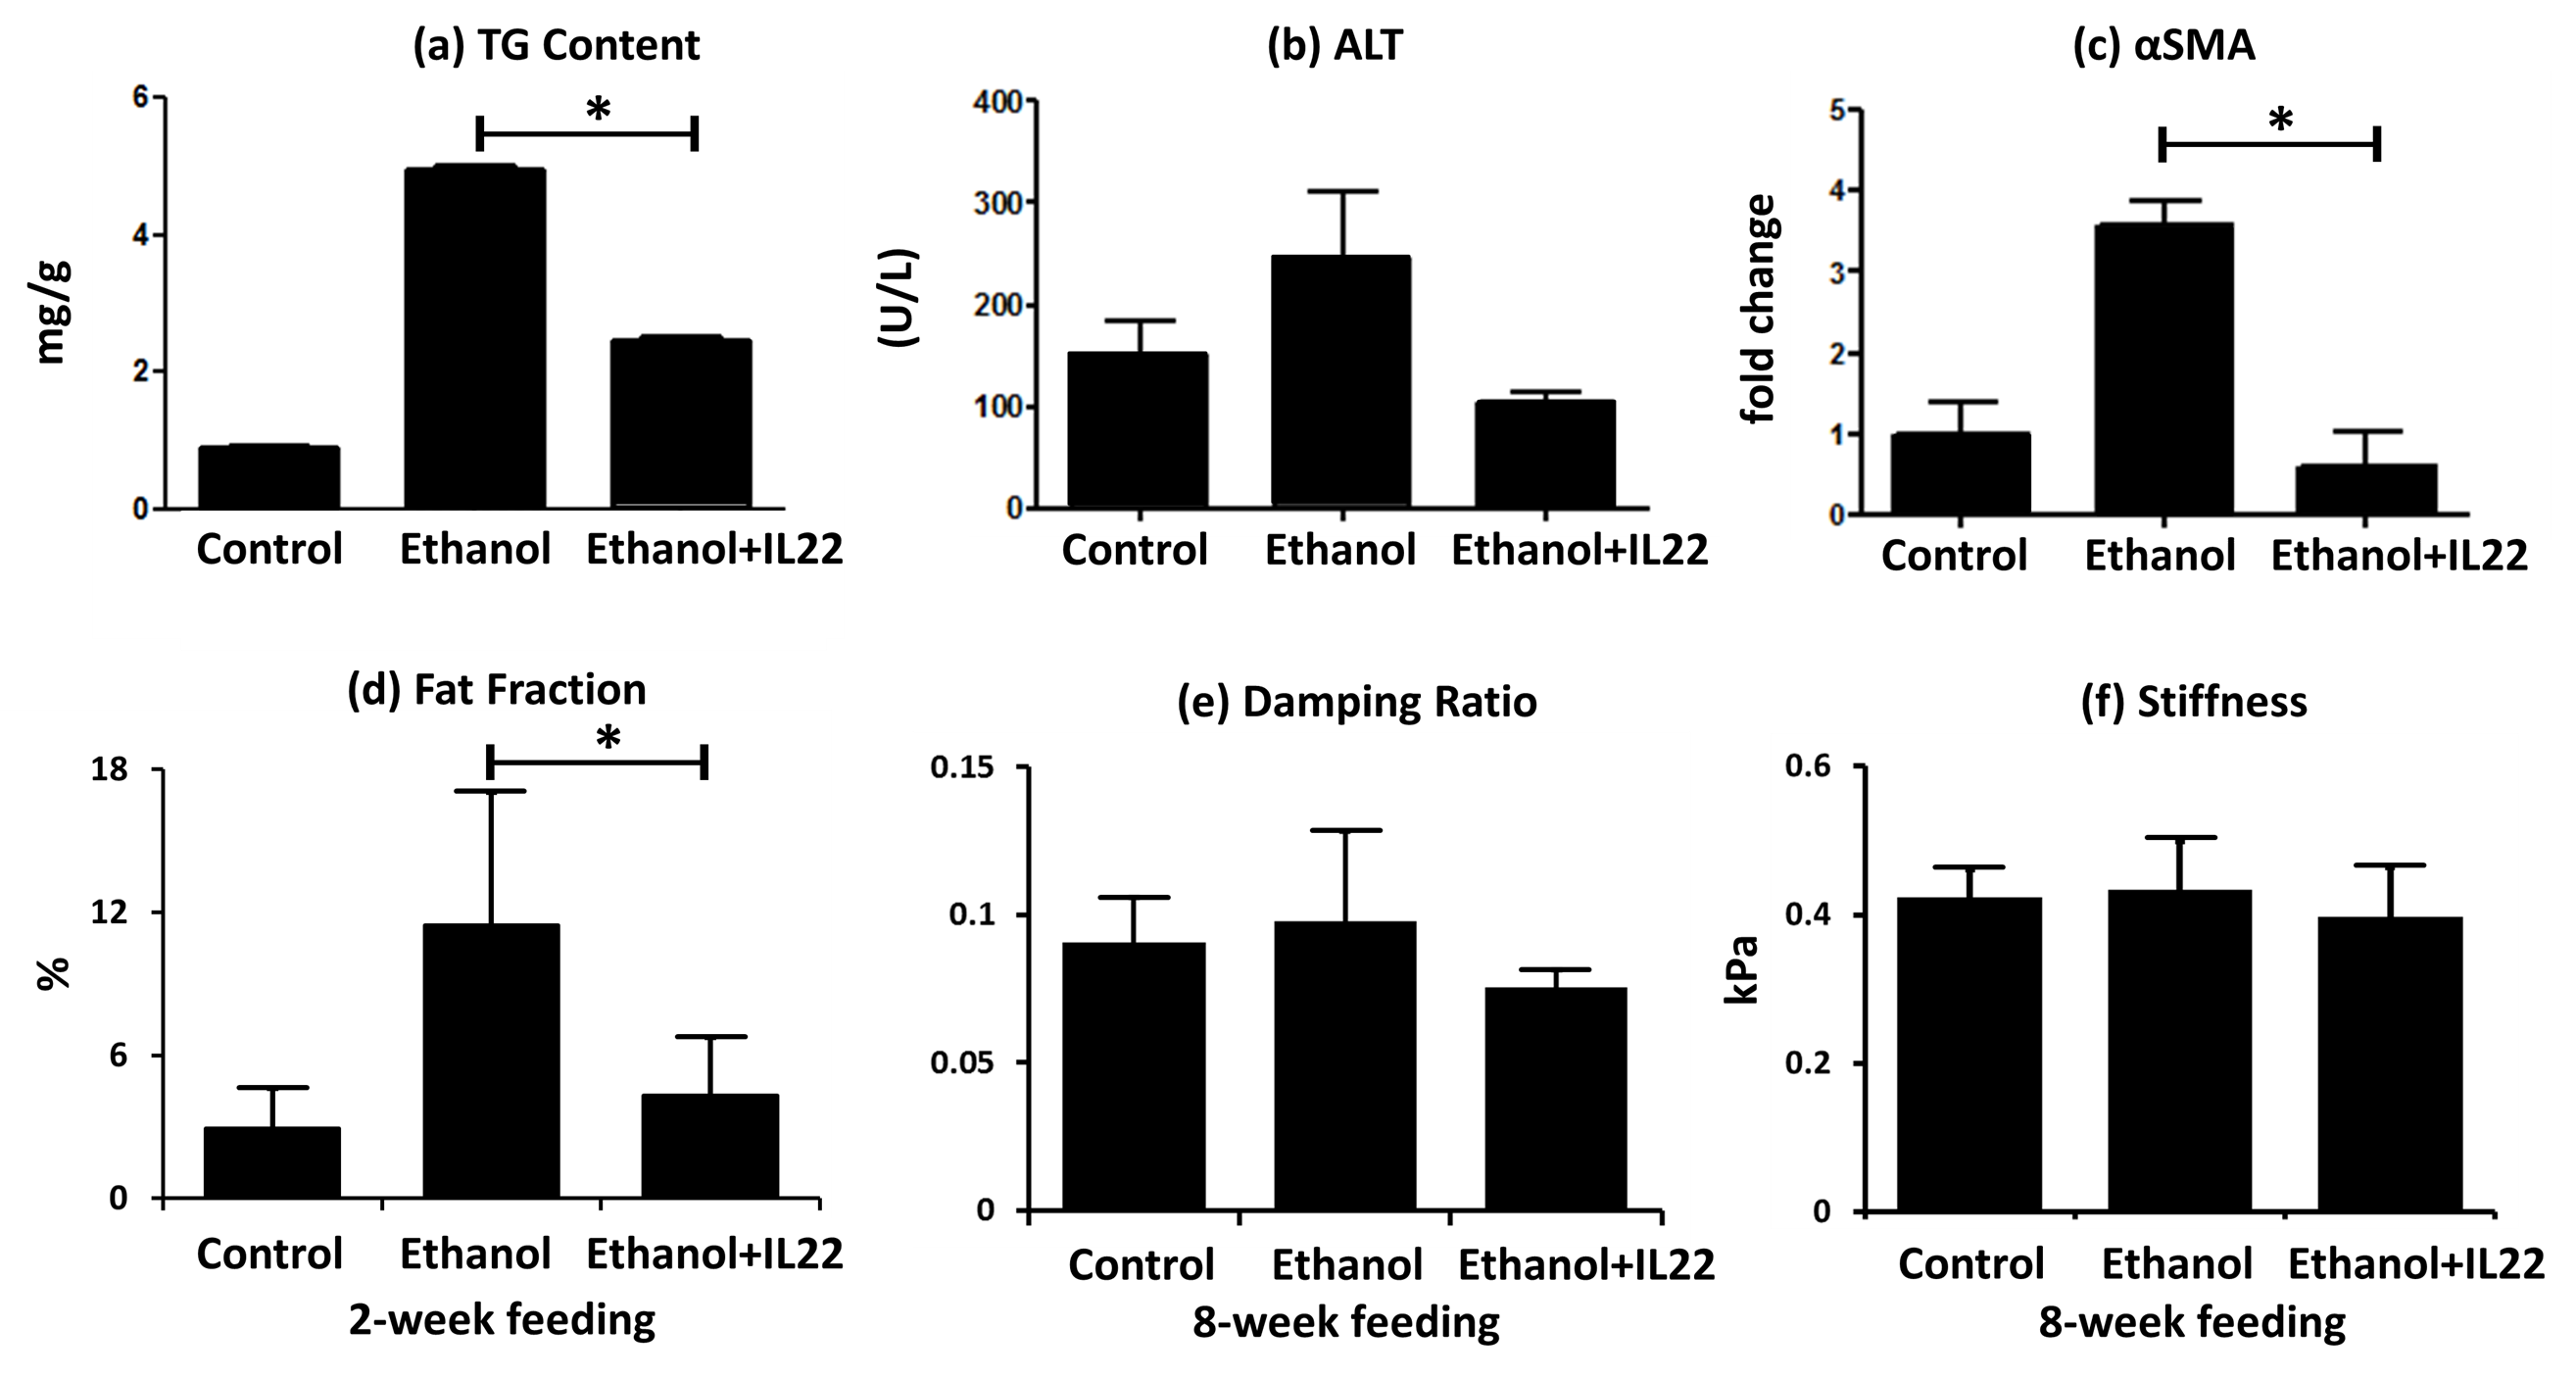
Fig.2 shows the end-point multi-parametric MRI results and histologic analyses for AH mouse models. As demonstrated in Fig.2a, mice with ethanol feeding developed substantial steatosis compared with the control group within 2 weeks, and IL-22 administration successfully mitigated liver TG content at this early stage. With the sustained ethanol feeding plus weekly binges, elevated inflammation (Fig.2b) and increased fibrosis markers (aSMA) were detected at week 8, which significantly decreased with IL-22 treatment in aSMA (Fig.2c). MR-assessed fat fraction (Fig.2d) and damping ratio (Fig.2e) show corresponding changes to the histologic features. However, liver stiffness did not shown identical trends of parameter changes in Fig.2f as that of αSMA.
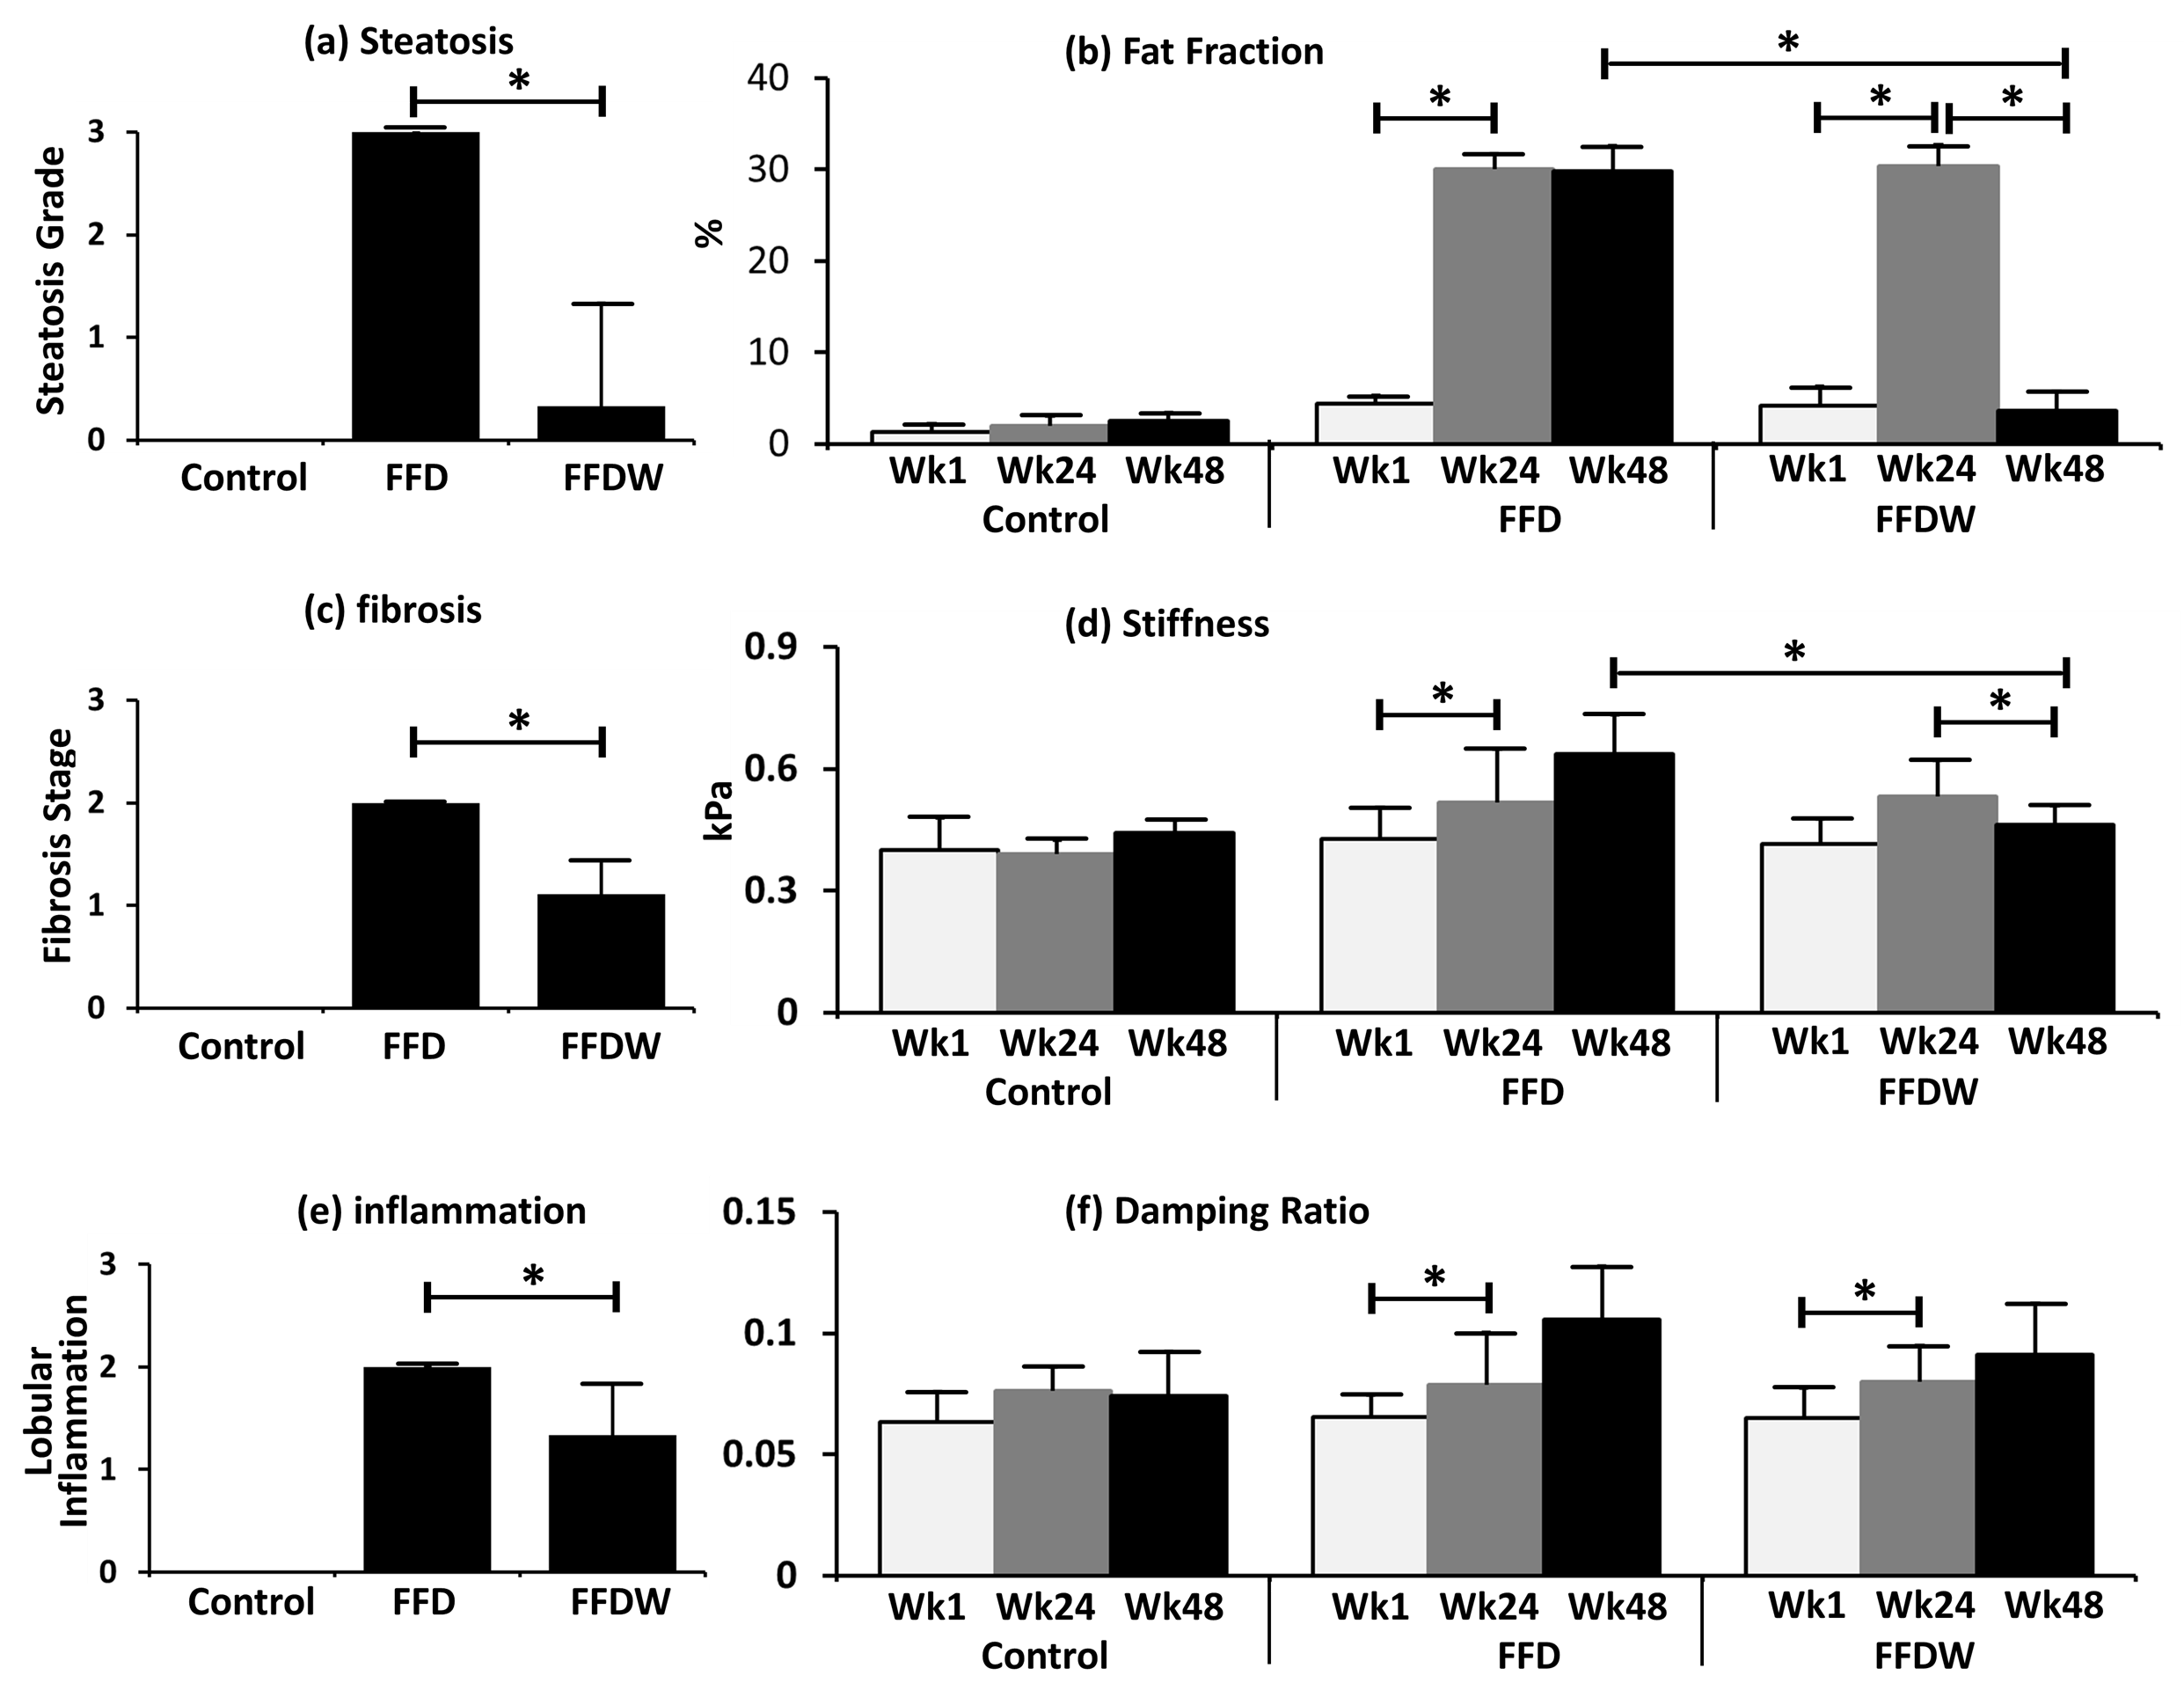
For the NASH model, MR results show that fat fraction (Fig.3b) significantly increased at week 24 with a fast food diet (FFD), and then dropped back at week 48 in response to the fast food diet withdraw (FFDW). Both liver stiffness (Fig.3d) and damping ratio (Fig.3f) increased progressively in the FFD group over 48 weeks, while in the FFDW group only the stiffness was significantly decreased from week 24 to week 48. Compared to the histological results, fat fraction and liver stiffness agreed well with the end-point histology of steatosis (Fig.3a) and fibrosis (Fig.3c). The discordance was observed between damping ratio and inflammation (Fig.3e) in response to FFDW. All control animals had normal histologic findings.
Discussion and Conclusion:
Fat fraction has excellent agreement with the steatosis changes in both progressive and regressive AH and NASH mouse models. Though αSMA decreased significantly after IL-22 treatment in the AH mouse model, this seems not yet translate to liver stiffness, which is considered more sensitive to structural changes of fibrosis rather than only hepatic stellate cells activation that is reflected by αSMA. Limited fibrosis in response to the ethanol feeding may also be a limitation to these preliminary studies. The discordance observed in the damping ratio and inflammation response to FFDW in the NASH model may be due to the different mechanisms behind the MRE signal and histology. Though WBC infiltration seen on histology was significantly reduced, the interstitial fluid volume/pressure may still remain high, which could be depicted as high values of damping ratio. In summary, MRE-assessed liver stiffness and damping ratio and MRI-assessed fat fraction have shown promising results for the characterization of hepatic steatosis, early inflammation, and fibrosis in these longitudinal studies. Actually, these three imaging predictors represent three biophysical events interactively associated with pathologic change. The ongoing study with increased number of animals and more rigorous experimental design may further elucidate the underlying mechanisms between MRE measurements and liver disease progression and regression.Acknowledgements
This research was funded by NIBIB grants EB017197 and EB001981.References
[1] Trout AT, Podberesky DJ, Dillman JR. Consensus on Elastography of the Liver. Radiology. 2016;278(1):303.
[2] Yin M, Glaser KJ, Talwalkar JA, Chen J, Manduca A, Ehman RL. Hepatic MR Elastography: Clinical Performance in a Series of 1377 Consecutive Examinations. Radiology. 2016; 278(1): 114-24. PMCID: 4688072.
[3] Yin M, Glaser KJ, Manduca A, Mounajjed T, Malhi H, Simonetto DA, Wang R, Yang L, Mao SA, Glorioso JM, Elgilani FM, Ward CJ, Harris PC, Nyberg SL, Shah VH, Ehman RL. Distinguishing between Hepatic Inflammation and Fibrosis with MR Elastography. Radiology. 2017:160622.
[4] Yin M, Allen AM, Glaser KJ, Venkatesh SK, Mounajjed T, Shah V, and Ehman RL. Assessment of Nonalcoholic Fatty Liver Disease (NAFLD) Activity Score (NAS) with MR Elastography (MRE). Proceedings of ISMRM 2017.
Figures