4733
Differential diagnosis of hepatic iron contents in simple steatosis and nonalcoholic steatohepatitis using multiecho Dixon magnetic resonance imaging1Medical Convergence Research Center, Wonkwang University, Iksan, Republic of Korea, 2Radiology, Wonkwang University School of Medicine, Iksan, Republic of Korea
Synopsis
Non-invasive monitoring liver iron content (LIC) is critical for clinical management or effective therapeutic strategy of patients because the increment of iron accumulation within the liver may contribute to liver disease via the production of reactive oxygen species. Non-alcoholic fatty liver disease (NAFLD) is the most common liver disease in the United States and is reported to between 10% and 30%, with similar rates reported from Europe and Asia. However, it is difficult to distinguish the sub-groups in NAFLD, especially simple steatosis (SS) and non-alcoholic steatohepatitis (NASH), unless by liver biopsy. Therefore, it is important to monitor liver iron content (LIC) in NASH patients for clinical management or effective therapeutic strategy of patients.
Introduction: Monitoring liver iron content (LIC) in nonalcoholic fatty liver disease (NAFLD) is crucial for clinical management or effective therapeutic strategy. However, whether iron contributes to a more rapid disease progression in NASH is less understood. Therefore, the aim of this study was to evaluate the usefulness of T2* relaxometry-based LIC quantification at 3T MRI in the patients with NAFLD and to compare the LIC difference between biopsy-proven simple steatosis and NASH.
Subjects and Methods: Histopathologically-proven 32 subjects divided to three groups, consisting of 10 healthy controls (HC), 12 simple steatosis (SS) and 10 NASH. All MRI examinations were performed on a 3T MRI scanner (Achieva Philips Systems, Best, The Netherlands) with a 32-channel receiver body matrix coil. Liver images were obtained in transversal slice orientation through the center at the main portal vein origin. Images were acquired a single gradient echo sequence with 6 multiechoes and a short echo spacing (delta TE) of 0.7ms (TR= 5.8 msec, TE1, TE2, TE3, …, TE6 = 1, 1.7, 2.4, …, 5.2msec, flip angle= 3°, FOV= 375×306×200mm3, matrix size= 192×256, slice thickness= 2.5mm, voxel size= 3mm(FH), no. of slices= 70 and scan time= 12sec) within a single breath-hold.
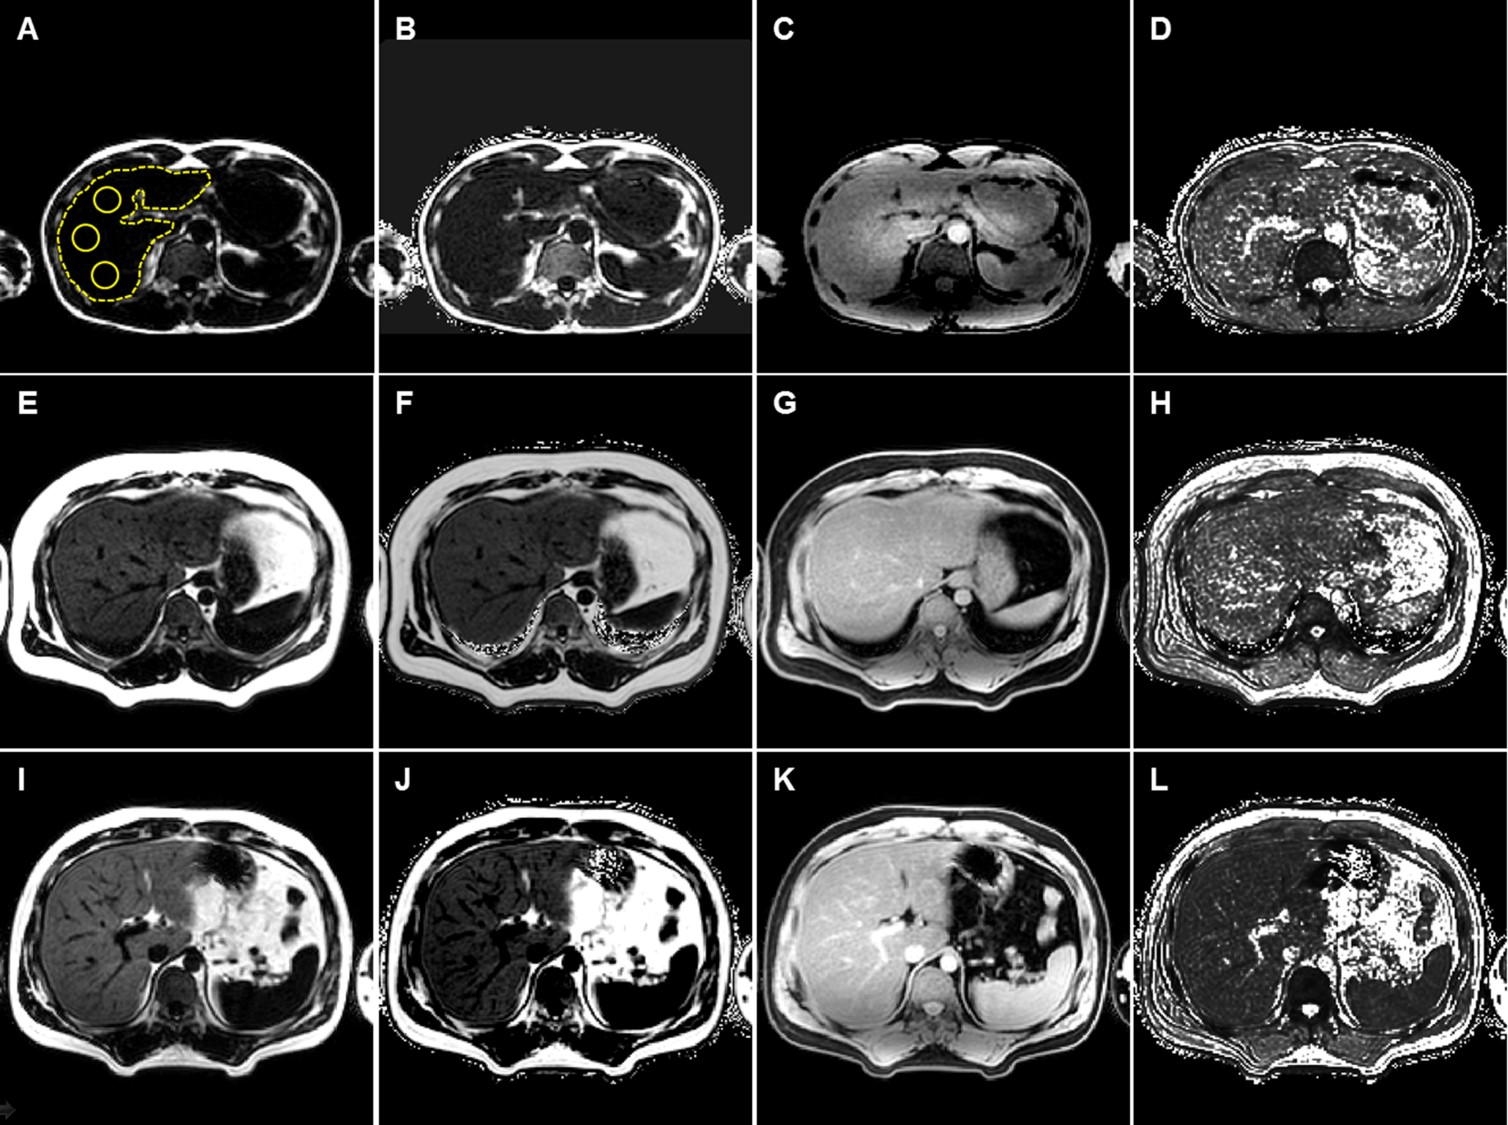
T2*-values were recorded on a pixel-by-pixel basis to a mono-exponential decay using a least-squares algorithm. For analysis of whole liver, free hand technique was used to draw region of interest (ROI) on liver parenchyma in every image. For localized ROI measurement, three different ROIs were drawn either on source images or T2* maps in a homogeneous area of the right hepatic lobe, avoiding blood vessels, obvious bile ducts, and artifacts. Finally, the R2*-values were calculated as the reciprocal of the mean T2*.
We used the following equation to convert the R2* obtained at 3T to R2* of 1.5T magnet field strength based on Storey et al. study: R2*(3T, 𝐶Fe) = 2R2*(1.5T, 𝐶Fe) − 𝑅d-d, (1) where 𝑅d-d denotes the relaxation due to diploe-dipole interaction, which was estimated to be 11±4 second−1 in the liver. Therefore, the following equation was used to obtain R2* of liver at 1.5T: R2*(3T, 𝐶Fe) = (R2*(1.5T, 𝐶Fe)+11)/2.0. (2) The LIC estimation at 3T was obtained using the relationship of 1.5T R2* and LIC based on the dry weight (dw) as described by Wood et al. study with the following equation: LICdw (in mg/gdw) = 0.0254×R2*(1.5T)+0.202. (3)
The LICs were compared among three independent groups using SPSS (ver.20). The variation in T2*-values was evaluated with Kruskal–Wallis one-way analysis of variance (ANOVA). Comparisons between two groups were analyzed by Mann–Whitney U-test with Bonferroni’s correction. To evaluate the diagnostic performance of T2*-value to differentiate between NASH and SS, receiver operating characteristics (ROC) curve analysis was performed to calculate the area under the ROC curve (AUROC), sensitivity, and specificity.
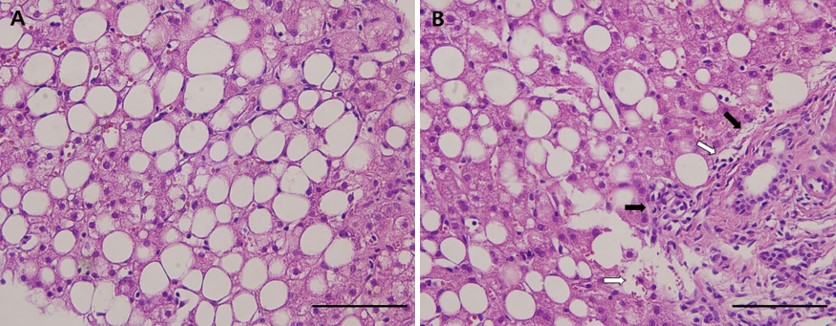
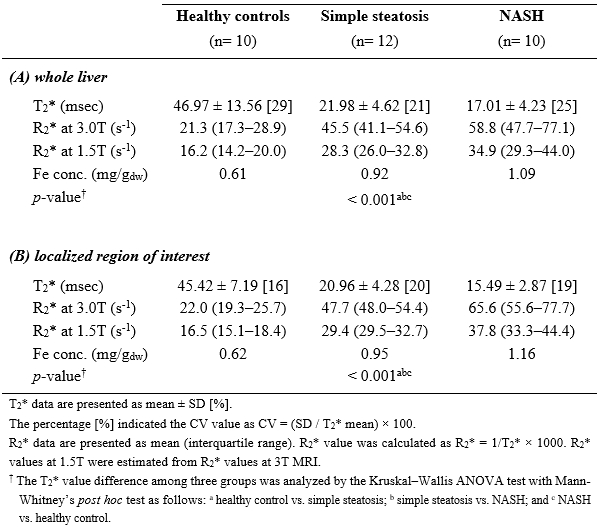
Results: Twenty-two patients were pathologically-proven from liver biopsy tissues and their representative histopathological features demonstrated in Fig. 1. Figure 2 shows the representative T2* images obtained from three different groups. Relaxivity T2*-values in the three groups were summarized in Table 1. Mean T2*-values at the whole liver were 46.97±13.56ms for HC, 21.98±4.62ms for SS and 17.01±4.23ms for NASH. At the localized ROIs, mean T2*-values were 45.42±7.19ms for HC, 20.96±4.28ms for SS and 15.49±2.87ms for NASH. Mean T2*-value in patients with NASH is shorter than that in patients with SS. There was significant difference between SS and NASH patient groups at the measurement of the whole liver (p=0.014) and at the localized ROI (p=0.001). Especially, the averaged LIC (whole liver 1.09 mg/gdw vs localized ROI 1.16 mg/gdw) in NASH are higher than those in SS (whole liver 0.92 mg/gdw vs localized ROI 0.95 mg/gdw) compared to a HC group (0.61-0.62 mg/gdw). Therefore, it might be reflected the changes of relaxivity, hepatic iron accumulation induced by hepatic inflammation.
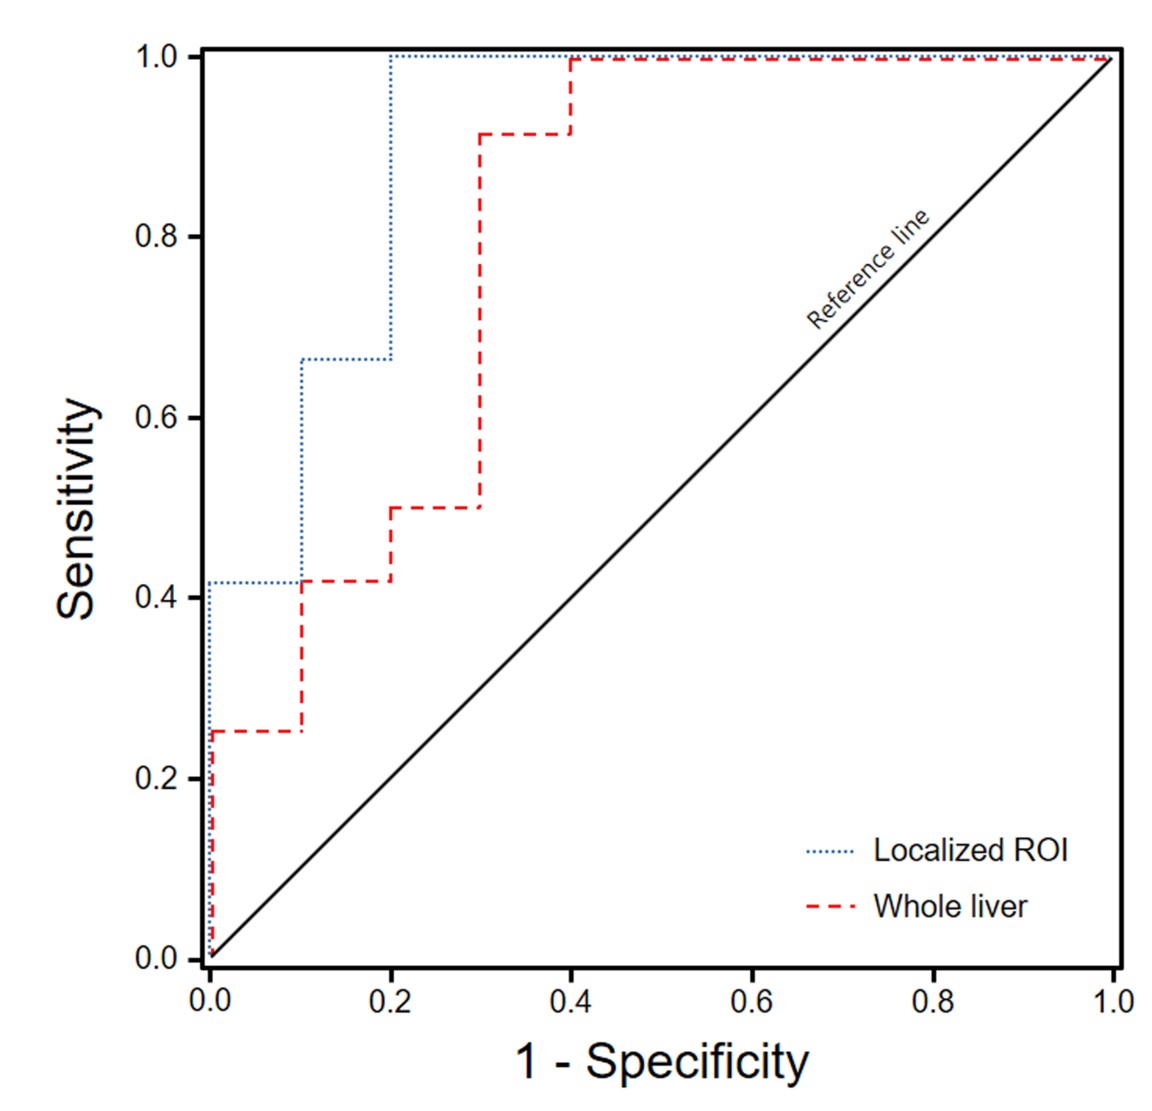
T2*-values at the whole liver ranged from 33.06–73.80 (mean 46.97ms) in the HC, from 17.38–32.47 (21.98ms) in the SS and from 12.28–24.90 (17.01ms) in the NASH, respectively. At the localized ROIs, T2* values ranged from 37.87–58.80 (mean 45.42ms) in the HC, from 17.38–30.99 (20.96ms) in the SS and from 11.28–19.90 (15.49ms) in the NASH. The AUROC was 0.808 (95% confident interval(CI) 0.608–1.000) for the measurement of whole liver (p= 0.015) and 0.908 (95%CI 0.775–1.000) for the localized ROI (p=0.001). Diagnostic accuracy had 0.750 sensitivity and 0.700 specificity at a cut-off value (>18.34ms) in the measurements of whole liver, 0.833 sensitivity and 0.800 specificity at a cut-off value (>17.95ms) in the localized ROI (Fig. 3).
Conclusion: This study demonstrates that the T2* calculation with multiecho Dixon MRI can help to diagnose NASH.
Acknowledgements
This study was supported by the grants of the Korean Health Technology R&D Project (HI12C0110, Ministry of Health & Welfare), and the National Research Foundation of Korea (NRF) (2016M3A9A7918499).References
1. Nelson JE, Wilson L, Brunt EM, et al. Relationship between the pattern of hepatic iron deposition and histological severity in nonalcoholic fatty liver disease. Hepatology. 2011;53:448-457.
2. Price L, Kowdley KV. The role of iron in the pathophysiology and treatment of chronic hepatitis C. Can J Gastroenterol. 2009;23:822-828.
3. Brunt EM. Pathology of hepatic iron overload. Semin Liver Dis. 2005;25:392-401.
4. Storey P, Thompson AA, Carqueville CL, et al. R2* imaging of transfusional iron burden at 3T and comparison with 1.5T. J Magn Reson Imaging. 2007;25:540-547.
5. Wood JC, Enriquez C, Ghugre N, et al. MRI R2 and R2* mapping accurately estimates hepatic iron concentration in transfusion-dependent thalassemia and sickle cell disease patients. Blood. 2005;106:1460-1465.
Figures