4732
MR elastography as a noninvasive marker for liver fibrosis in chronic hepatitis B patients: Comparisons with serum fibrosis markers1Radiology, Ajou University Hospital, Suwon, Republic of Korea, 2Internal Medicine, Ajou University Hospital, Suwon, Republic of Korea
Synopsis
Among various noninvasive methods for liver fibrosis quantification, we compared liver stiffness measured from MR elastography and multiple serum fibrosis markers including APRI, FIB-4, and King' score for liver fibrosis prediction. Our results showed than MR elastography performed better than serum fibrosis indices in discerning clinically significant fibrosis (≥ F3) and liver cirrhosis (≥ F4) in chronic hepatitis B patients.
Introduction
MR elastography has been highlighted as a robust noninvasive marker of liver fibrosis quantification in chronic hepatitis patients from various etiologies (1-3). For other methods of noninvasive liver fibrosis estimations, a variety of serologic markers have been developed and are in use in clinical practice (4-6). While prior studies have focused on validating the diagnostic power of MR elastography against the pathologic fibrosis grade, we set to compare its performance compared to clinical serum fibrosis indices.Methods
From February 2016 to September 2017, consecutive 113 chronic hepatitis B patients underwent MR elastography of four contiguous axial liver sections over four separate breath holds within a month of the curative surgery for liver neoplasm or liver biopsy. Of them, 86 patients were imaged by 2D GRE elastography on a 1.5 T (Signa HDxt; GE) unit and 26 were imaged with 3D SE elastography on a 3.0 T (Discovery 750 W; GE) unit using driver frequency of 60 Hz. Liver stiffness (LS) was measured within the areas bounded by 95% confidence map while avoiding large central vessels using a commercially available MR elastography software (MR Touch; GE) (7). The results of serologic tests within a week of the MR elastography were collected to acquire serum fibrosis markers. The mean liver stiffness and the values of serum fibrosis markers were compared with pathologic fibrosis grade reported according to METAVIR scoring system, and their diagnostic performances were analyzed.Results
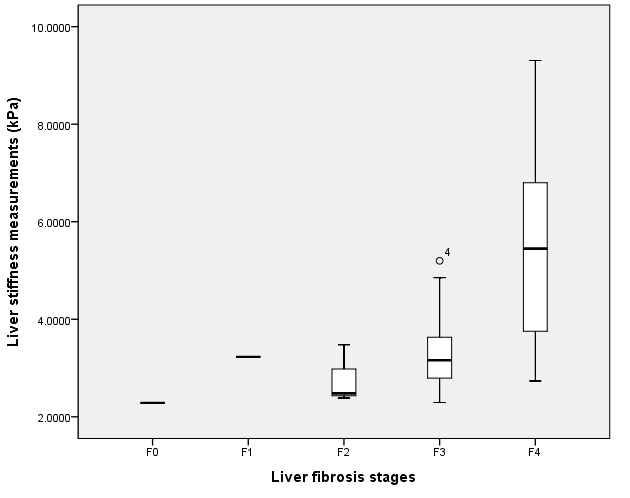
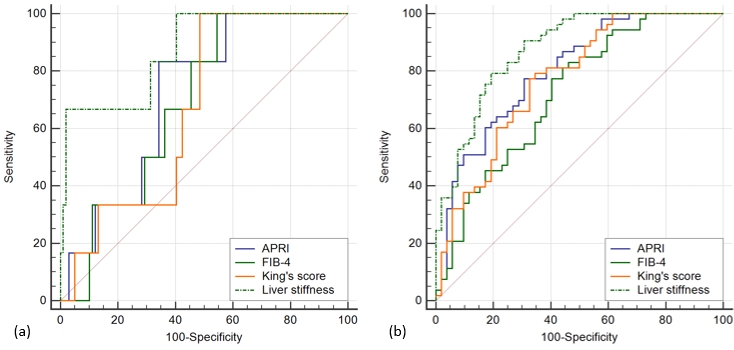
Six patients on 1.5 T and one patient on 3.0 T have failed to obtain valid MR elastography images, resulting in 93.8% success rate. Mean ± standard deviation for LS measurements were 2.29 kPa ± 0.24, 3.23 kPa ± 0.22, 2.71 kPa ± 0.51, 3.3 kPa ± 1.76, and 5.46 kPa ± 1.77 for F0, F1, F2, F3, and F4, respectively, with significant difference in stiffness among liver fibrosis stages on ANOVA (p < 0.001). Overall distribution of LS across different liver fibrosis stages is shown on Figure 1. Spearman correlation test revealed significant correlations between the LS and pathologic fibrosis stage, inflammatory activity grade, albumin, AST, ALT, rGT, total bilirubin, INR, platelet, AST to platelet index ratio (APRI), FIB-4, King’s score, and MELD score (all p < 0.01), with the highest correlation coefficient achieved in fibrosis stage followed by APRI (ρ = 0.661 and 0.599, respectively). Multiple regression analysis using enter method showed fibrosis stage, albumin, ALT, rGT, total bilirubin, and FIB-4 are independently correlated with LS after adjustment for covariates. ROC analysis showed optimal cutoff values of 2.48 kPa (sensitivity, 66.7%; specificity, 98%; AUC 0.87) to differentiate F0-2 from F3-4 and 3.54 kPa (sensitivity 75.5%; specificity, 83%; AUC 0.873) to differentiate F0-3 from F4. ROC comparisons using Delong method showed the highest AUC for measured liver stiffness than for APRI, FIB-4, and King’s score in differentiating F0-2 from F3-4 and F0-3 from F4 (Figure 2).Discussion and conclusion
Our results showed than liver stiffness measured from MR elastography performed better than serum fibrosis indices including APRI, FIB-4, and King’s score in discerning clinically significant fibrosis (≥ F3) and liver cirrhosis (≥ F4) in chronic hepatitis B patients. Serum fibrosis indices were developed from a highly selected group of population that they often failed to distinguish milder fibrosis stages from cirrhosis in practice. In line with these observations, MR elastography had better diagnostic performance than serum fibrosis markers in predicting clinically significant liver fibrosis on current study.Acknowledgements
No acknowledgement found.References
1. Yoshimitsu K, Mitsufuji T, Shinagawa Y, Fujimitsu R, Morita A, Urakawa H, et al. MR elastography of the liver at 3.0 T in diagnosing liver fibrosis grades; preliminary clinical experience. Eur Radiol 2016;26:656-663
2. Yin M, Glaser KJ, Talwalkar JA, Chen J, Manduca A, Ehman RL. Hepatic MR Elastography: Clinical Performance in a Series of 1377 Consecutive Examinations. Radiology 2016;278:114-124
3. Chang W, Lee JM, Yoon JH, Han JK, Choi BI, Yoon JH, et al. Liver Fibrosis Staging with MR Elastography: Comparison of Diagnostic Performance between Patients with Chronic Hepatitis B and Those with Other Etiologic Causes. Radiology 2016;280:88-97
4. Wai CT, Greenson JK, Fontana RJ, Kalbfleisch JD, Marrero JA, Conjeevaram HS, et al. A simple noninvasive index can predict both significant fibrosis and cirrhosis in patients with chronic hepatitis C. Hepatology 2003;38:518-526
5. Sterling RK, Lissen E, Clumeck N, Sola R, Correa MC, Montaner J, et al. Development of a simple noninvasive index to predict significant fibrosis in patients with HIV/HCV coinfection. Hepatology 2006;43:1317-1325
6. Cross TJ, Rizzi P, Berry PA, Bruce M, Portmann B, Harrison PM. King's Score: an accurate marker of cirrhosis in chronic hepatitis C. Eur J Gastroenterol Hepatol 2009;21:730-738
7. Trout AT, Serai S, Mahley AD, Wang H, Zhang Y, Zhang B, et al. Liver Stiffness Measurements with MR Elastography: Agreement and Repeatability across Imaging Systems, Field Strengths, and Pulse Sequences. Radiology 2016;281:793-804
Figures