4728
Measuring hepatocyte transplant success using gadoxetate enhanced MRI1Radiology, Michigan State University, East Lansing, MI, United States, 2Institute for Quantitative Health Science and Engineering, Michigan State University, East Lansing, MI, United States
Synopsis
We used gadoxetate-enhanced MRI to monitor a mouse model of liver failure and hepatocyte transplantation.
Introduction
Hepatocyte transplantation is a potential treatment for metabolic diseases such as Crigler-Najjar or glycogen storage diseases,1 and may provide an alternative to whole or partial organ transplants in acute liver failure, but there is a need for a method to monitor engraftment success.2 We would like to use contrast-enhanced MRI using the hepatocyte specific contrast agent gadoxetate3 to monitor success of hepatocyte transplantation in vivo. Gadoxetate has not previously been used to monitor hepatocyte transplants.Methods
Mice used were TK-NOG mice (10-14 weeks). These mice have selective expression of herpes simplex virus thymidine kinase (HSVtk) on an albumin promoter, such that treatment with the prodrug ganciclovir causes selective apoptosis of hepatocytes.4 Mice were treated with 25 mg/kg ganciclovir on d-7 and d-5; on day 0, hepatocytes were isolated from donor mice with ubiquitous expression of GFP and 1×10⁶ cells were injected intrasplenically into the recipient mice. Mice were imaged on a Bruker 7T BioSpec USR 70/30 using a 4-cm volume transmit/receive coil, using the intragate T1 FLASH sequence. We scanned the mice at baseline, the day before surgery (d-1), and every two weeks following transplantation for 3 months; mice were injected with gadoxetate through a tail vein catheter at a clinical dose and images were acquired every 45s for 1 h. Images were analyzed by measuring the percent enhancement relative to baseline in liver and kidney (the two organs that excrete gadoxetate). Blood was collected at each imaging timepoint and serum ALT (liver damage) was measured. Tissues were collected at necropsy and sectioned for histological analysis.Results
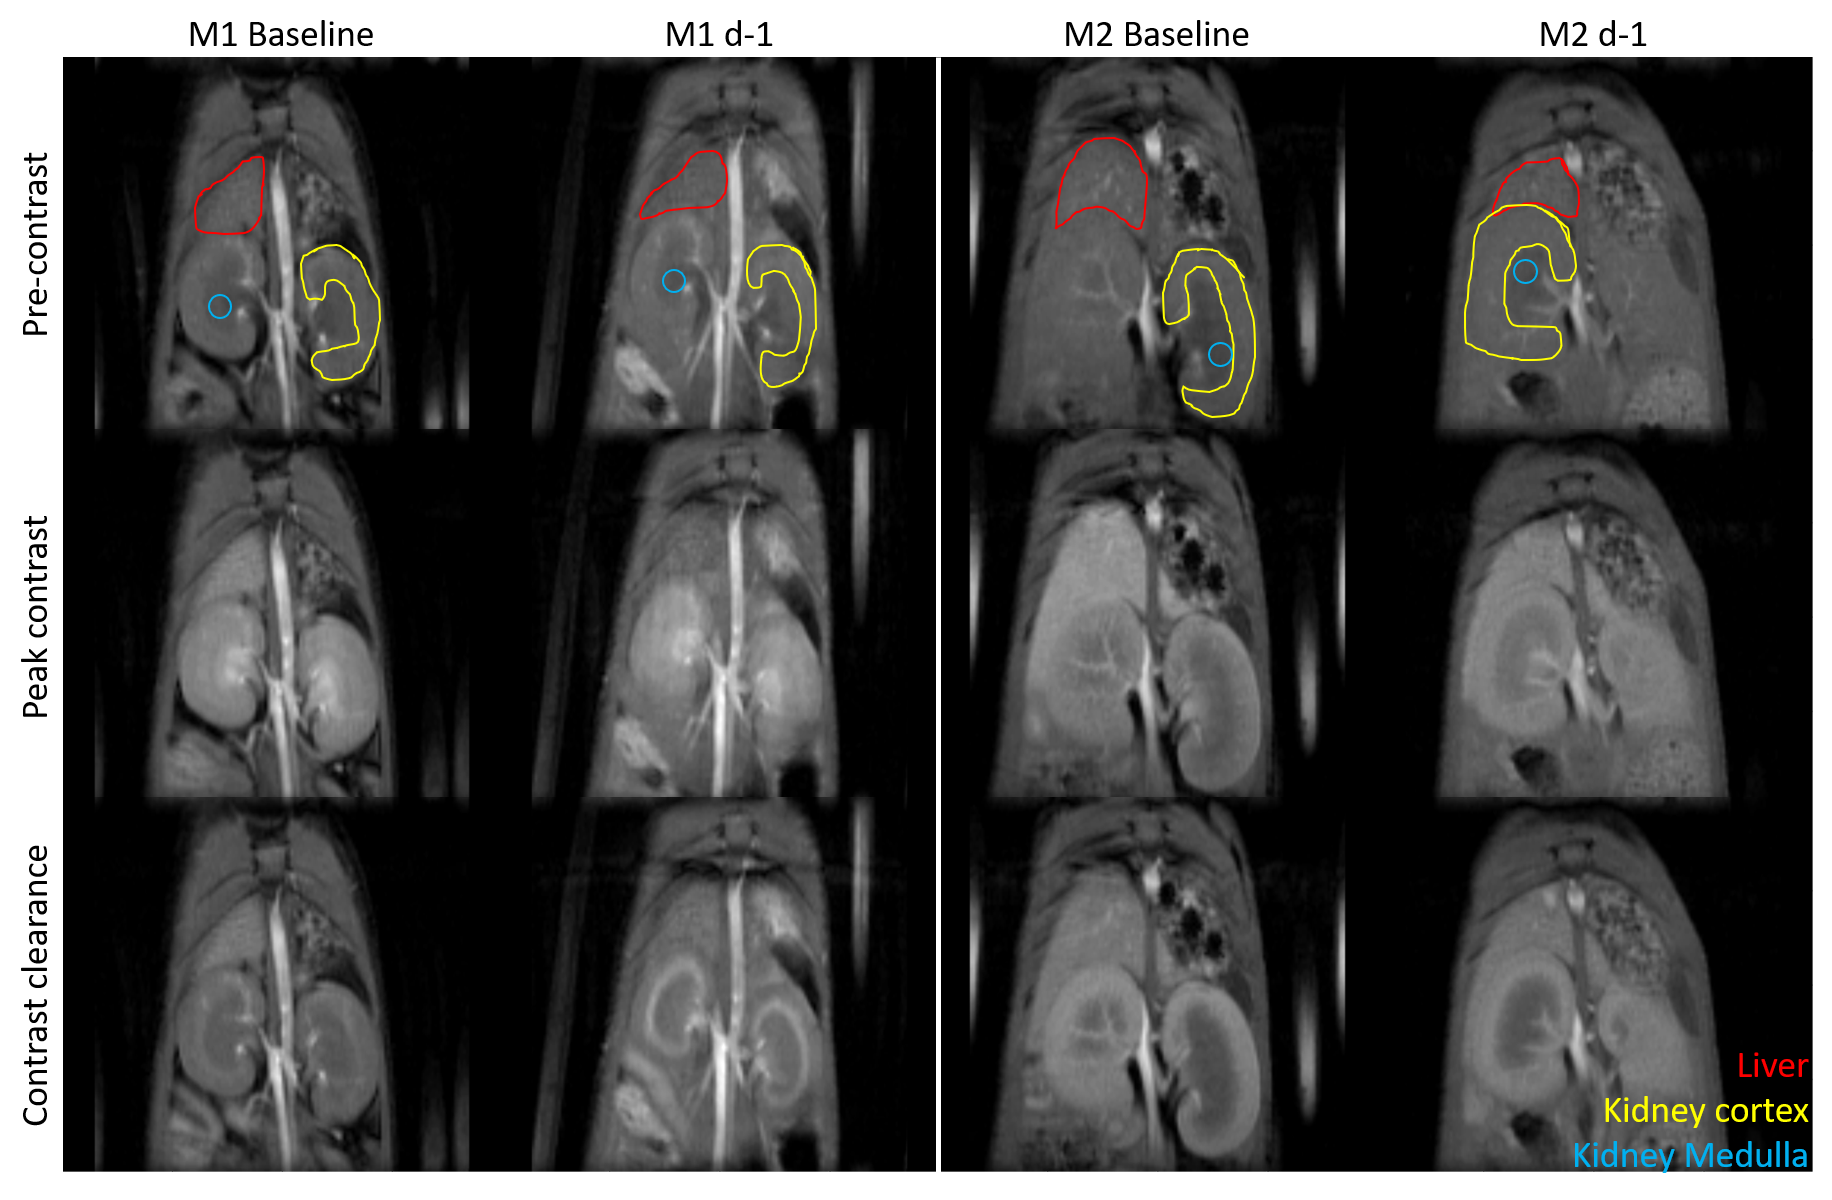
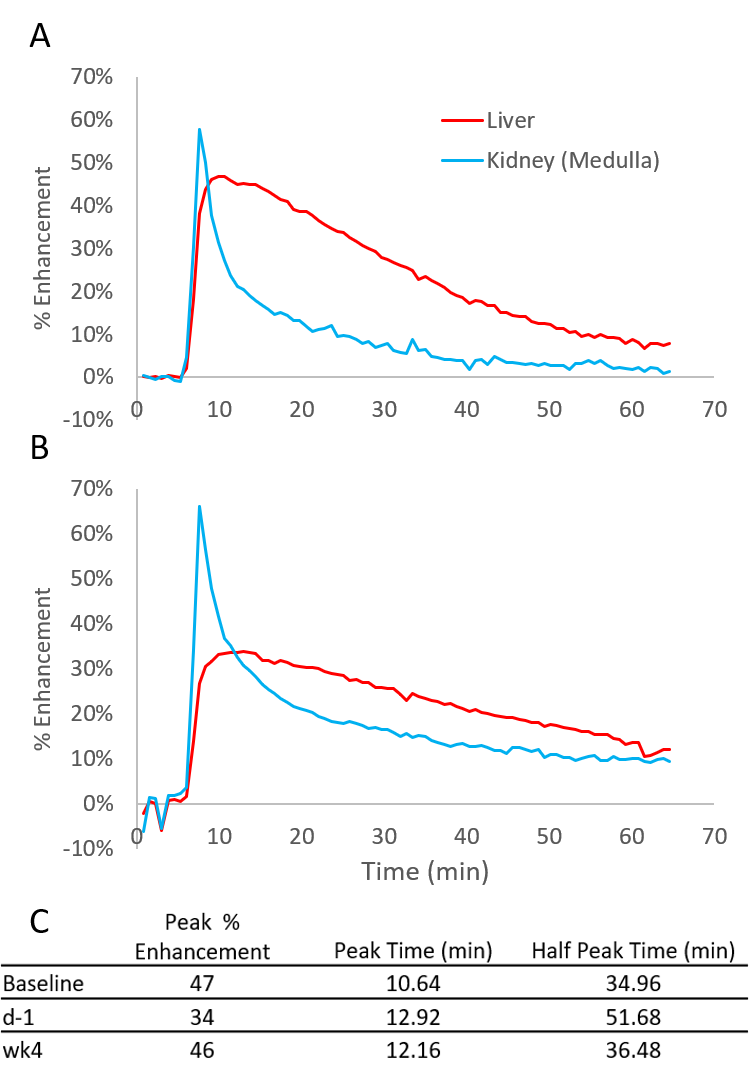
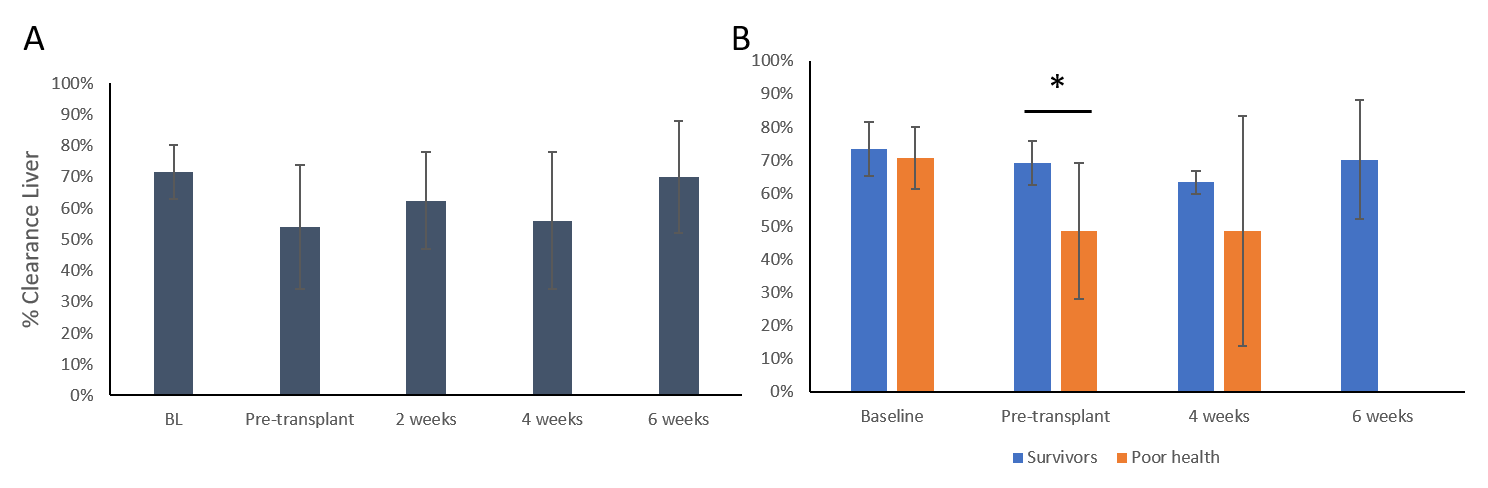
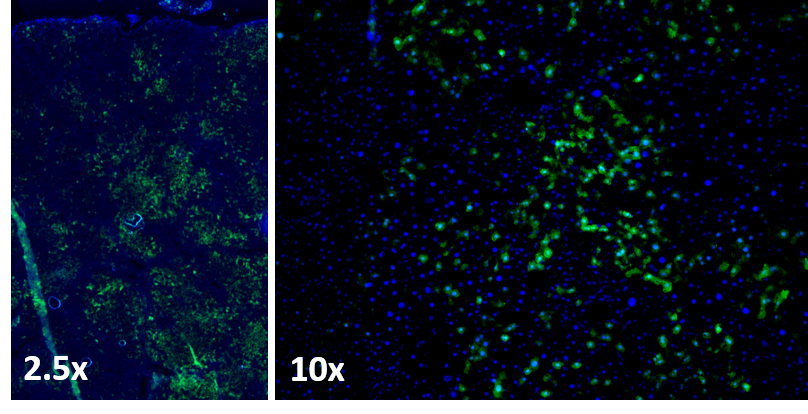
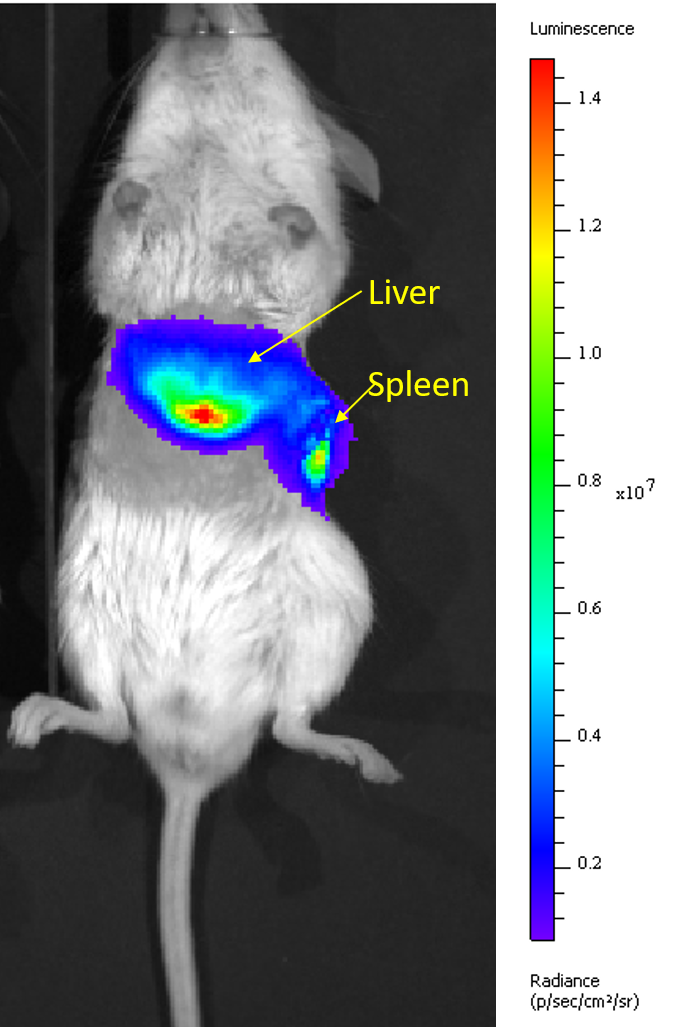
Figure 1 shows sample MRI images acquired during the DCE sequence. Both the liver and the kidneys enhance after injection of gadoxetate. Both mice show a similar enhancement in their pre-ganciclovir scan, but M1 has much less enhancement of the liver than M2 on the d-1 scan. This corresponded with post-surgical outcomes: M1 (female) died in the days following surgery and M2 (male) survived. Figure 2 shows aggregate curves for all mice at baseline and d-1 and some simple curve statistics. There is a decrease in the peak liver enhancement after ganciclovir treatment with corresponding increase in the kidney enhancement, and the time to clear the gadoxetate from the liver increases after ganciclovir damage. Both measures return to baseline 4 weeks after surgery. There is an important caveat, however, because many mice continue to decline after ganciclovir, too quickly for their livers to be repopulated by the donor hepatocytes. We calculated the area under the curve for the liver and kidney, and calculated the percent clearance through the liver. Figure 3 shows the percentage clearance through the liver with the mice all grouped together, and with surviving and poor health mice separated. There was a significant difference in liver clearance between the two groups of mice on d-1. Figure 4 shows sample histology from a mouse 12 weeks post-transplant, showing GFP+ cells in the liver. We have begun using GFP-Luciferase donor mice to allow for bioluminescence imaging of hepatocyte engraftment to compare with MRI (Figure 5).Discussion
Our goal is to use MRI to measure liver damage and recovery in a hepatocyte transplant model. In aggregate, liver uptake of gadoxetate decreases after ganciclovir dosing. We were able to distinguish mice that will survive long-term from mice that will not, based on the fraction of gadoxetate that clears through the liver. The liver clearance in surviving transplanted mice does not change with time. In the initial development of the TK-NOG model for hepatocyte transplant (using human hepatocytes), it took 4 weeks for transplanted cells to be detectable by their production of human albumin.4 We hypothesize that the mice that die after ganciclovir dosing are too sick, and are not able to wait 4 weeks until the donor hepatocytes start functioning; administering a lower dose of ganciclovir to female mice, which are more susceptible in our hands, may help with this. In the future, hepatocyte engraftment data from bioluminescence images will be correlated with MRI results. Differences in time to peak enhancement and excretion time were detectable with simple curve parameters; more advanced curve fitting and kinetic modeling may be able to tease out changes that correspond to hepatocyte engraftment.Acknowledgements
NIH R01 DK107697
MSU Investigative Histopathology Lab
Dr. Matti Kiupel, MSU Veterinary Diagnostic Laboratory
James Luyendyk, MSU Department of Pathobiology and Diagnostic Investigation
Xuefei Huang, MSU Department of Chemistry
References
1. Cantz, T., Sharma, A. D. & Ott, M. Concise Review: Cell Therapies for Hereditary Metabolic Liver Diseases—Concepts, Clinical Results, and Future Developments. Stem Cells 33, 1055–1062 (2015).
2. Hughes, R. D., Mitry, R. R. & Dhawan, A. Current Status of Hepatocyte Transplantation. Transplantation 93, 342–347 (2012).
3. Van Beers, B. E., Pastor, C. M. & Hussain, H. K. Primovist, Eovist: What to expect? Journal of Hepatology 57, 421–429 (2012).
4. Hasegawa, M. et al. The reconstituted ‘humanized liver’ in TK-NOG mice is mature and functional. Biochemical and Biophysical Research Communications 405, 405–410 (2011).
Figures