4727
Validation of gadoxetate dynamic contrast-enhanced MRI to assess liver function in rats with liver fibrosis: comparison with shear wave elastography and indocyanine green test1Radiology, Ulsan University Hospital, Ulsan, Republic of Korea, 2Asan Medical Center, Seoul, Republic of Korea, 3Gangneng Asan Medical Center, Gangneng, Republic of Korea
Synopsis
Non-invasive imaging evaluation of the liver fibrosis and liver function has been gaining emphasis currently. In preclinical trial with animal liver fibrosis model, the gadoxetate DCE-MRI is quite feasible to evaluate histopathologic liver fibrosis and physiologic liver function in a non-invasive and repeatable manner. The best MRI index would be the iAUC-15, which is better than kPa on SWE.
Introduction
The necessity to monitor the degree of liver fibrosis/function in a non-invasive and repeatable manner is increasing in the preclinical trial, as the drug development of anti-fibrotics has been increasing since last decades. Gadoxetate is a hepatocyte-specific contrast agent to enhance hepatocytes, which enables us to evaluate liver function using MRI (1). Currently, gadoxetate DCE-MRI in the clinical validation stage which evaluate whether gadoxetate DCE-MRI biomarkers can reflect pathologic process and clinical outcome and whether it can provide results in reproducible manner (2). However, gadoxetate DCE-MRI is rarely used in preclinical trial due to lack of validation and evidence (3). In this regard, we aim to validate the gadoxetate DCE-MRI in an animal model of liver fibrosis.Methods
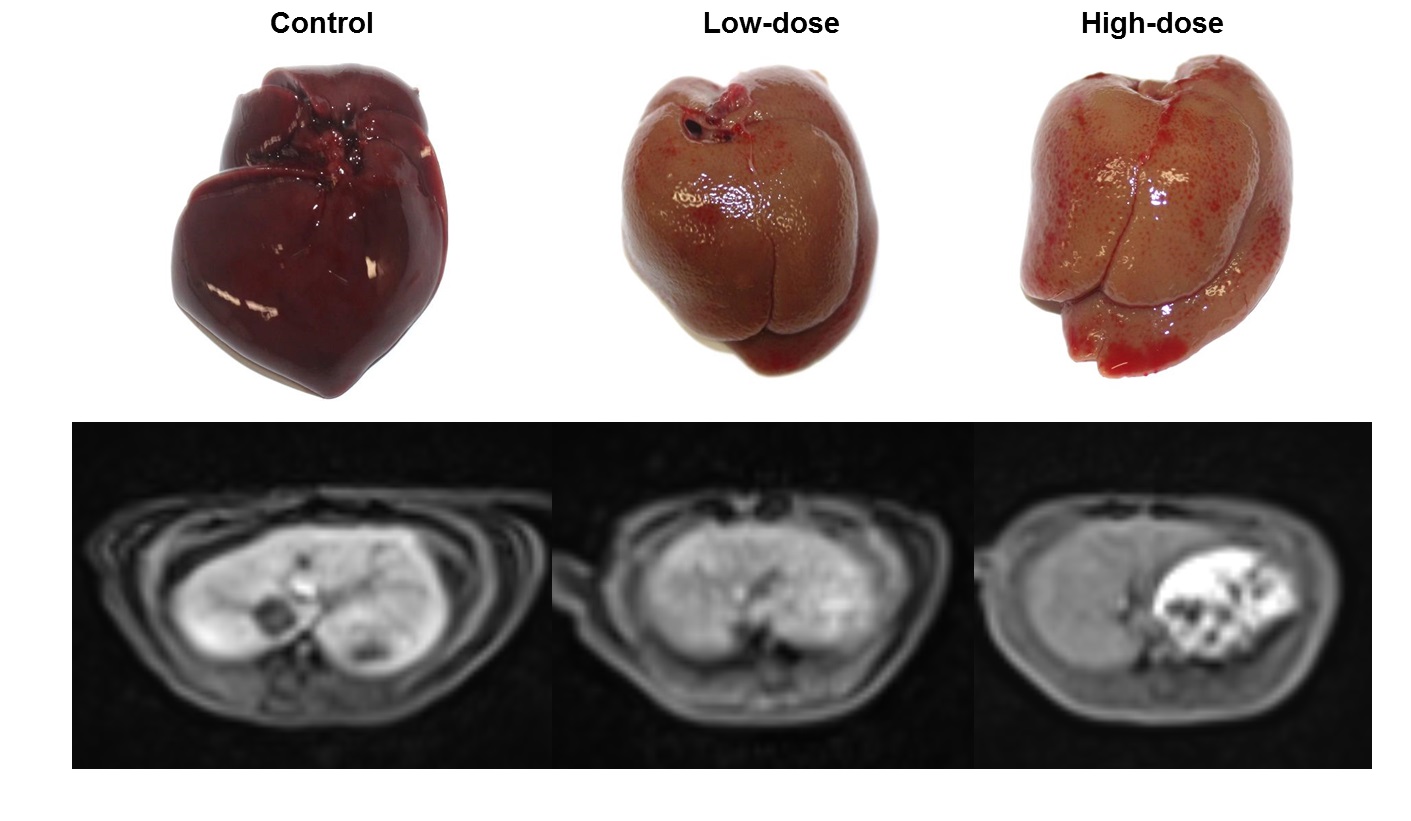
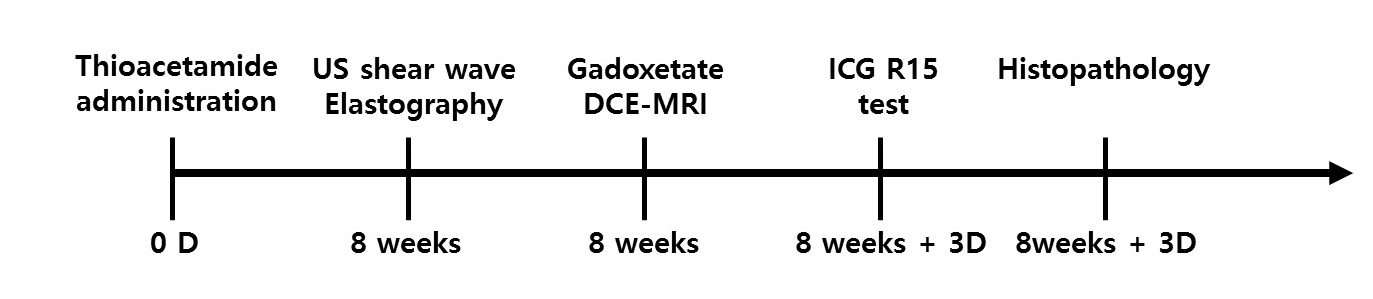
Animal model: Thirty-one SD rats were randomly assigned into three groups (high-dose, low-dose, and control). The liver fibrosis was induced in SD rats by administration of thioacetamide intraperitoneally for 8 weeks: 200mg/kg for high-dose group and 150 mg/kg for low-dose group.
MRI: At the end of thioacetamide administration period, we performed gadoxetate DCE-MRI at a 3-T MR scanner (Magnetom Skyra, Siemens) using CAIPIRINHA-VIBE sequence with the following parameters: TR/TE 4.3/1.5 ms; flip angle 25°; matrix size 128x128; and an acceleration factor of 4, and scan coverage 78 mm (52 slices×1.5 mm thickness). Dynamic series was repeatedly every 3.6 seconds for 3 minutes and then every 60 seconds for 30 minutes after injecting 0.05 mmol/kg of body weight of gadoxetate (Bayer Healthcare). The control rats were acquired twice with 7-days interval. Using the MATLAB (The MathWorks), the relative liver enhancement (RLE) at 3 minutes (RLE-3) and 15 minutes (RLE-15), initial area of under the curve (iAUC) until 3 minutes (IAUC-3) and until 15 minutes (IAUC-15) were calculated based on time-enhancement curve.
Shear wave elastography (SWE): Ultrasonographic SWE was acquired with Aplio-500 Platinum machine (Toshiba Medical Systems) twice with 2-day interval. Liver stiffness measurement results were recorded in kilopascal (kPa).
Indocyanine green (ICG) test: To evaluate liver function, ICG retention rate at 15 minutes (ICG-R15) was evaluated by blood sampling at 15 minutes after injecting ICG.
Histopathology: After euthanizing the animals, the liver was extracted. On Masson’s trichrome stain, the liver fibrosis was evaluated by calculating collagen area (%) using Image J (NIH).
Statistical analysis: The correlation between these imaging parameters and histopathologic results and ICG-R15 test results were calculated. The diagnostic performance to diagnose liver fibrosis was also evaluated using receiver operating curve (ROC) analysis. The repeatability of imaging parameters was evaluated with within-subject coefficient of variation (wCV).
Results
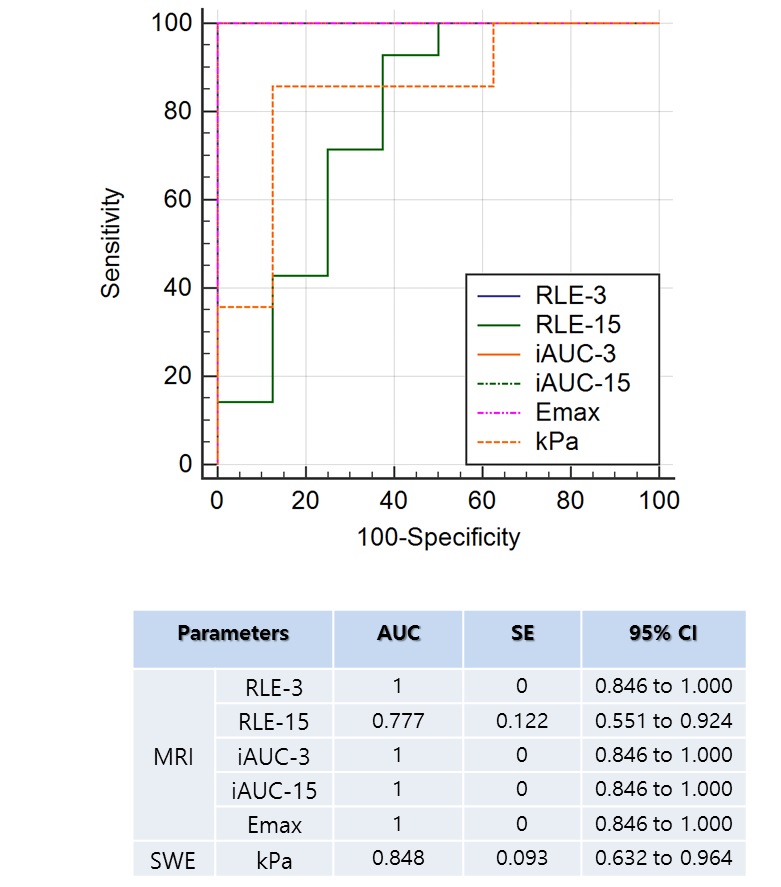
On histopathology, animal model was successful in that the collagen areas was highest in high-dose group (24.86 ± 4.55), followed by low-dose group (16.01 ± 3.25), and control group (6.27 ± 2.10). The correlation between the histopathologic collagen area and imaging parameters was similarly high in iAUC-15, iAUC-3, and RLE-3 (-0.78 to -0.81), but low in RLE-15 (-0.51) and SWE kPa (-0.59). The correlation coefficients between liver function on ICG-R15 and imaging parameters was highest in iAUC-15 (-0.65) followed by iAUC-3 (-0.63), RLE-3 (-0.62), SWE kPa (0.59), and RLE-15 (-0.56). In the ROC analysis to diagnose liver fibrosis (i.e., high-dose group and low-dose group), the diagnostic accuracy of RLE-3, iAUC-3, and iAUC-15 were 100% (AUROC 1.000) with complete differentiation between the liver fibrosis groups and control group. In contrast, the diagnostic values of the RLE-15 and kPa were significantly lower than the other MRI indices (AUROC 0.777 and 0.848, respectively). Based on these results, the best imaging parameter to evaluate liver function/fibrosis would be the iAUC-15. Repeatability was good in both iAUC-15 and SWE (wCV; 8.25 and 9.98%, respectively).Discussion
To evaluate physiologic liver function and hispathologic liver fibrosis, the gadoxetate DCE-MRI is more accurate than SWE.Conclusions
In preclinical trial with animal liver fibrosis model, the gadoxetate DCE-MRI is quite feasible to evaluate histopathologic liver fibrosis and physiologic liver function in a non-invasive and repeatable manner. The best MRI index would be the iAUC-15, which is better than kPa on SWE.Acknowledgements
This study was supported by a grant (No. 2017R1A2B3011475) from the the National Research Foundation of KoreaReferences
1. Choi Y, Huh J, Woo DC, Kim KW. Use of gadoxetate disodium for functional MRI based on its unique molecular mechanism. The British journal of radiology. 2016;89(1058):20150666.
2. Bae KE, Kim SY, Lee SS, Kim KW, Won HJ, Shin YM, et al. Assessment of hepatic function with Gd-EOB-DTPA-enhanced hepatic MRI. Digestive diseases (Basel, Switzerland). 2012;30(6):617-22.
3. Giraudeau C, Leporq B, Doblas S, Lagadec M, Pastor CM, Daire JL, et al. Gadoxetate-enhanced MR imaging and compartmental modelling to assess hepatocyte bidirectional transport function in rats with advanced liver fibrosis. European radiology. 2017;27(5):1804-11.
Figures
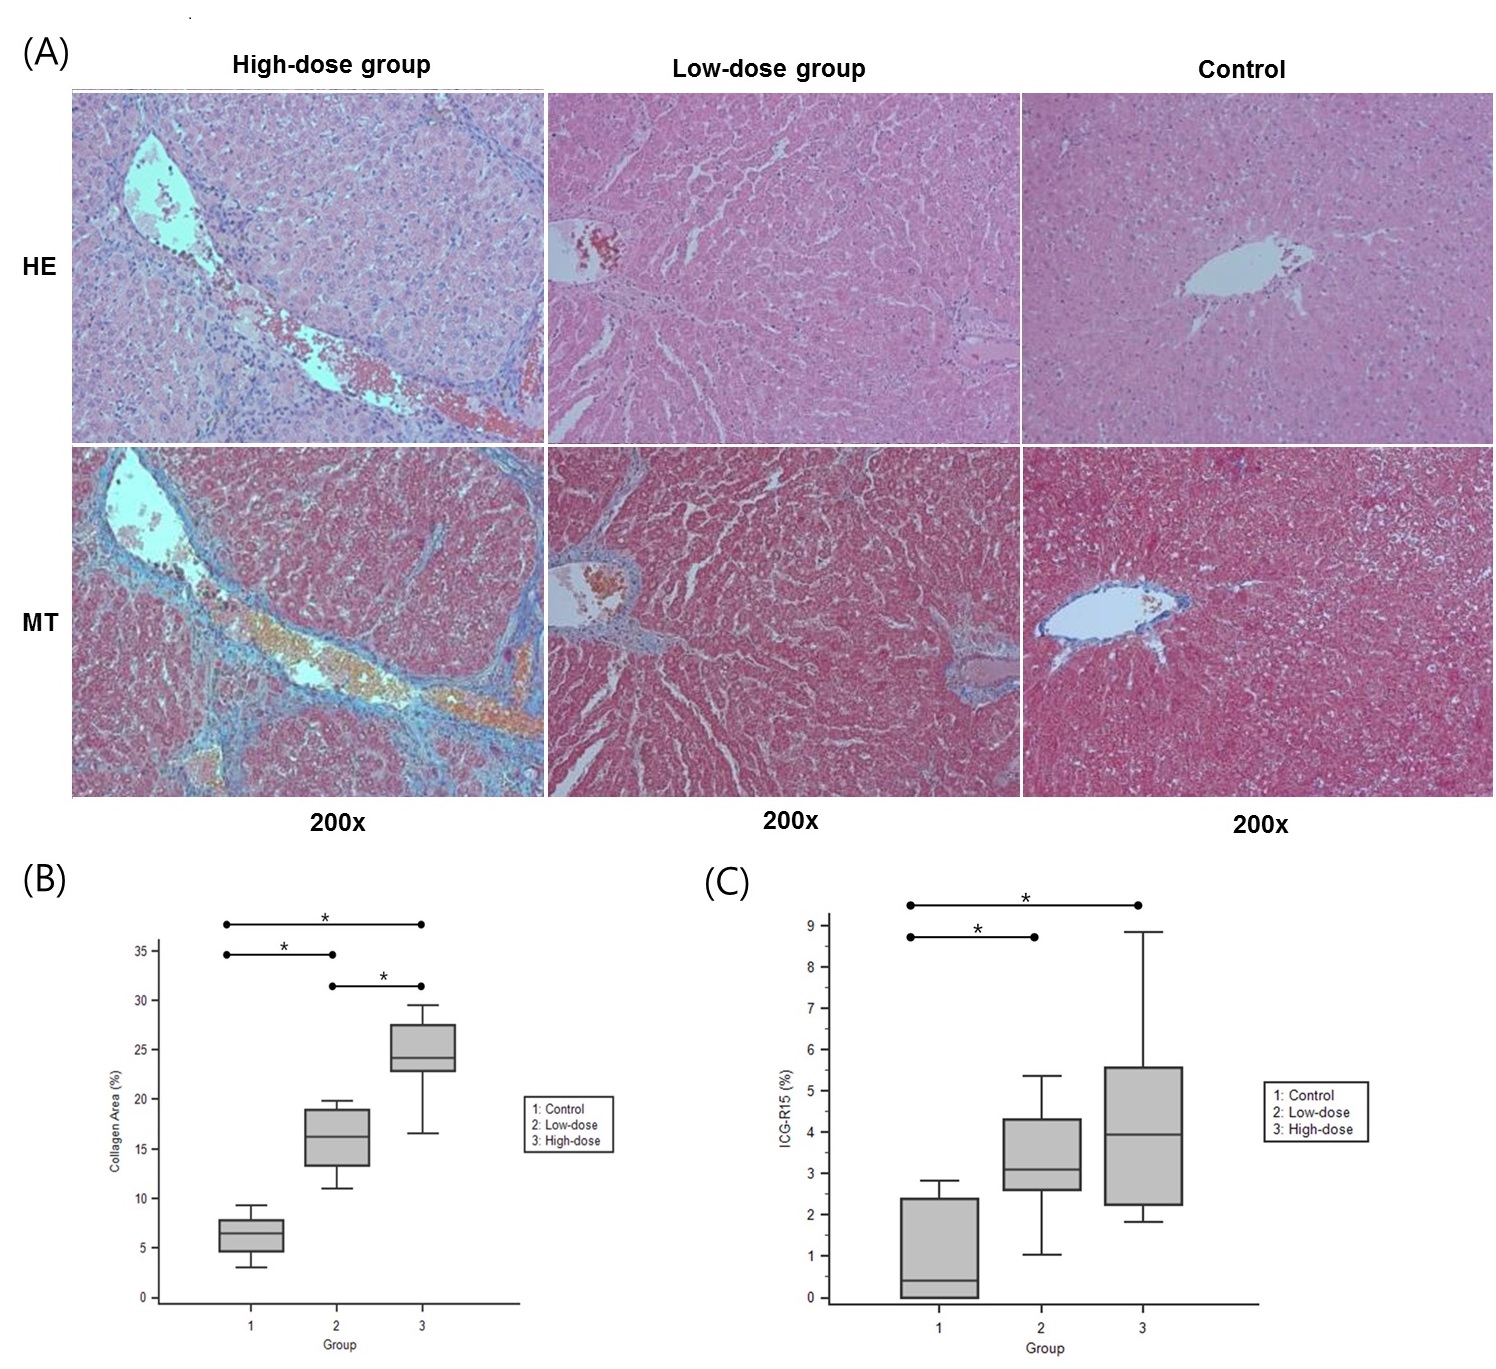
Histopathology of liver parenchyma
(a) Hematoxylin and eosin (HE) stain and Masson’s trichrome (MT) stain at 200ⅹ magnification
(b) Comparison of collagen area (%) between groups
(c) Comparison of ICG-R15 (%) between groups