4725
Effect of polyphenols during a high-fat diet enhanced with chemical shift-encoded MRI1Univ. Lyon, INSA‐Lyon, Université Claude Bernard Lyon 1, UJM-Saint Etienne, CNRS, Inserm, CREATIS UMR 5220, U1206, F69621, VILLEURBANNE, France, Lyon, France, 2Department of Physiology, Faculty of Biology and Medicine, University of Lausanne, Lausanne, Lausanne, Switzerland, 3Centre de Recherche en Nutrition Humaine Rhône-Alpes (CRNH-RA), Centre Hospitalier Lyon Sud, Pierre-Bénite, Lyon, France, 4Hospices Civils de Lyon, Département d'imagerie digestive, CHU Edouard Herriot, Lyon, Lyon, France
Synopsis
In this study, 42 healthy male underwent a randomized, double blinded, parallel-group trial with either polyphenols or placebo during 31 days of high-carbohydrate and high-fat overfeeding. Changes in visceral, subcutaneous adipose tissue volumes and liver fat were measured using multi-gradient echo sequence. Visceral, subcutaneous adipose tissue volumes and liver fat increased significantly during overfeeding. The ratio VAT/SAT increased during overfeeding for the placebo group whereas this ratio slightly decreased for the polyphenol group.
Introduction
Obesity is a complex multifactorial disease combining genetic factors still misunderstood as well as environmental factors mainly related to diet and physical inactivity. People with abdominal fat accumulation have commonly an altered metabolic profile. The increase of visceral adipose tissue1 (VAT) is associated with a higher risk to develop insulin resistance and type 2 diabetes unlike the expansion of subcutaneous adipose tissue (SAT). According to previous research2,3, adding polyphenols to the alimentation could protect the liver and muscle tissue from the accumulation of triglycerides by stimulating lipid oxidation and attenuates the effect of a high-fat diet.
The purpose of this work was to monitor morphological and content changes of abdominal adiposity and liver in particular before and after weight gain, using chemical-shift encoded MRI (CSE-MRI).
Subjects and method
To be eligible, participants had to be a man aged between 18 and 55 years with a BMI between 23.0 kg/m2 and 27.0 kg/m2 and a low physical activity. Volunteers were excluded if they had family medical history of type 1 or 2 diabetes. Written informed consent was obtained from all the subjects. All volunteers underwent 31 days of high-carbohydrate and high-fat overfeeding by eating the equivalent of +50% of their daily energy requirements while maintaining their usual eating and sport activity habits. Subjects were divided randomly in two groups in a blinded way: one added to the overfeeding polyphenols capsules and the other placebos. This protocol was registered on the clinicaltrials.gov site (NCT02145780).
Subjects underwent two 3D spoiled-gradient multiple echo sequence (one before the overfeeding at D0 and the other at D31) on a 3T Ingenia Philips system. MRI acquisitions parameters were the following : 8 echoes (n x 1.15 ms TE with n=1, …,8), 10.3 ms TR, 384x420x320 mm3 FOV, 256x256x80 matrix size. This acquisition was made in 20.8 s apnea. The acquisition was performed on abdominal region, encompassing lumbar L1 to L5 and the liver. The segmentation of adipose tissue has been previously described4. The aim of this segmentation was to separate the subcutaneous adipose tissue (SAT) volume from the visceral adipose tissue (VAT) volume. The studied volume of adipose tissue was calculated between lumbar L2 to L4. PDFF parametric map5 was used to estimate the fat storage in liver.
The evolution of SAT, VAT, TAT (SAT+VAT) volumes, the ratio VAT/SAT and the PDFF in the liver were statistically studied. Effects of overfeeding and polyphenols were analyzed by a mixed model with two fixed effects (overfeeding and polyphenols) and one random effect (subjects). Then Tuckey post-hoc analyses were made. T-tests were applied to analyze the evolution of VAT/SAT between the two MRI and the difference of VAT/SAT ratio between polyphenols and placebo. P<0.05 was considered to be significant.
Results/Discussion
On a total of 42 subjects enrolled in the study, 2 did not complete the protocol and were excluded from the analyses (1 in each group).
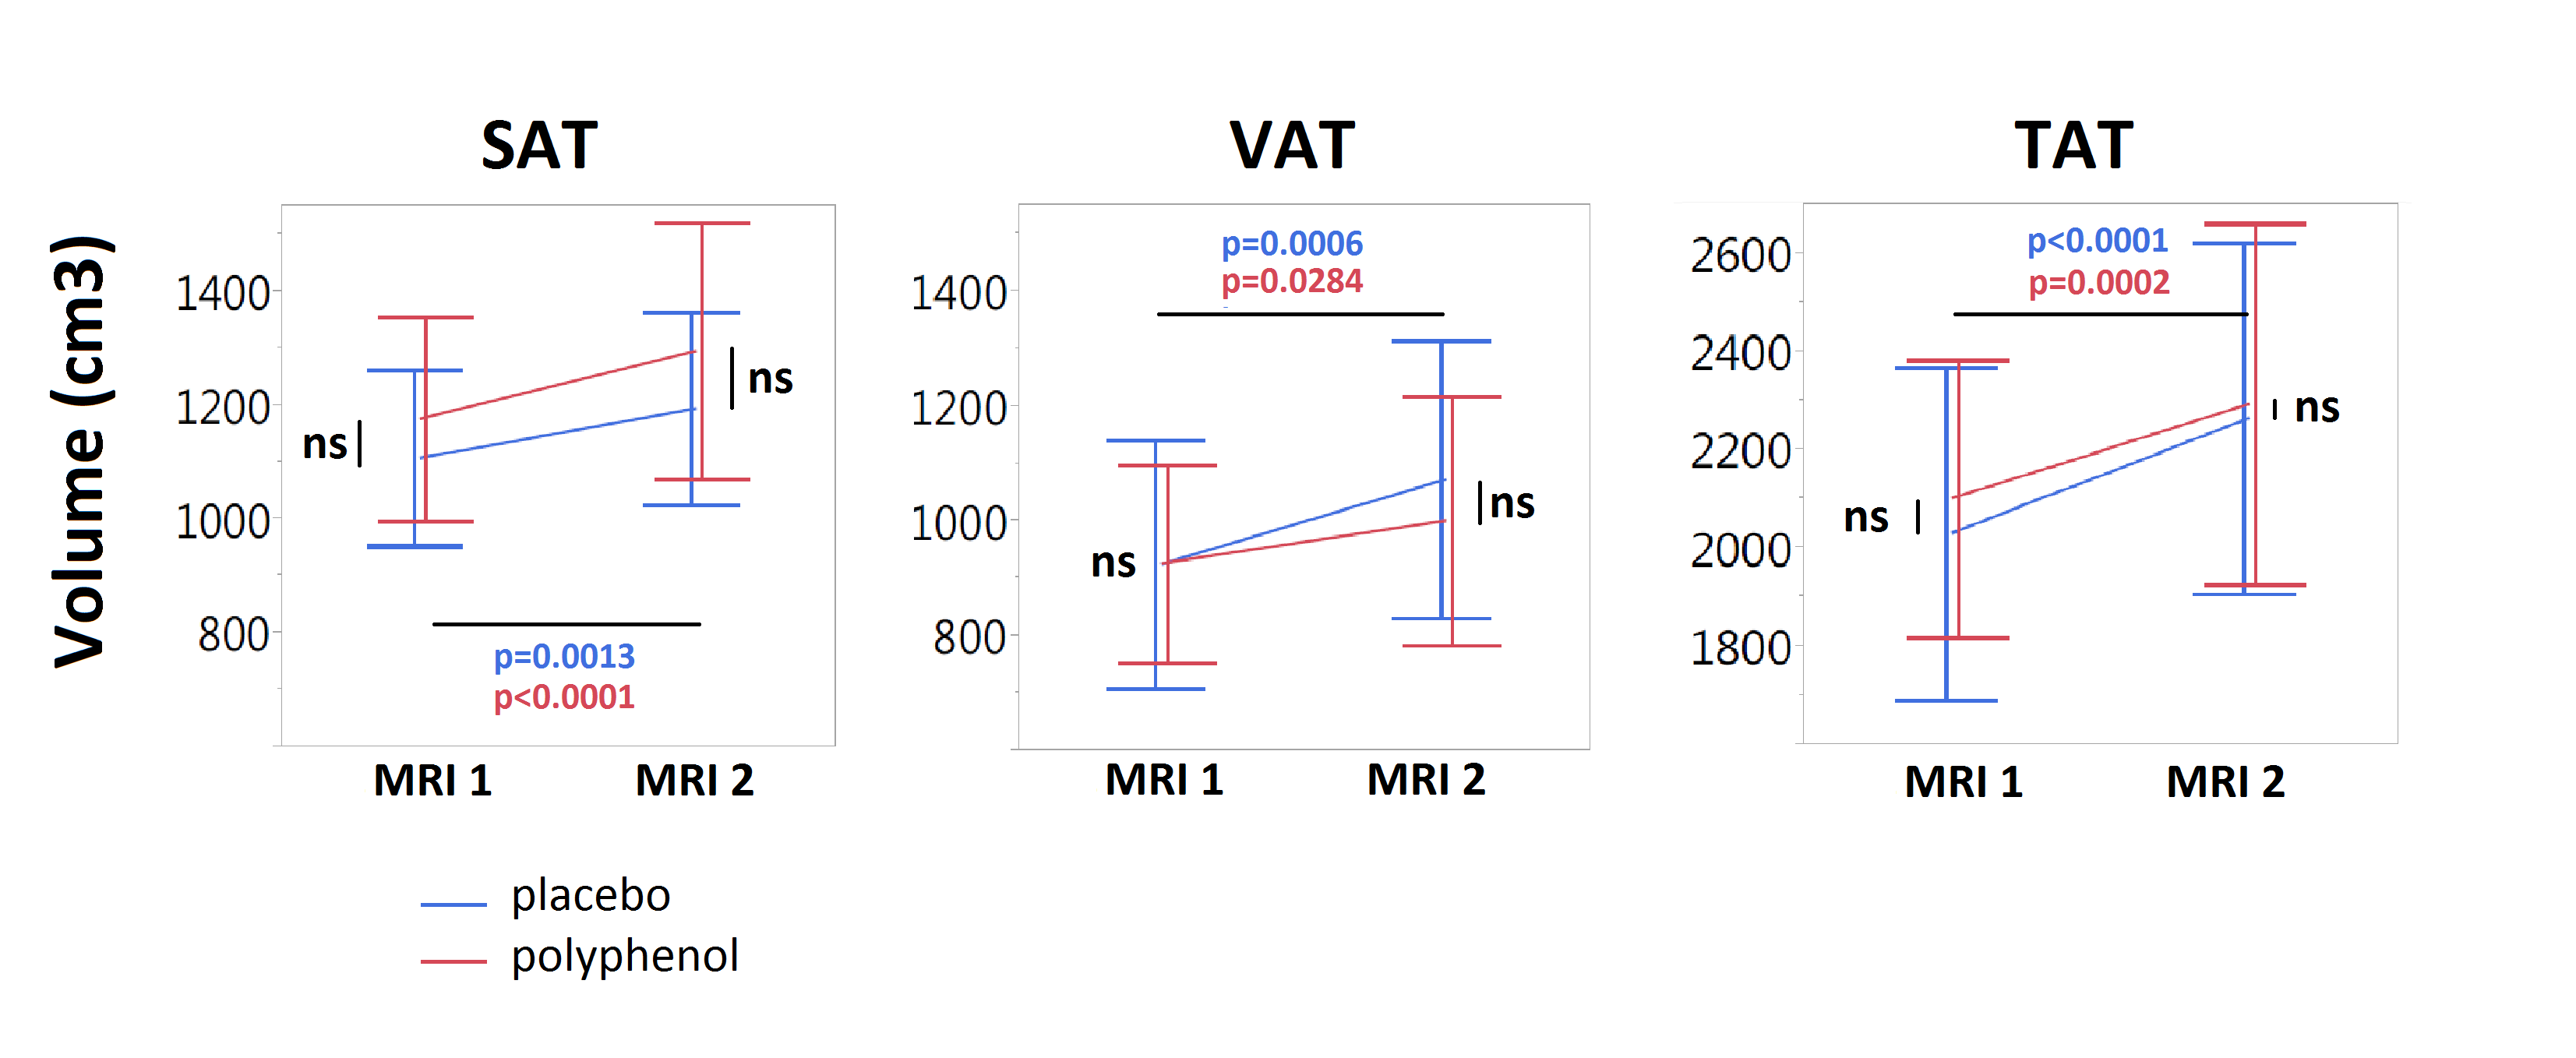
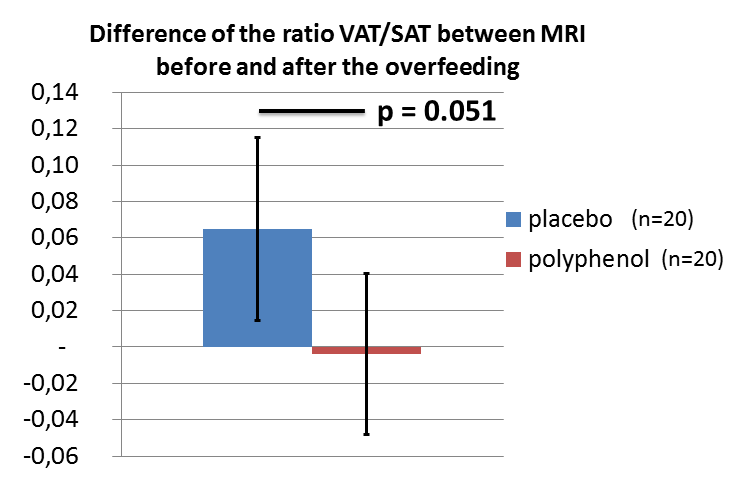
The SAT volume significantly increased after overfeeding (overfeeding effect p<0.001) in both group (placebo group: +90 cm3, p=0.001; polyphenol group: +111 cm3 p<0.001) but there was no effect of polyphenol (polyphenol effect p=0.513) (figure 1). In the same way, the VAT volume also significantly increased after overfeeding (overfeeding effect p<0.001) in both group (placebo group: +129 cm3, p<0.001; polyphenol group: +88 cm3, p=0.028) nevertheless no polyphenol effect was found (polyphenol effect p=0.894). Then the evolution of the ratio VAT/SAT (considering as a metabolic marker) was studied between the two MRI in order to identify a potential effect of polyphenol (figure 2). The evolution of VAT/SAT ratio was significantly higher in placebo group than in polyphenol group (+0.07, p=0.051) meaning an effect of polyphenol supplementation on visceral/subcutaneous lipid deposition.
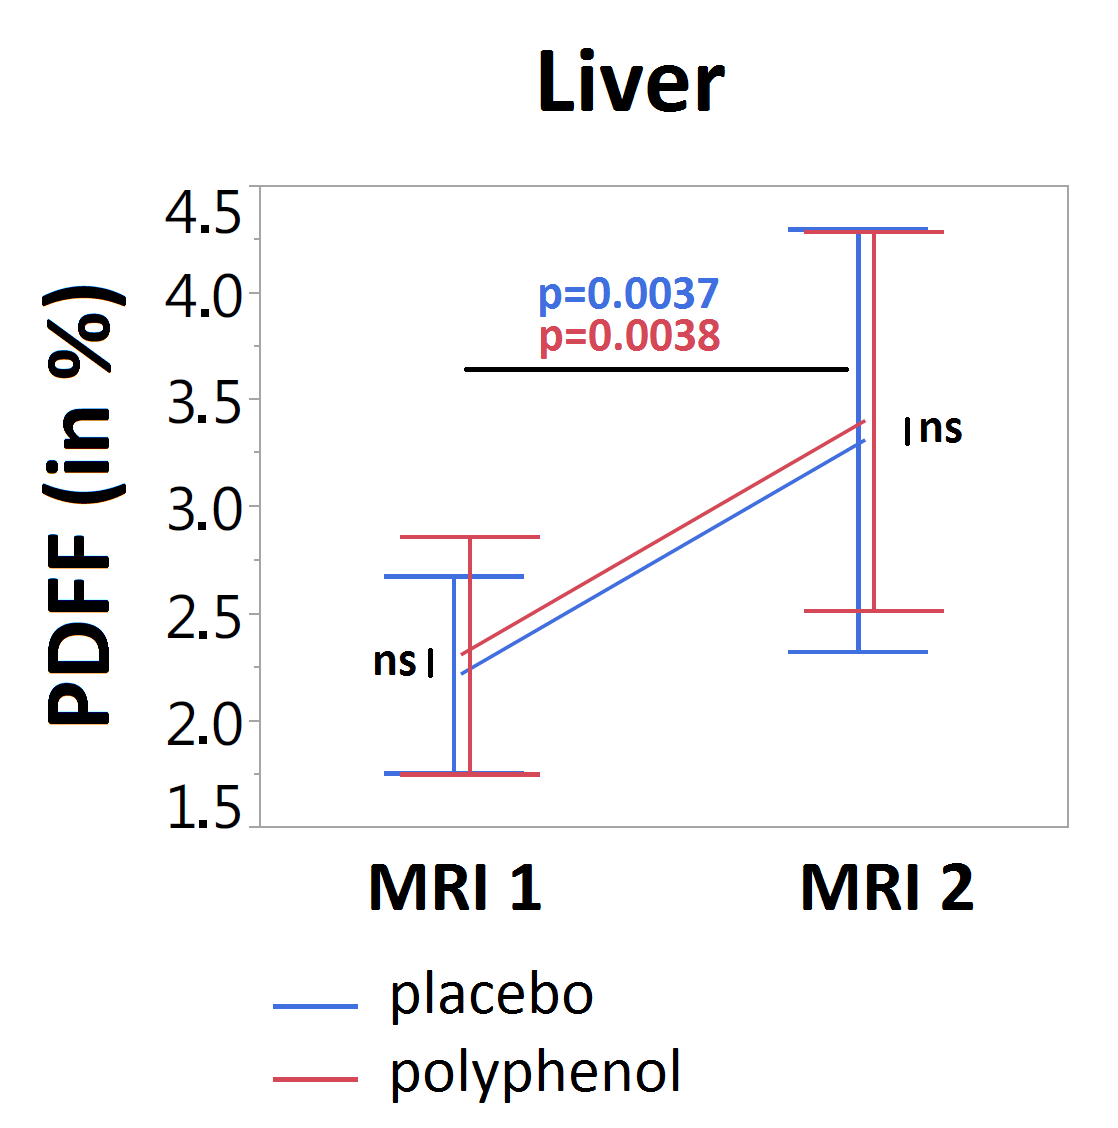
Two subjects (one in each group) presented an abnormal level of PDFF in the liver (PDFF>10%) at the beginning of the study, and were removed from the analysis. The PDFF in liver increased significantly in the two groups (overfeeding effect p<0.001) but there was no significant difference between placebo and polyphenol groups (polyphenol effect p=0.579).
Conclusion
Using a single 3D gradient multiple echo sequence and a suitable post processing we found that the overfeeding induced a significant increase of fat deposition in VAT, SAT and liver, nevertheless no significant polyphenol effect was found. Interestingly the polyphenol induced a modification of fat storage considering VAT/SAT ratio. More parameters are needed to link this modification with additional metabolic response biomarkers. Also fat composition will be assessed using gradient multiple echo sequence to estimate the fatty acid composition5. Presently, in this study, these measurements need more investigation to be analyzable in a clinical study.Acknowledgements
LABEX PRIMES (ANR-11-LABX-0063), program "Investissements d'Avenir" (ANR-11-IDEX-0007), IHU Opera and PHRC-IR Visfatir.References
- M Alligier, et al (2013). Visceral fat accumulation during lipid overfeeding is related to subcutaneous adipose tissue characteristics in healthy men. JCEM, 2013;98(2), 802-810.
- Lagouge, M., Argmann, C., Gerhart-Hines, Z., Meziane, H., Lerin, C., Daussin, F., et al. (2006). Resveratrol improves mitochondrial function and protects against metabolic disease by activating SIRT1 and PGC-1alpha. Cell, 127(6), 1109–1122.
- Chen, L.-L., Zhang, H.-H., Zheng, J., Hu, X., Kong, W., Hu, D., et al. (2011). Resveratrol attenuates high-fat diet-induced insulin resistance by influencing skeletal muscle lipid transport and subsarcolemmal mitochondrial β-oxidation. Metabolism: clinical and experimental, 60(11), 1598–1609.
- Nemeth A, Ratiney H, Leporq B, et al. Quantification of abdominal subcutaneous and visceral fat by magnetic resonance imaging of the proton at 3T: application to an overfeeding protocol. Proceedings of the 25th Annual Meeting ISMRM, Honolulu, Hawaï, USA, 2017; 1331.
- Leporq B, Lambert SA, Ronot M, Vilgrain V, Van Beers BE. Quantification of the triglyceride fatty acid composition with 3.0 T MRI. NMR Biomed (2014). 27(10):1211-21.
Figures