4723
MRI Texture Analysis in Predicting Treatment Response to Neoadjuvant Chemoradiotherapy in Rectal Cancer1Department of Radiology, National Cancer Center/Cancer Hospital, Chinese Academy of Medical Sciences and Peking Union Medical College, Peking, China
Synopsis
To evaluate the importance of MRI texture analysis in prediction and early assessment of treatment response before and early neoadjuvant chemoradiotherapy (nCRT) in patients with locally advanced rectal cancer (LARC). This retrospective study comprised of 59 patients. The tumoral texture parameters were compared between pre- and early nCRT. Area Under receiver operating characteristic (ROC) Curves [AUCs] were used to compare the diagnostic performance of statistically significant difference parameters and logistic regression analysis predicted probabilities for discriminating responders and nonresponders. Texture parameters as imaging biomarkers have the potential to prediction and early assessment of tumoral treatment response to neoadjuvant chemoradiotherapy in patients with LARC.
INTRUDUCTION
Neoadjuvant chemoradiotherapy (nCRT) followed by total mesorectal excision (TME) is the recommended standard therapy for patients with locally advanced rectal cancer (LARC). This treatment strategy has improved locoregional control, and rates of sphincter preservation and lead to significant pathologic complete response (pCR) defined as the absence of viable tumor cells after full pathologic examination of the resected specimen (ypT0N0M0) in a significant proportion of patients. In these patients with pCR to nCRT, some investigations have indicated that surgery can be omitted and the non-operative treatment strategy with strict follow-up (watch-and-wait strategy) may be safe and associate with good survival rates. Accurate response assessment to nCRT prior to the start and early treatment can enhance clinical care management by enabling the personalization of treatment plans based on predicted outcome.There is increased interest in the field of radiomics due to the limitations in existing imaging modalities and the concept that radiological images hold more information than that is being utilized.Texture analysis (TA) is a noninvasive method of assessing the intratumoral heterogeneity. To date, there is very little research carried out to assess whether TA of MRI in rectal cancer can potentially be used as an imaging biomarker for early response to nCRTOBJECTIVE
To evaluate the importance of MRI texture analysis in prediction and early assessment of treatment response before and early neoadjuvant chemoradiotherapy (nCRT) in patients with locally advanced rectal cancer (LARC).
METHODS
This retrospective study comprised of 59 patients. The tumoral texture parameters were compared between pre- and early nCRT. Area Under receiver operating characteristic (ROC) Curves [AUCs] were used to compare the diagnostic performance of statistically significant difference parameters and logistic regression analysis predicted probabilities for discriminating responders and nonresponders.
RESULTS
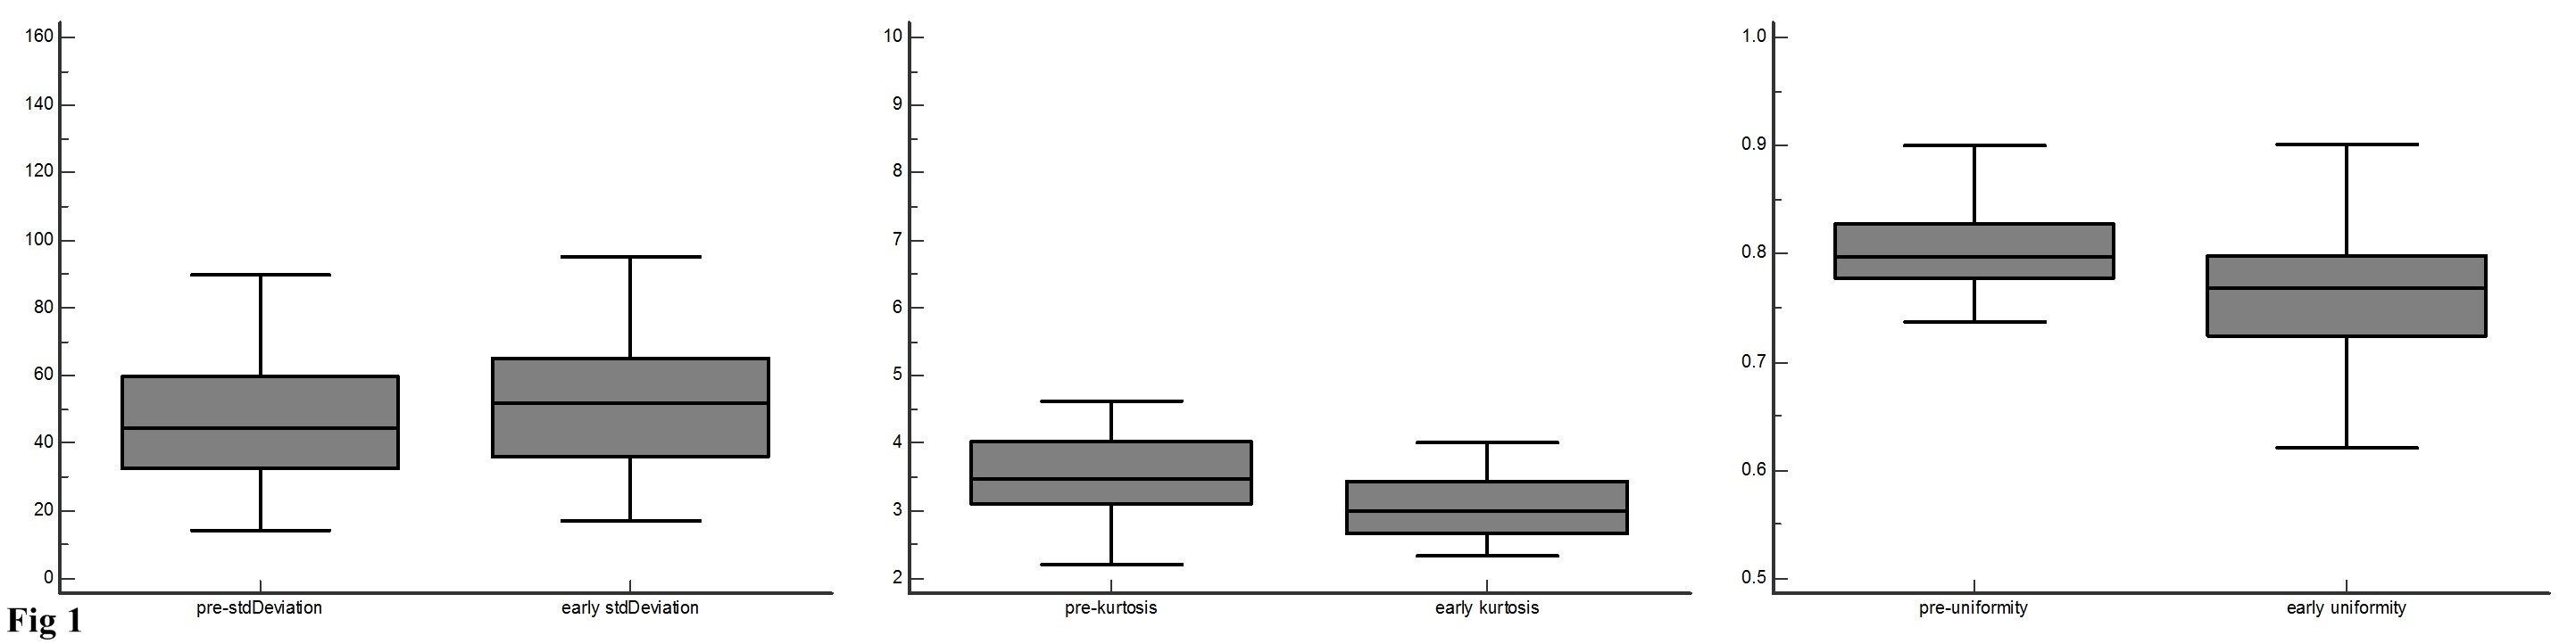
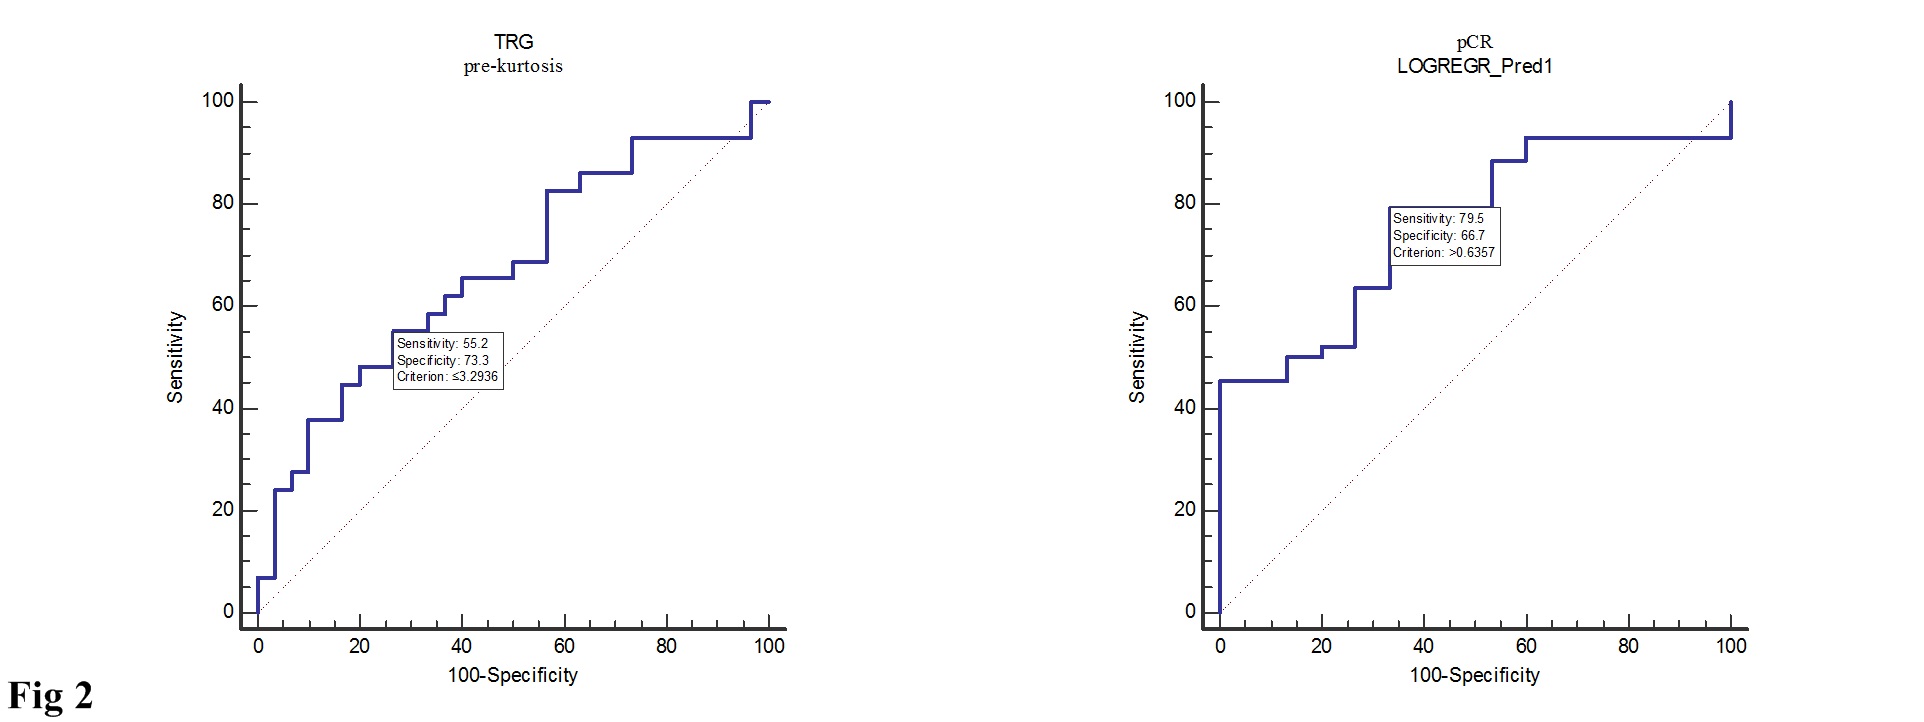
The Standard Deviation (SD), kurtosis and uniformity were statistically significantly difference between pre- and early nCRT (p=0.0012, 0.0001, and <0.0001, respectively) (Fig. 1). In pathological complete response (pCR) group, pre-uniformity and pre-Energy were significantly higher than that of nonresponders (p=0.03 and p <0.01, respectively), while the pre-entropy in nonresponder was reverse (p=0.01). The diagnostic performance of pre-kurtosis and pre-Energy were higher in tumor regression grade (TRG) and pCR group (AUC=0.67, 0.73, respectively). Logistic regression analysis showed that diagnostic performance for prediction responder and nonresponder did not significantly improve compared with to pre-uniformity, energy and entropy in pCR group (AUC=0.76, p=0.2794, 0.4222 and 0.3512, respectively) (Fig. 2).
CONCLUSIONS
Texture parameters as imaging biomarkers have the potential to prediction and early assessment of tumoral treatment response to neoadjuvant chemoradiotherapy in patients with LARC.Acknowledgements
No acknowledgement found.References
1. Sauer, R. et al. Preoperative versus postoperative chemoradiotherapy for rectal cancer. N Engl J Med 351, 1731-1740 (2004).
2. Bosset, J.F. et al. Chemotherapy with preoperative radiotherapy in rectal cancer. N Engl J Med 355, 1114-1123 (2006).
3. van Gijn, W. et al. Preoperative radiotherapy combined with total mesorectal excision for resectable rectal cancer: 12-year follow-up of the multicentre, randomised controlled TME trial. LANCET ONCOL 12, 575-582 (2011).
4. Habr-Gama, A. et al. Operative versus nonoperative treatment for stage 0 distal rectal cancer following chemoradiation therapy: long-term results. ANN SURG 240, 711-717, 717-718 (2004). 5. Habr-Gama, A. et al. Patterns of failure and survival for nonoperative treatment of stage c0 distal rectal cancer following neoadjuvant chemoradiation therapy. J GASTROINTEST SURG 10, 1319-1328, 1328-1329 (2006).
5. Nougaret, S. et al. Intravoxel Incoherent Motion-derived Histogram Metrics for Assessment of Response after Combined Chemotherapy and Radiation Therapy in Rectal Cancer: Initial Experience and Comparison between Single-Section and Volumetric Analyses. RADIOLOGY 280, 446-454 (2016).
6. Ahmed, A., Gibbs, P., Pickles, M. & Turnbull, L. Texture analysis in assessment and prediction of chemotherapy response in breast cancer. J MAGN RESON IMAGING 38, 89-101 (2013).
7. De Cecco, C.N. et al. Texture analysis as imaging biomarker of tumoral response to neoadjuvant chemoradiotherapy in rectal cancer patients studied with 3-T magnetic resonance. INVEST RADIOL 50, 239-245 (2015).
8. De Cecco, C.N. et al. Performance of diffusion-weighted imaging, perfusion imaging, and texture analysis in predicting tumoral response to neoadjuvant chemoradiotherapy in rectal cancer patients studied with 3T MR: initial experience. Abdom Radiol (NY) 41, 1728-1735 (2016).
Figures