4722
Diffusion-Weighted MR Imaging of rectal cancer with A Fractional Order Calculus ModelYanfen Cui1, Zhizheng Zhuo2, and Xiaotang Yang3
1Department of Radiology, Shanxi Province Tumor hospital, Taiyuan, China, 2MR Clinical Sciences, Philips Healthcare Greater China, Beijing, China, Beijing, China, 3Shanxi Province Tumor Hospital, Taiyuan, China
Synopsis
A novel non-Gaussian diffusion model based on fractional order calculus (FROC) were successfully applied to diffusion MRI of rectal cancer. Statistically significant differences in D and β values are observed between rectal cancer and villous adenoma (p < 0.001), indicating that individual or combined parameters from the FROC diffusion model may be useful as imaging biomarkers in predicting the biological properties of rectal cancer in clinical practice.
Purpose:
Water molecular diffusion in vivo tissue is much more complicated. Over the past decades, many non-Gaussian diffusion model has been increasingly used for rectal cancer characterization and treatment evaluations, including intravoxel incoherent motion (IVIM)[1], stretched-exponential model (SEM)[2],diffusion kurtosis model(DKI) [3], and others. Taking into account of anomalous diffusion in locally heterogeneous tissue structures and environment, a novel non-Gaussian diffusion model based on fractional order calculus (FROC) had been successfully applied to diffusion MRI of pediatric brain tumors and prostate cancer[4-5], however, no study is relation to rectal cancer. Therefore, the purpose of our present study was to expand the utility of FROC model to rectal diffusion MRI, and investigate the feasibility of using a set of new parameters from the FROC model to differentiate rectal cancer and villous adenoma.Methods:
This retrospective study was approved by our institutional review board and written informed consent was waived. 38 patients with RC and 15 patients with villous adenoma, who had underwent surgery confirmed, were enrolled in this study. All patient underwent pre- treatment MRI examination at 3.0 T scanner (Achieva; Philips Healthcare, Best, The Netherlands) with 8-channel phased array torso coils, including T2-weighted imaging (T2WI), diffusion-weighted imaging (DWI) and contrast enhanced T1-weighted imaging. DWI was performed using a single-shot EPI sequence with multiple b-values (b = 0, 700, 1400, and 2100 s/mm2). Key acquisition parameters for DWI were as follows: TR/TE = 4,000/80 ms; flip angle= 90°; parallel imaging acceleration factor = 2; slice thickness = 3 mm, no slice gap; field of view (FOV) = 25 cm × 25 cm; matrix = 256 ×256; Total imaging time for DWI = 3 min 51 s. The FROC diffusion model was applied to fitting the multi-b-value diffusion dataset on a pixel-by-pixel basis using the following equation: S/S0=exp{-Dμ2(β-1)(γGdδ)2β[Δ-(2β-1) δ/(2β+1)]} [4], where the spatial fractional order β (dimensionless) is correlated to the degree of tissue heterogeneity and the spatial quantity μ (in units of μm) is related to the diffusion mean free length[4-5]. In data fitting, the initial D value was estimated by a mono-exponential fitting model using data acquired at b-values ≤ 1000 sec/mm2, allowing a direct comparison with ADC value. All image processing and analysis were performed using customized software developed in Matlab (Mathworks Inc, MA). For each patient, Regions of interests (ROIs) were manually drew on DWI maps with b= 1400 or 2100 sec/mm2 along the border of the tumor, and excluded the cystic, necrosis and hemorrhage areas by referring to the conventional MR images, by one experienced radiologists who were both blinded to all the clinical information. Mean values and standard deviations of D, β and μ were calculated from the tumor ROIs for each patient. Since a strong correlation between D and μ has been reported previously[4], our analysis was limited to D and β. Student’s t-test or Mann-Whitney U-test, receiver operating characteristic(ROC) curves were used for statistical analysis. All statistical analyses were performed using SPSS 19.0(IBM, New York, NY, USA) and MedCalc 15.8 (MedCalc,Mariakerke, Belgium).Results:
Representative maps of D (E, F), β (G, H) from one representative patient in each of the two groups (left column: rectal cancer; down: villous adenoma) are shown in Fig.1. The D and β values for each group are summarized in. Fig. 2. Statistically significant differences in D and β values are observed between rectal cancer and villous adenoma (p < 0.001). In addition, Figure 3 and Table 1 illustrates the ROC curves, in which AUC for D, β were 0.912 and 0.879, respectively. Meanwhile, combination of D and β values showed a relatively higher AUC(0.935) than D or β alone, with the sensitivity and specificity were 81.58% and 93.33%, respectively.Discussion and Conclusion:
Our results demonstrate that there is a significant difference in FROC parameters between the rectal cancer and villous adenoma. Decreased D values were found in rectal cancer, likely corresponds to increased cellularity and decreased extracellular space as compared to benign villous adenoma. The new parameter β was shown to reveal the tissue heterogeneity/complexity. The rectal cancer cells packed more tightly were associated with increasing tissue homogeneously at the microstructural level, resulting in higher β values, when compared to villous adenoma. This finding indicates that individual or combined parameters from the FROC diffusion model may be useful for rectal tumor characterizing. Further investigation is required to determine whether FROC metrics are useful as imaging biomarkers in predicting the biological properties of rectal cancer in clinical practice.Acknowledgements
This work was supported by the fund of Science andTechnology Project of Shanxi Province (No. 20150313007-5).References
- Nougaret S, Vargas H A, Lakhman Y, et al. Intravoxel Incoherent Motion–derived Histogram Metrics for Assessment of Response after Combined Chemotherapy and Radiation Therapy in Rectal Cancer: Initial Experience and Comparison between Single-Section and Volumetric Analyses. Radiology, 2016, 280(2): 446-454.
- Zhang G, Wang S, Wen D, et al. Comparison of non-Gaussian and Gaussian diffusion models of diffusion weighted imaging of rectal cancer at 3.0 T MRI. Sci Rep. 2016;6:38782.
- Zhu L, Pan Z, Ma Q, et al. Diffusion Kurtosis Imaging Study of Rectal Adenocarcinoma Associated with Histopathologic Prognostic Factors: Preliminary Findings. Radiology. 2016:160094.
- Sui Y, Wang H, Liu G, et al. Differentiation of low-and high-grade pediatric brain tumors with high b-value diffusion-weighted MR imaging and a fractional order calculus model. Radiology, 2015, 277(2): 489-496.
- Liu G, Xie K , Sui Y, et al. Diffusion-Weighted MR Imaging of Prostate with A Fractional Order Calculus Model. ISMRM, 2013.
Figures
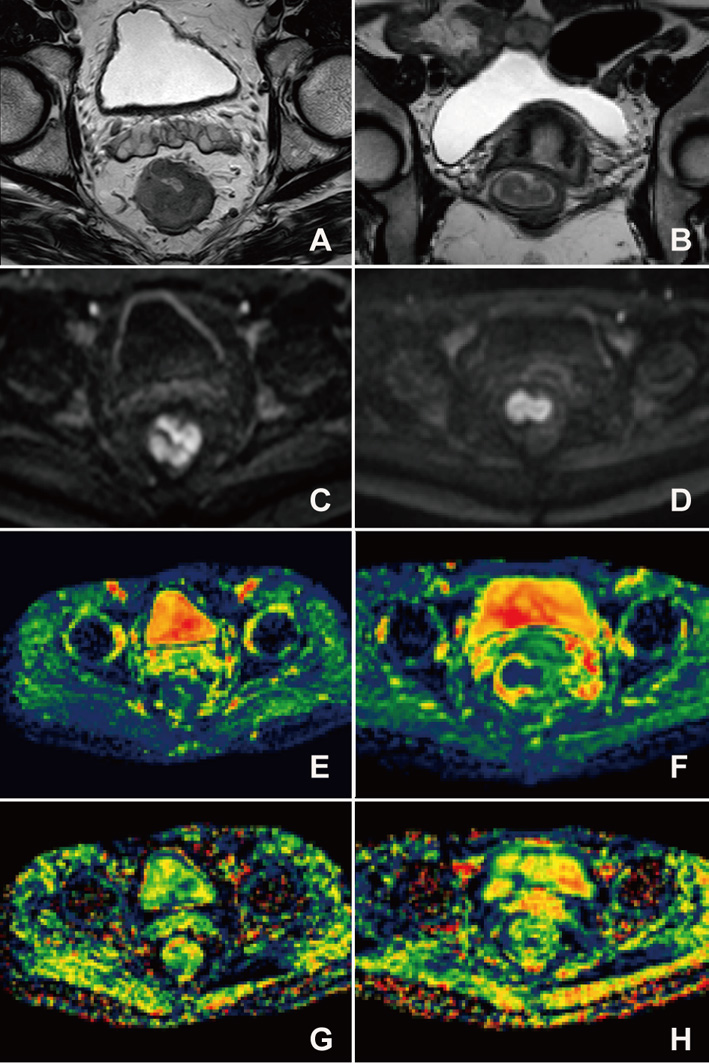
A set of images from one representative patient in a patient with confirmed rectal cancer (left column) and a patient with villous adenoma(right column). (A/B): T2-W image; (C/D):DWI with b=1400 sec/mm2; (E/F): D map; (G/H): β map.
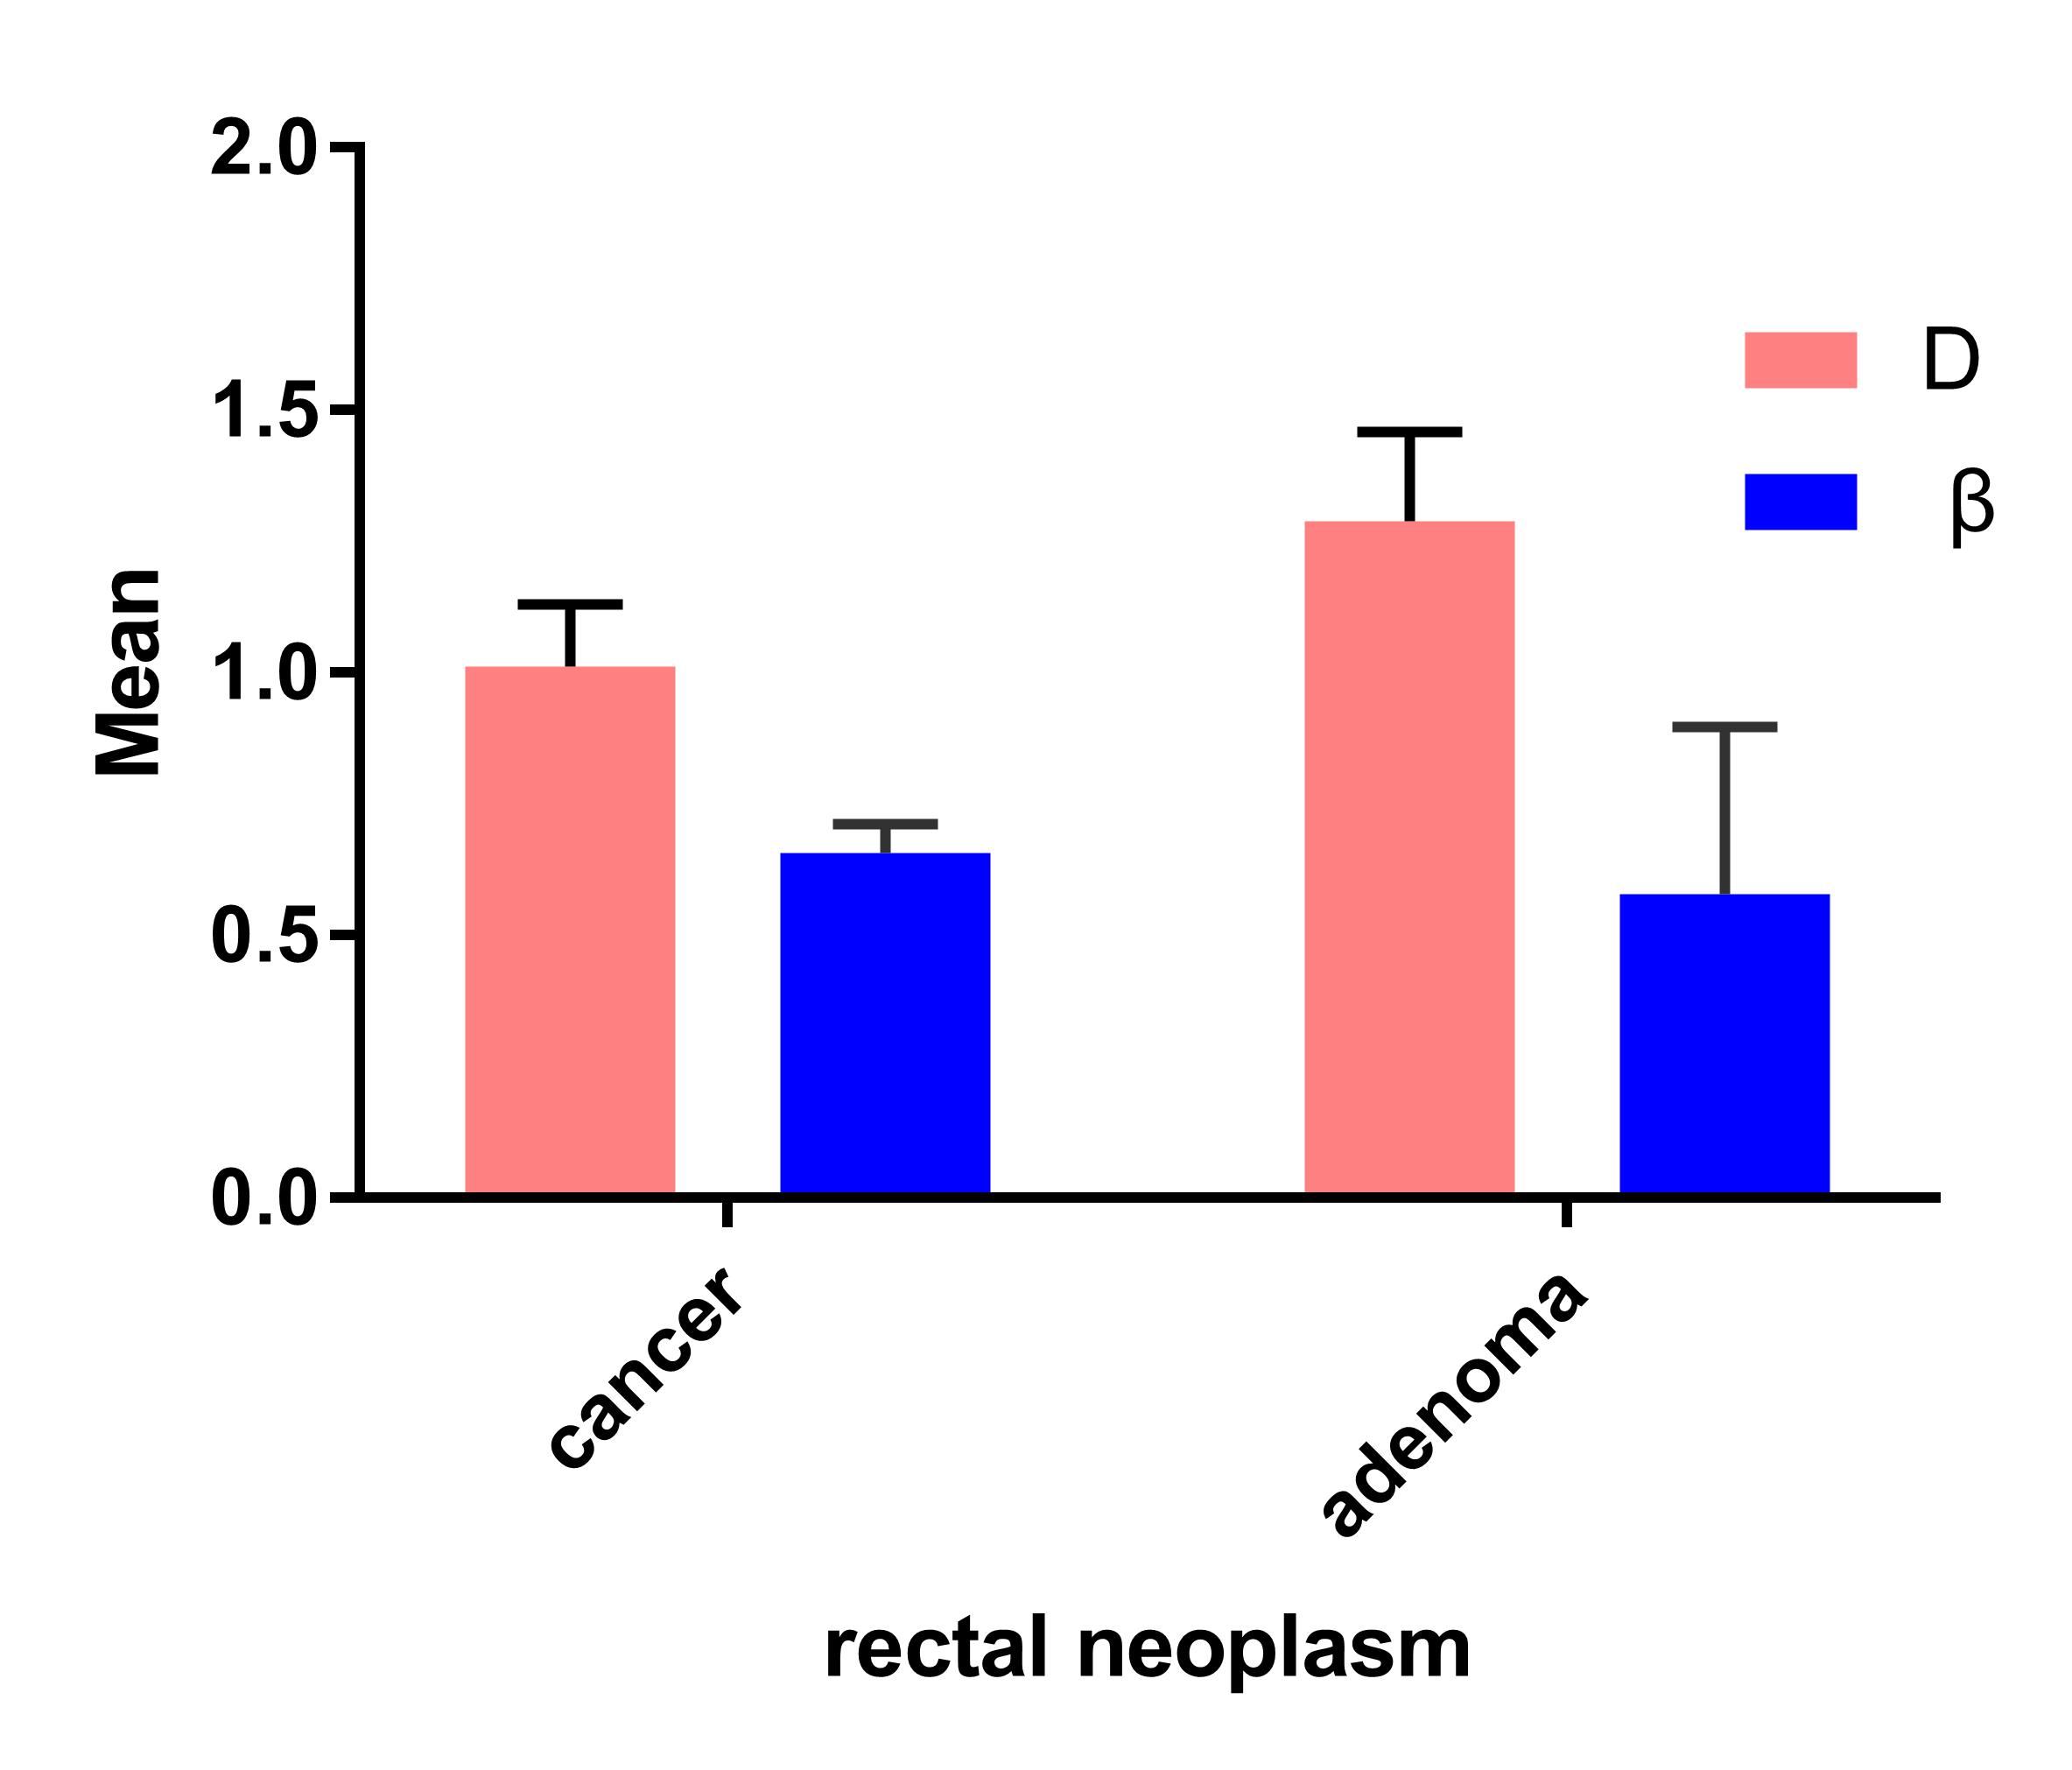
Figure 2 Mean and standard deviation of the diffusion parameters based on the FROC model over ROIs in rectal cancer and villous adenoma.
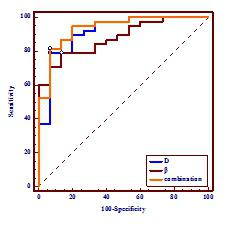
Figure 3 A comparison of the diagnostic ability for distinguishing rectal cancer and villous adenoma between D and β.

Table1