4719
The Radiomic Signature as a Prognostic Biomarker for Locally Advanced Rectal Cancer1University of Electronic Science and Technology of China, Beijing, China, 2Department of Radiology, National Cancer Center/Cancer Hospital, Chinese Academy of Medical Sciences and Peking Union Medical College, Beijing, P.R. China., Beijing, China, 3CAS Key Laboratory of Molecular Imaging, Institute of Automation, Chinese Academy of Sciences, Beijing P.R. China; University of Chinese Academy of Sciences, Beijing P.R. China., Beijing, China, 4CAS Key Laboratory of Molecular Imaging, Institute of Automation, Chinese Academy of Sciences, Beijing, China
Synopsis
Radiomics uses a large number of medical imaging features and can demonstrate voxel-wise intratumor heterogeneity. We calculated the radiomic signature for each patient using a weighted linear combination of the radiomic features selected by machine learning methods. The study endpoint was DFS, defined as the interval between TME surgery and disease progression, which included tumor local recurrence, distant metastasis, or death, or the date of the last follow-up visit (censored). The association between the radiomic signature and DFS was explored. Then, the three models were built to estimate the DFS in patients.
Background and Purpose
Neoadjuvant chemoradiotherapy (nCRT) followed by total mesorectal excision (TME) is now the standard combined treatment modality for patients with locally advanced rectal cancer (LARC) (1). Distant metastasis is the main cause of treatment failure in patients with LARC. For patients at high risk of an adverse outcome after nCRT, additional systemic therapy may reduce the risk of distant relapse and confer a survival benefit. The aim of this study was to develop a radiomic signature to predict disease-free survival (DFS) in individual patients with locally advanced rectal cancer and assess its incremental value to clinicoradiologic risk factors.Methods
Axial, sagittal, and oblique coronal T2-weighted spin-echo sequences were acquired. Subsequently, a small field of view (16 cm × 16 cm), high-resolution, oblique axial (perpendicular to the long axis of the tumor) T2-weighted image sequence (repetition time/echo time, 5160 ms/151 ms; flip angle, 90°; echo train length, 19; slice thickness, 3 mm; matrix, 512 × 512) was performed. An axial spin-echo, diffusion-weighted echo-planar imaging sequence with background body signal suppression was then acquired at b values between 0 and 800 s/mm2. Thereafter, axial three-dimensional LAVA multi-enhanced MR images were acquired. A bolus of gadolinium-based contrast agent (gadopentetate dimeglumine; Bayer, Leverkusen, Germany) 0.1 mmol/kg body weight was administered at 2 mL/s using a power injector. One phase of images before injection of contrast agent and nine phases of images after administration of contrast were acquired. The acquisition time per phase was 15 s. The repetition time was 3 ms and the echo time was 1.4 ms. A flip angle of 15° was used. The matrix was 320 × 192 and the field of view was 40 mm × 40 mm. The slice thickness was 3 mm and the thickness spacing was 0 mm. Patients underwent bowel preparation with antispasmodic medication before the MRI examinations. All sequences were obtained during free breathing. All manual tumor segmentations were performed by a gastrointestinal tract radiologist with 15 years of experience. We performed image intensity normalization to transform arbitrary MRI intensity values into a standardized intensity range, and the quantitative radiomic features were calculated from these standard inputs (2). The radiomic features used in our study contained 485 three-dimensional descriptor (3). A radiomic signature was generated using a least absolute shrinkage and selection operator (LASSO) Cox regression model (4). Kaplan-Meier survival curves were generated for both the training set (n = 54) and the validation set (n = 54) to explore the association between the radiomic signature and DFS. Three models were built in the training set, i.e., a radiomic model, a clinicoradiologic Cox model and a combined model. Then the predictive ability of each model was assessed by calculating the Harrell concordance index.Results
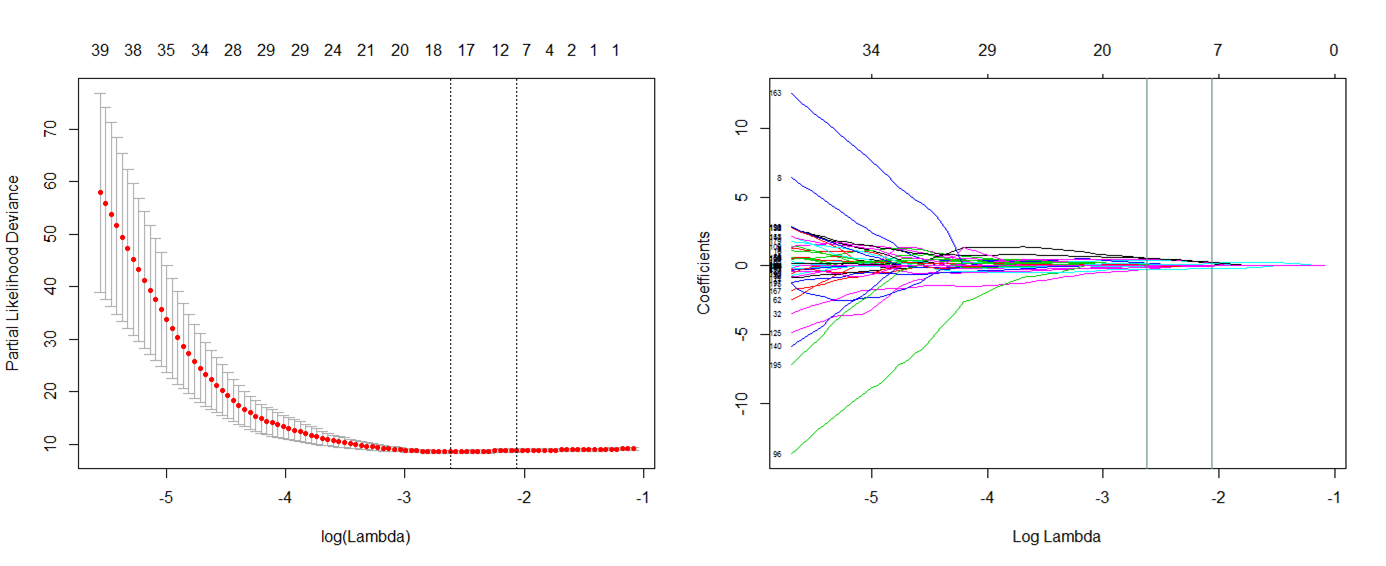
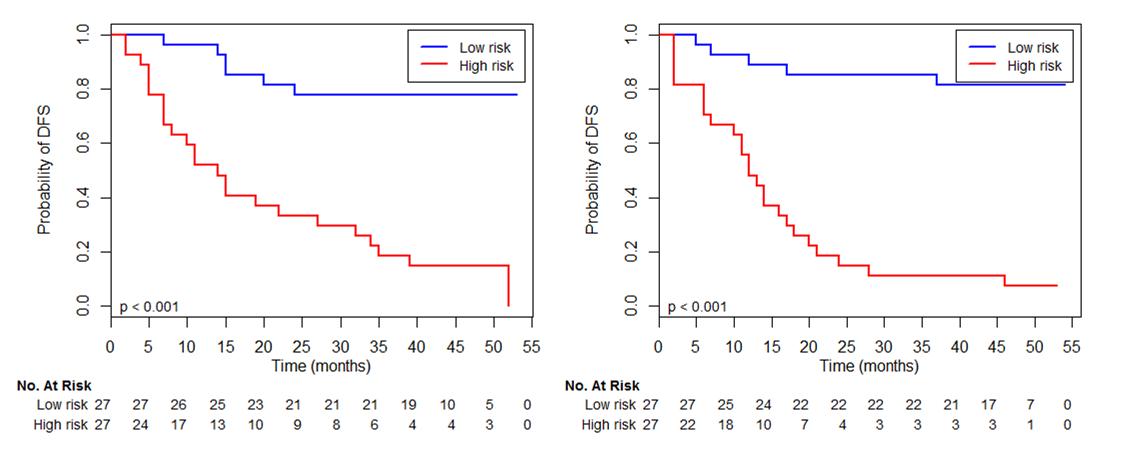
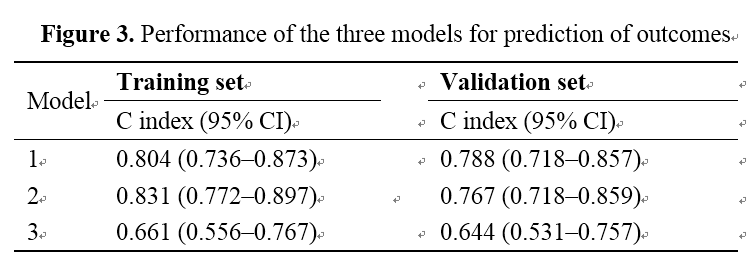
Using a 10-fold cross-validation, the LASSO Cox model identified three intensity features and five textural features that were most important for predicting the outcome (Figure 1). The radiomic signature built with selected features stratified patients into a low-risk group or high-risk group for DFS in the training set (HR 6.83; P < 0.001) and was successfully validated for patients in the validation set (HR 2.92; P < 0.001). The association between the radiomic signature and DFS is shown by the Kaplan-Meier survival curves in Figure 2. The predictive accuracy of the combined model was higher than that of the clinicoradiologic model or the radiomic model (Figure 3.).Discussion and Conclusion
In this study, we identified a combined model that was an effective biomarker for individualized evaluation before nCRT in patients with LARC. To our knowledge, this is the first study to assess the prognostic value of a combined model and also the first to explore the predictive value of a radiomic model in patients with LARC who receive nCRT. The combined model had better prognostic performance in terms of predicting DFS than either the radiomic model or the clinicoradiologic model alone and the model may help to guide individualized treatment in these patients.Acknowledgements
We acknowledge financial support from Special Funds for Public Welfare Projects (201402019), Beijng Science and Technology Program (Z161100000516101, Z161100002616022) , Beijing Hope Run Special Fund of Cancer Foundation of china (LC2016A05), National Natural Science Foundation of China (81227901, 61231004, 81771924, 81501616, 81671851, 81527805, and 81501549), the special program for science and technology development from the Ministry of science and technology, China (2017YFA0205200, 2017YFC1308701, 2017YFC1309100, 2016CZYD0001), the Science and Technology Service Network Initiative of the Chinese Academy of Sciences (KFJ-SW-STS-160), and the Youth Innovation Promotion Association CAS.References
1. Sauer R, Becker H, Hohenberger W, et al.. Preoperative versus postoperative chemoradiotherapy for rectal cancer. N Engl J Med 2004;351: 1731-40.
2. Kickingereder P, Gotz M, Muschelli J, et al.. Large-scale Radiomic Profiling of Recurrent Glioblastoma Identifies an Imaging Predictor for Stratifying Anti-Angiogenic Treatment Response. CLIN CANCER RES 2016;22: 5765-71.
3. Aerts HJ, Velazquez ER, Leijenaar RT, et al.. Decoding tumour phenotype by noninvasive imaging using a quantitative radiomics approach. NAT COMMUN 2014;5: 4006.
4. Tibshirani R. The lasso method for variable selection in the Cox model. STAT MED 1997;16: 385-95.
Figures