4718
Increased small bowel permeability is associated with significantly increased T2 measures of the small bowel wall.1Sir Peter Mansfield Imaging Centre, University of Nottingham, Nottingham, United Kingdom, 2National Institute for Health Research (NIHR) Nottingham Biomedical Research Centre at the Nottingham University Hospitals NHS Trust and University of Nottingham, Nottingham, United Kingdom, 3Nottingham Digestive Diseases Centre, University of Nottingham, Nottingham, United Kingdom, 4Centre for Analytical Bioscience, School of Pharmacy, University of Nottingham, Nottingham, United Kingdom
Synopsis
Available techniques to measure in-vivo bowel permeability are inadequate for stratifying patients to identify those at risk of complications. T2 weighted measurements in Crohn’s disease are sensitive markers of small bowel wall structural changes and could potentially be indicators of permeability. We have developed quantitative T2 measures of the small bowel wall to characterize changes associated with increased permeability induced by indomethacin. We found a significant increase in quantitative measures of T2 of the small bowel wall associated with increased permeability provoked by indomethacin.
Introduction
Increased small bowel (SB) permeability results in bacterial translocation which is thought to result in significant adverse outcomes in several diseases (e.g. Cirrhosis and Crohn’s disease1). Available techniques for measuring in-vivo bowel permeability2,3 are inadequate, the current gold standard is the lactulose/mannitol urinary excretion ratio (LMR) but it is inconsistently reported, time consuming and currently restricted to research centres. In Crohn’s disease the T2 of the gut wall has been demonstrated to be a sensitive marker of changes associated with inflammation4. We hypothesized that this might be an indicator of permeability.
Aim: to measure changes in T2 of the SB wall in healthy participants on administration of indomethacin (known to increase bowel wall permeability5).
Methods
Healthy participants (N=24) were enrolled on a 2x2 double blind provocation study consisting of two arms: a placebo and indomethacin (75mg taken 16 hours prior and on the morning of the scan day) with >2 weeks washout time between arms. Two participants were removed, (one noncompliance and one incidental finding), leaving 8m/14f age 18-41y (mean 24y). Prior to MRI, participants underwent a 2 hour LMR test for comparison. Participants were given 1L of oral bowel preparation. To reduce SB motion, 20mg of Buscopan® was administered intravenously two minutes before T2 measurement scan was acquired (Figure 1).
The SB wall is generally very thin (~2.5mm), therefore a novel method for analyzing the data in Matlab was developed. The data was analyzed in three restricted regions to limit the required motion correction. 2D non-linear motion correction was applied to each region separately. Edge detection and thresholding were then applied to isolate the SB wall at each TE and the resulting masks were combined to isolate sections of the SB wall which had consistent spatial location across all TEs. The segments were then divided into smaller regions of interest (ROIs: 20-100 voxels) to allow heterogeneity to be investigated. Participants in which three or less small ROIs in total were identified were removed from the study (N=3). To overcome partial volume effects, the ROI data was fitted to a two-component model (SB wall and content), with the T2 of the contents taken from a separate fit of an adjacent contents ROI chosen for each segment. The fit took account of the full bTFE readout6.
Results
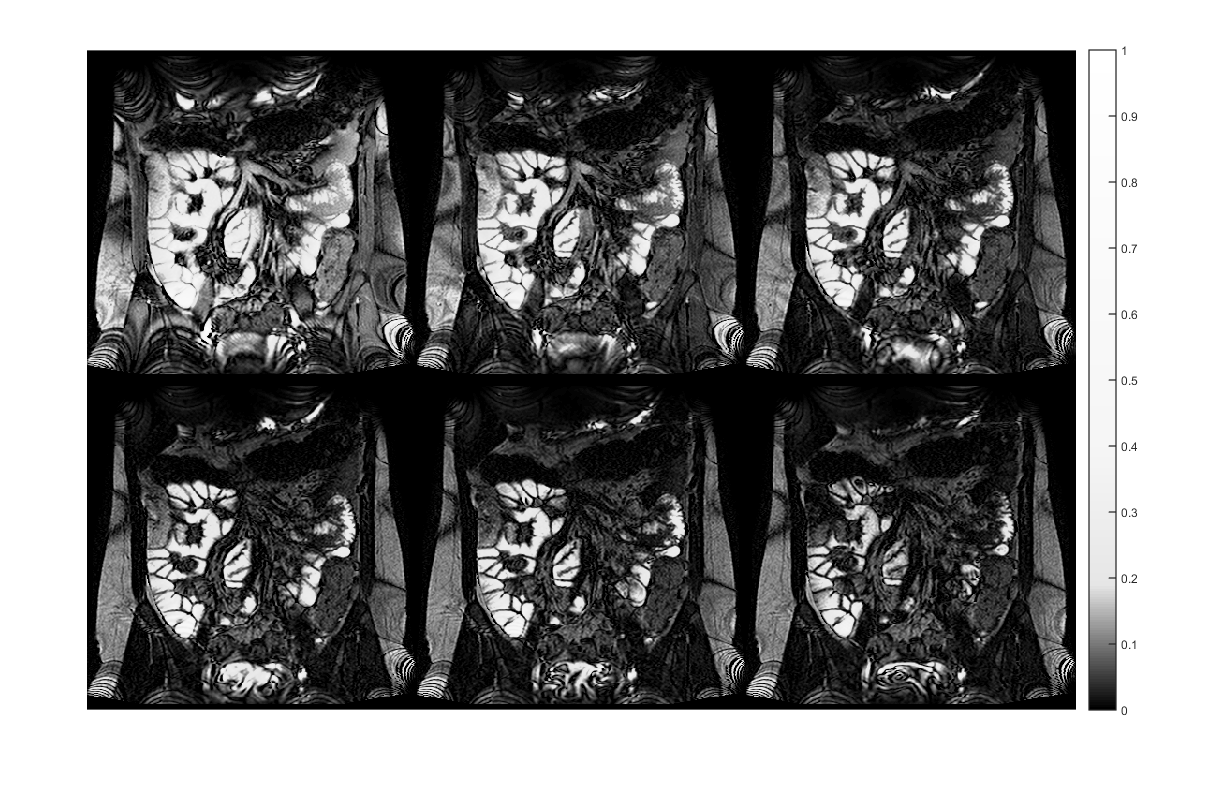
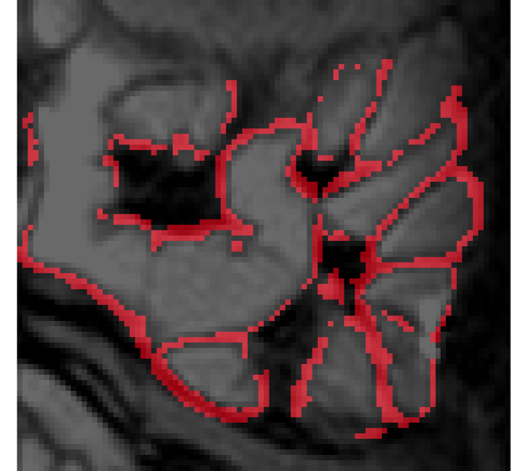
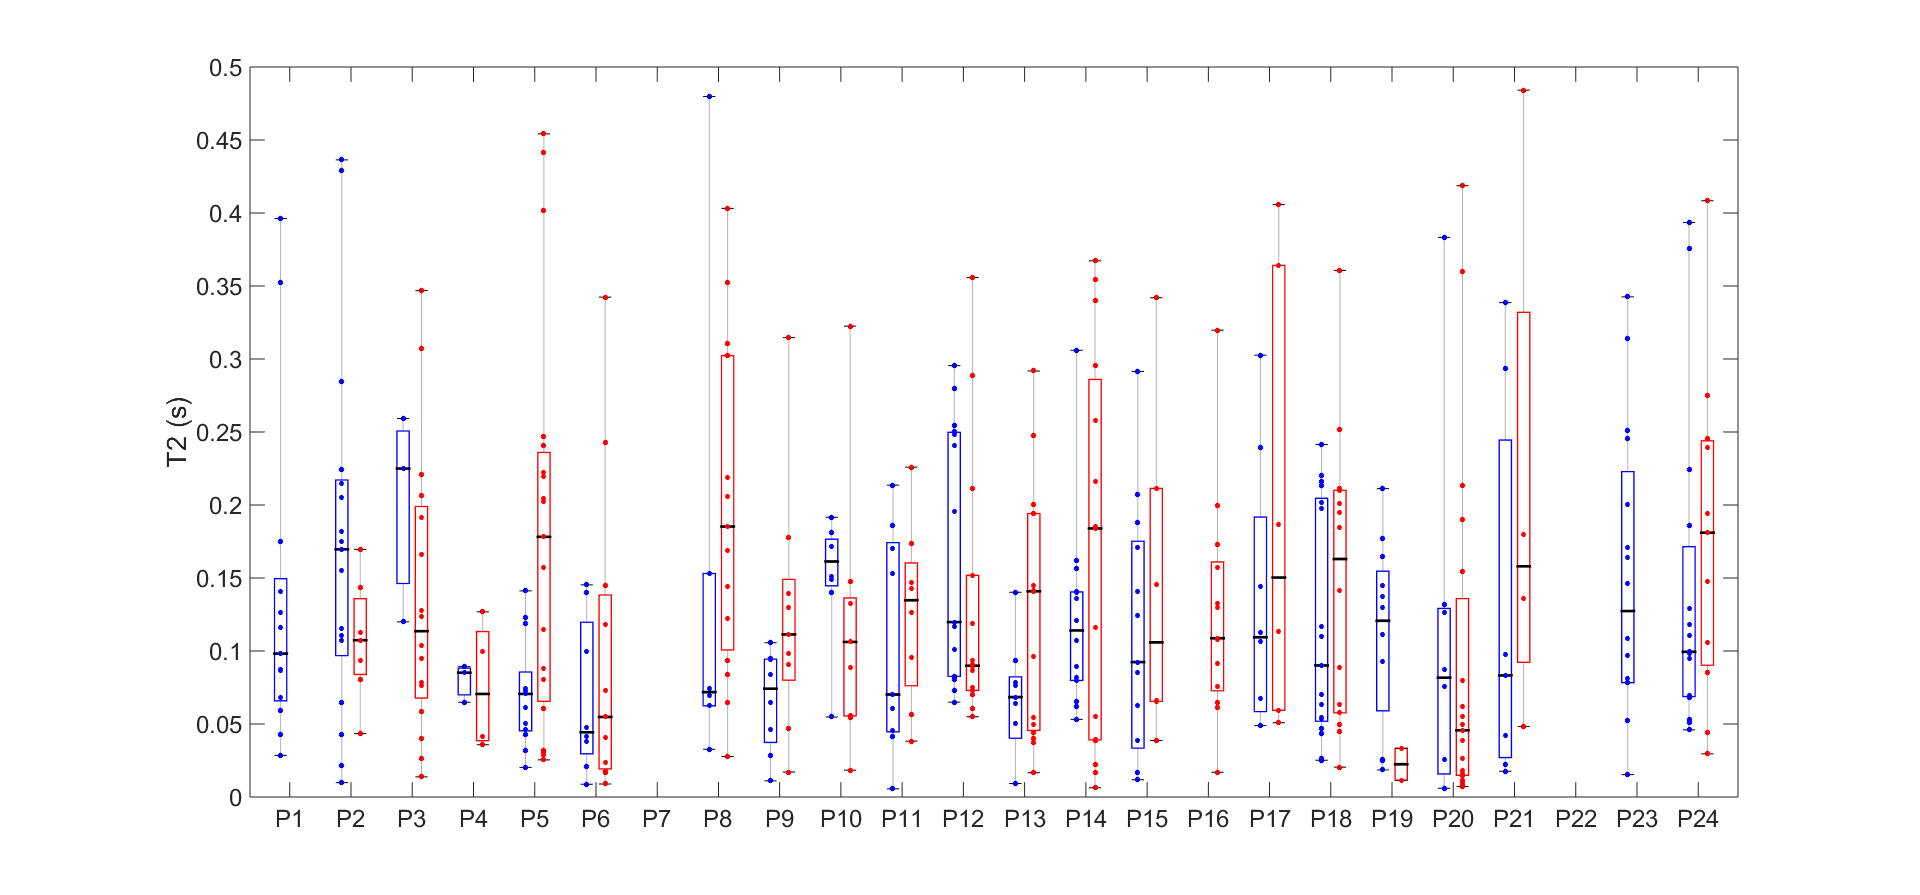
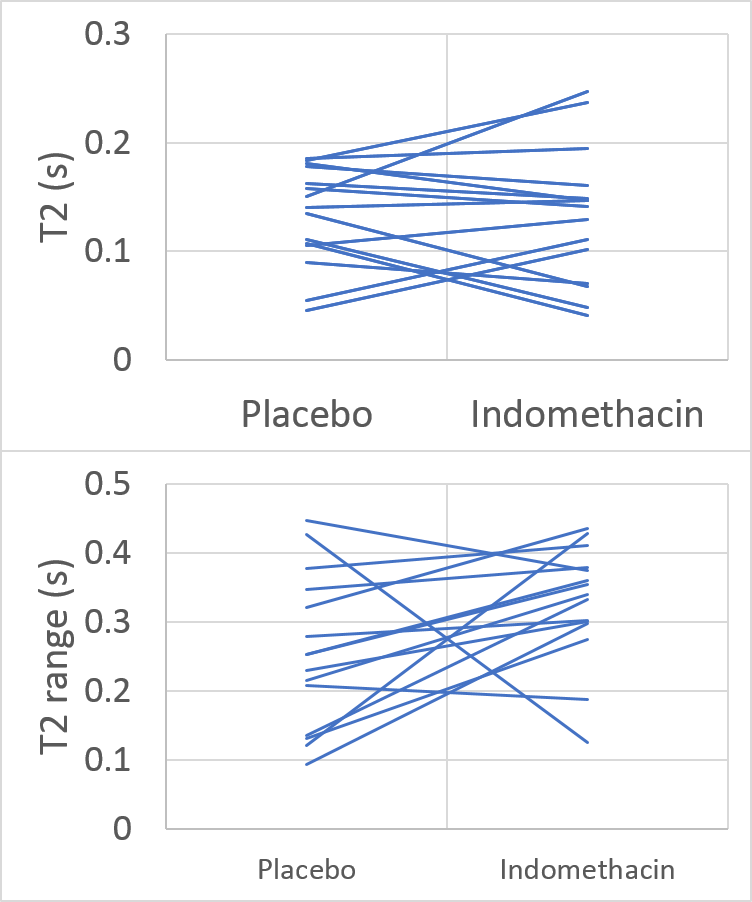
Figure 2 shows the T2 decay in the abdomen from images at different TEs. Figure 3 shows an example SB wall mask. Figure 4 shows the individual T2 measurements with median and interquartile range across the multiple ROIs. Figure 5 shows that compared to placebo, on indomethacin there was a significant increase in T2 (averaged over all ROIs) (p=0.017, Wilcoxon ranked sign test) and increase in intra subject range (i.e. T2 heterogeneity p=0.03). The T2 results did not correlate with the LMR test results.Discussion
We have developed a procedure for measuring T2 in the unthickened healthy SB wall and shown that MRI can detect a heterogeneous increase in T2 after indomethacin which is known to cause increased bowel permeability. The change in T2 is probably related to inflammation. The increased intra subject range suggests that indomethacin does not uniformly act along the SB wall and the increase in the inter subject range may indicate different susceptibilities to indomethacin. The lack of correlation between the MRI results and the LMR test is expected since the LMR is inconsistently reported, is not a continuous outcome variable and is sensitive to whole bowel permeability not just the SB. The main limitation of the study was the low number of ROIs that could be drawn. A posterior slice was chosen for reproducibility between visits, but a more anterior slice would allow a larger section of SB wall to be interrogated. Work is currently underway to evaluate the inter-observer and intra-subject reproducibility of these measurements. The large spread of T2 values in both arms may be explained by the varying structure of the SB wall. The novel method of mapping the SB wall is not restricted to T2 weighted images but can be applied to any images in which the SB content and wall have a different signal intensity. The development of this method will allow for other quantitative measures of the healthy SB wall to be made.Conclusion
We have developed a novel procedure for measuring T2 in the healthy SB wall and have detected a significant increase in absolute and range of T2 under provocation with indomethacin, which is likely to be related to increased SB permeability.Acknowledgements
Medical Research Council, NIHR Nottingham Biomedical Research Centre, Nottingham Hospitals Charity and Nottingham University Hospitals NHS Trust.References
1. Wiest, R. and G. Garcia-Tsao, Bacterial translocation (BT) in cirrhosis. Hepatology, 2005. 41(3): p. 422-33.
2. Camilleri, M., et al., Understanding Measurements of Intestinal Permeability in Healthy Humans with Urine Lactulose and Mannitol Excretion. Neurogastroenterology and motility : the official journal of the European Gastrointestinal Motility Society, 2010. 22(1): p. e15-e26.
3. Dunlop, S.P., et al., Abnormal intestinal permeability in subgroups of diarrhea-predominant irritable bowel syndromes. Am J Gastroenterol, 2006. 101(6): p. 1288-94.
4.Church, P.C., et al., Systematic review with meta-analysis: magnetic resonance enterography signs for the detection of inflammation and intestinal damage in Crohn's disease. Aliment Pharmacol Ther, 2015. 41(2): p. 153-66.
5. Vanuytsel, T., et al., Psychological stress and corticotropin-releasing hormone increase intestinal permeability in humans by a mast cell-dependent mechanism. Gut, 2014. 63(8): p. 1293-9.
6. Hoad, C.L., E.F. Cox, and P.A. Gowland, Quantification of T2 in the abdomen at 3.0 T using a T2-prepared balanced turbo field echo sequence. Magnetic Resonance in Medicine, 2010. 63(2): p. 356-364.
Figures