4712
Automated Localization and Segmentation of Locally-Advanced Rectal Cancer Based on T2, DWI and DCE Multi-Parametric MRI Using Deep LearningYang Zhang1, Liming Shi2, Xiaonan Sun2, Tianye Niu2, Ning Yue3, Peter Chang4, Daniel Chow1, Melissa Khy1, Tiffany Kwong1,3, Jeon-Hor Chen1, Min-Ying Su1, and Ke Nie3
1Department of Radiological Sciences, University of California, Irvine, CA, United States, 2Department of Radiation Oncology, Sir Run Run Shaw Hospital, Zhejiang University School of Medicine, Hangzhou, China, 3Department of Radiation Oncology, Rutgers-The State University of New Jersey, New Brunswick, NJ, United States, 4Department of Radiology, University of California, San Francisco, CA, United States
Synopsis
A deep learning method using the convolutional neural network (CNN) was implemented to segment rectal cancer in 48 patients. Six sets of images (one T2, Two DWI, three DCE) were used as inputs. The Dice Similarity Coefficient (DSC) was used to evaluate results generated by the CNN algorithm compared to the manually outlined ground truth. When the search was done on the entire image the mean DSC was 0.64, and the errors were mainly from tissues outside the rectum. The rectum could be easily segmented, and when the search was confined within 1.5 times of rectal area, the DSC was improved to 0.75.
Introduction:
Multi-Parametric MRI can provide detailed information for characterization of rectal cancer. The typical MRI protocol included T2, DWI and DCE-MRI, which can be used for assessment of anatomic, cellular, and vascular information from the entire tumor. For patients with locally advanced rectal cancer, chemoradiation therapy (CRT) followed by surgery is the standard of care. A follow-up MRI can be performed during the course of CRT treatment to evaluate changes, which can provide helpful information to decide whether additional treatment is need. A final post-treatment MRI can be performed to evaluate the extent of residual disease for choosing the most appropriate surgery. Tumor size changes are known as the most reliable response predictor [1,2]; but more sophisticated radiomics analysis can be applied to extract many imaging features to predict pathologic response, even based on pre-treatment MRI before starting of the CRT [3,4]. These analyses rely on the outlining of the tumor region of interest (ROI), typically performed manually by experienced radiologists, which is very time consuming and thus unlikely to be implemented into daily clinical practice. Developing an efficient and reliable rectal tumor segmentation method will provide a very useful tool. In recent years, deep learning models have been widely applied with impressive results. The convolutional neural networks (CNN) can learn feature representations automatically from the training data, which can then be applied for tumor detection and segmentation, as in a recent study by Trebeschi et al. [5]. In their study, only T2 and DWI were used. The purpose of this study is to implement deep learning methodology using T2+DWI+DCE, to test the accuracy and limitations in localization and segmentation of rectal cancer.Methods:
A total of 48 patients (mean age = 59, 33 males and 16 females) with stage T3 and T4 locally-advanced rectal cancer were studied. All patients received MR examinations before starting chemoradiation therapy, and only this pre-treatment MRI was used in this study. The MRI was done on a 3.0 Tesla scanner (GE Signa HDxt) using a phased-array body coil. The imaging protocol included T2w, DWI (SSEPI; TR/TE 5,900/69.6 ms; image resolution: 0.98 × 0.98 × 5 mm; 2 mm intersection gap) with two b-factors of 0 and 800 s/mm2, and DCE-MRI (LAVA; TR/TE 4.4/1.9 ms; flip angle 12°; bandwidth 325.5 kHz; image resolution: 0.7 × 0.7 × 2 mm). Tumors were manually outlined on the 60 seconds post-contrast images as the ground truth. These images were co-registered and normalized as inputs for CNN. The background was divided into three regions as used in Ref [5]: the hyper-intense region on DWI (b=800); the region surrounding the tumor in a 1 cm radius; and the remaining area. The patches extracted from these regions are illustrated in Figure 1. If N patches were extracted inside the tumor ROI, to balance the data, N patches were extracted from the non-lesion region (N/2 voxels from the first region, and N/4 voxels from the second and third regions). The architecture of CNN is shown in Figure 2. The loss function is cross entropy and the optimizer is Adam with learning rate 0.001 [6].Results:
Ten-fold cross-validation was used to evaluate the performance of the CNN segmentation. Three examples are shown in Figures 3-5. The Dice Similarity Coefficient (DSC) was used to evaluate the segmentation results with the manually-outlined ROI as the ground truth. When the search was done on the entire image, the mean DSC was 0.64, and the errors were mainly from tissues outside the rectum as illustrated in case examples. The rectum could be easily segmented using non-rigid Demons algorithm based on the boundary traced on one slice. When the search of rectal cancer was confined within 1.5 times of rectal area, the DSC was improved to 0.75.Conclusions:
Developing an efficient and reliable rectal cancer segmentation method may allow for characterization of various properties of tumor on multi-parametric MRI. This may provide clinically helpful information for selecting the optimal treatment strategies based on the aggressiveness of the tumor, or for guiding treatments such as neoadjuvant CRT followed by specific type of surgery. In this study, we tested a convolutional neural network (CNN) previously reported by Trebeschi et al. [5]. Due to the complicated background signal intensity on rectal MRI, segmentation in the pelvic is much more challenging compared to other organs (e.g. brain, breast, lung, liver, etc. with more uniform tissue structures). However, since the rectum can be easily segmented, when the search is confined within the rectal area, the DSC can be improved substantially.Acknowledgements
This study is supported in part by NIH R01 CA127927 and Rutgers-RBHS precision medicine pilot grant, The Rutgers-Cancer Institute of New Jersey P30 CA072720.References
[1] Kim YH, Kim DY, Kim TH, Jung KH, Chang HJ, Jeong SY, Sohn DK, Choi HS, Ahn JB, Kim DH, Lim SB. Usefulness of magnetic resonance volumetric evaluation in predicting response to preoperative concurrent chemoradiotherapy in patients with resectable rectal cancer. International Journal of Radiation Oncology* Biology* Physics. 2005 Jul 1;62(3):761-8. [2] Seierstad T, Hole KH, Grøholt KK, Dueland S, Ree AH, Flatmark K, Redalen KR. MRI volumetry for prediction of tumour response to neoadjuvant chemotherapy followed by chemoradiotherapy in locally advanced rectal cancer. The British journal of radiology. 2015 May 28;88(1051):20150097. [3] Nie K, Shi L, Chen Q, Hu X, Jabbour SK, Yue N, Niu T, Sun X. Rectal Cancer: Assessment of Neoadjuvant Chemoradiation Outcome based on Radiomics of Multiparametric MRI. Clin Cancer Res. 2016 Nov 1;22(21):5256-5264. [4] Liu Z, Zhang XY, Shi YJ, Wang L, Zhu HT, Tang ZC, Wang S, Li XT, Tian J, Sun YS. Radiomics Analysis for Evaluation of Pathological Complete Response to Neoadjuvant Chemoradiotherapy in Locally Advanced Rectal Cancer. Clin Cancer Res. 2017 Sep 22. [Epub ahead of print] [5] Trebeschi S, van Griethuysen JJ, Lambregts DM, Lahaye MJ, Parmer C, Bakers FC, Peters NH, Beets-Tan RG, Aerts HJ. Deep Learning for Fully-Automated Localization and Segmentation of Rectal Cancer on Multiparametric MR. Scientific Reports. 2017 Jul 13;7(1):5301. [6] Kingma D, Ba J. Adam: A method for stochastic optimization. arXiv preprint arXiv:1412.6980. 2014 Dec 22.Figures
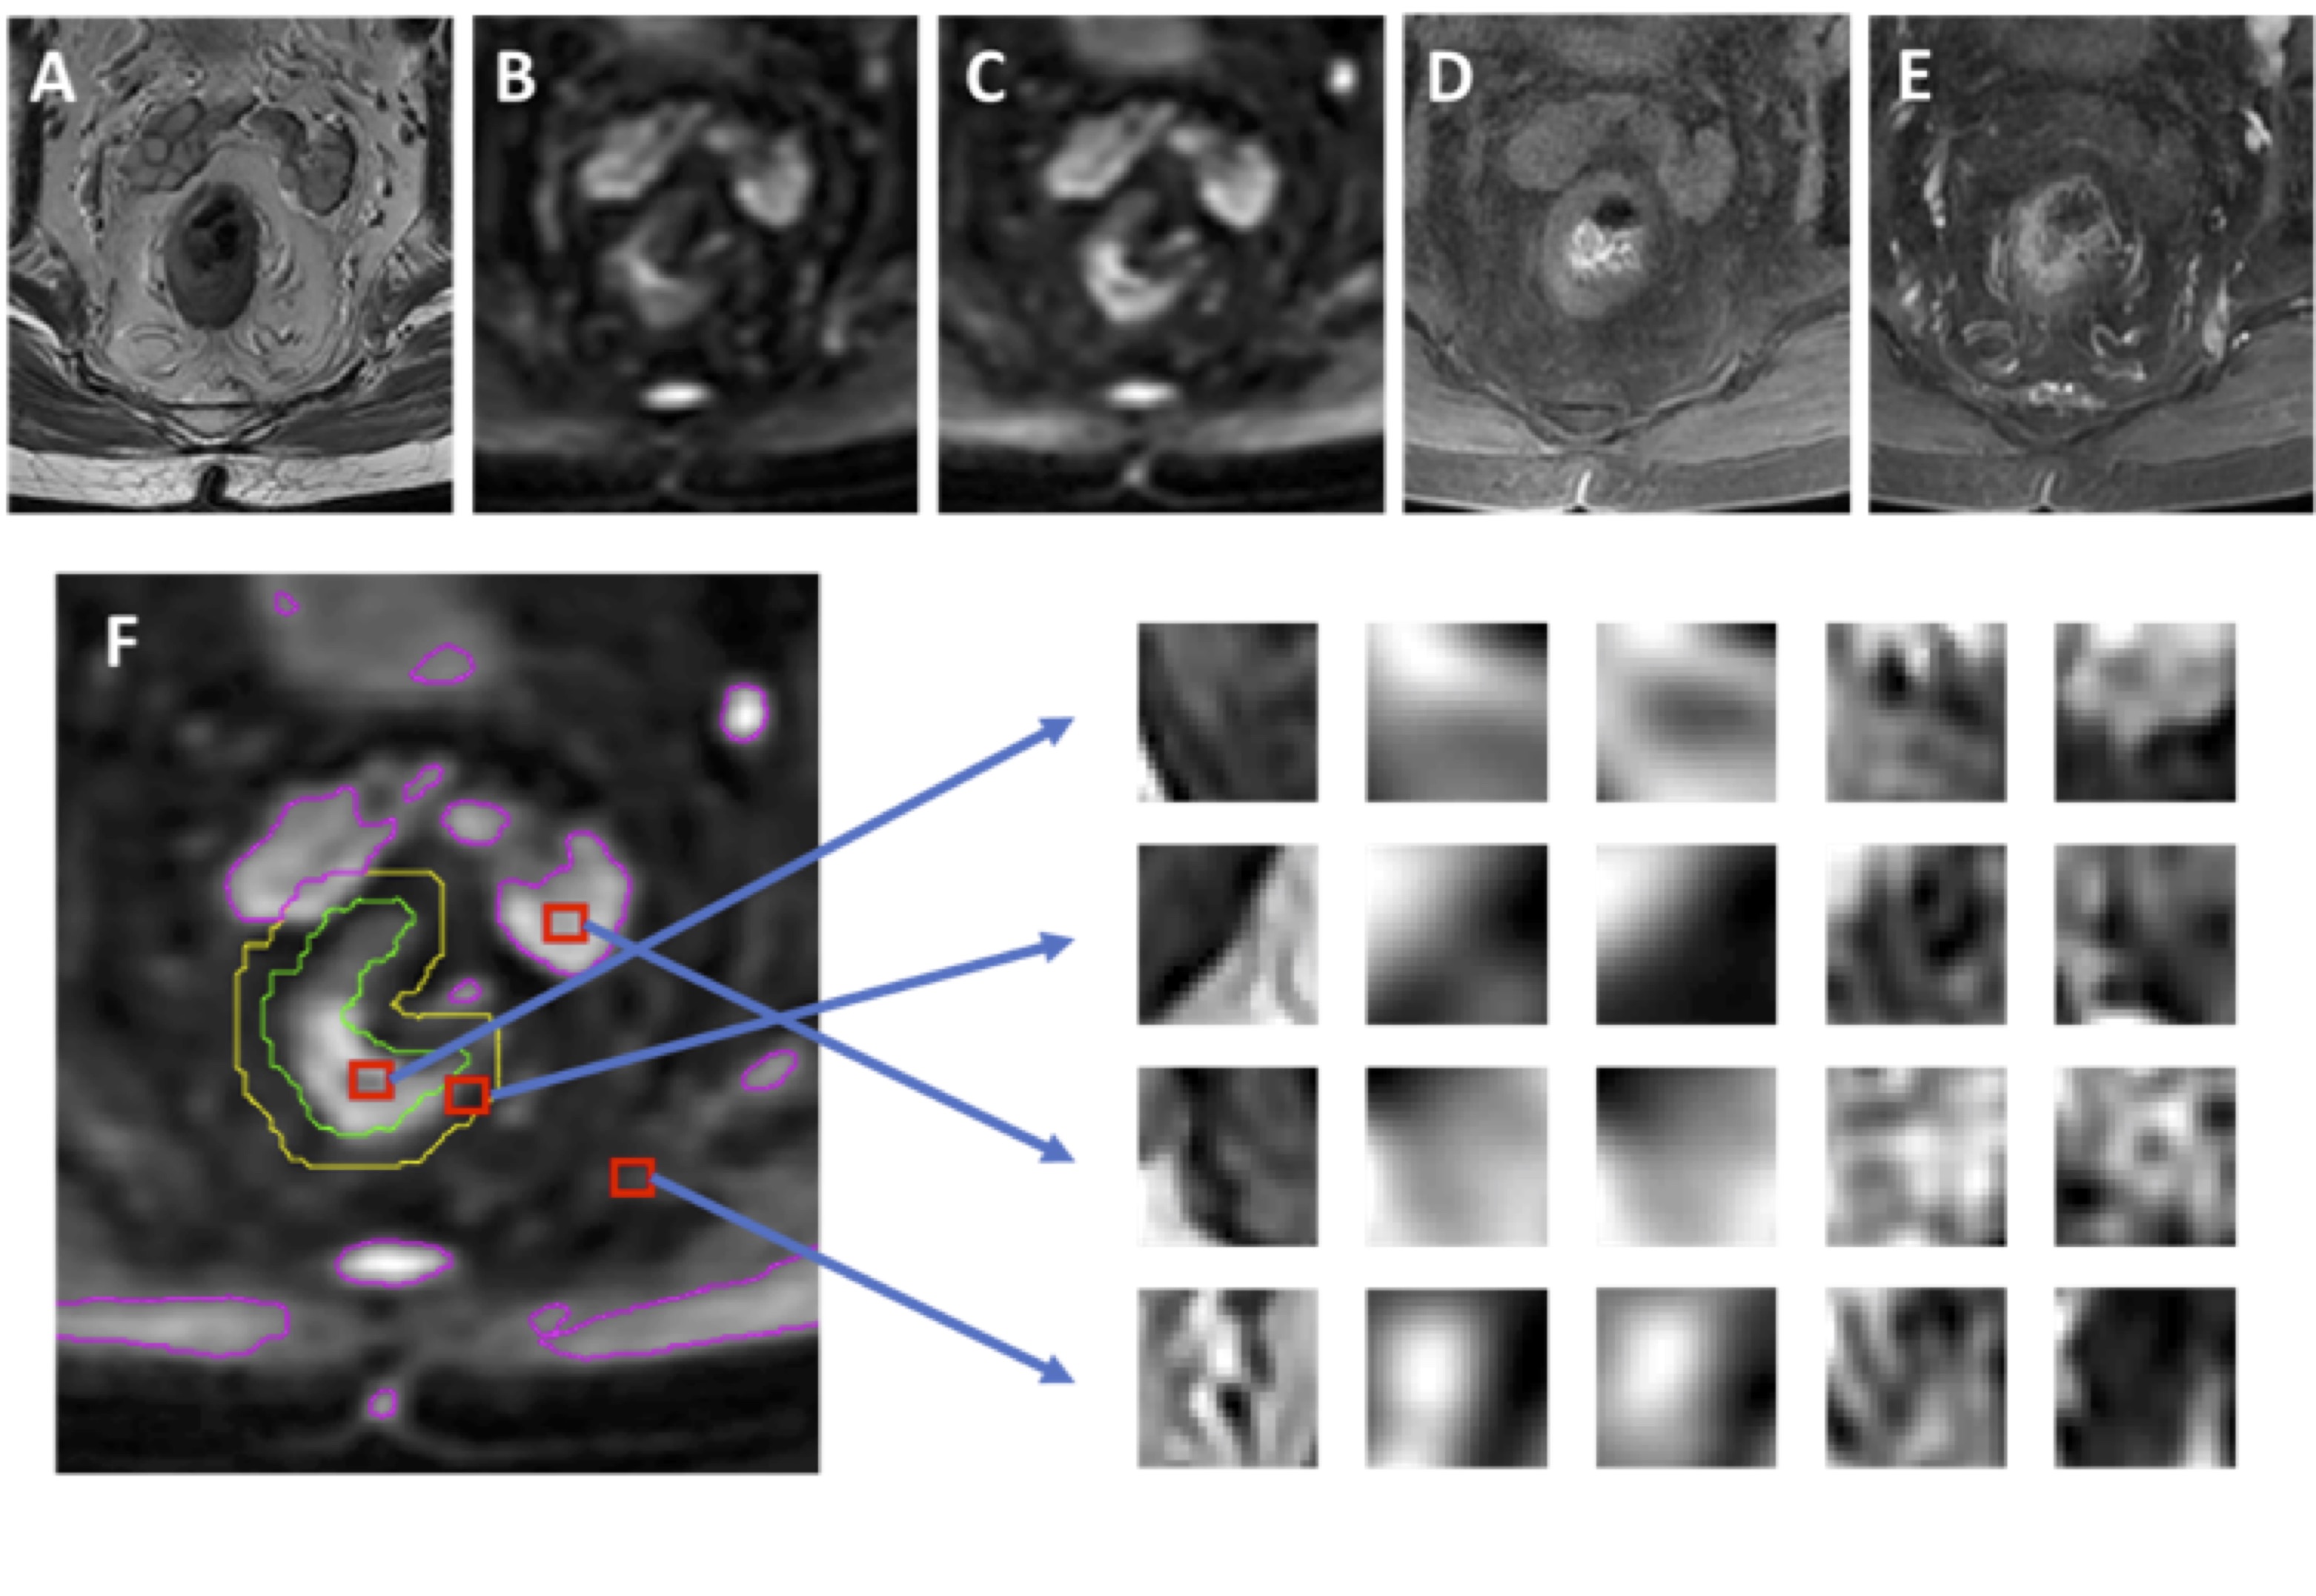
Figure 1: An example from 80-year-old male patient with
lower-rectum cancer (A) T2-weighted image, (B) DWI with b = 0, (C) DWI with
b=800, (D) pre-contrast image, (E) 60 seconds post-contrast image. (F) The tumor
(green) is manually outlined. The background is divided into three regions as
used in Ref [5]: the first (magenta) is the hyper-intense region on DWI
(b=800); the second (yellow) is the region surrounding the tumor in a 1 cm
radius; and the third is the remaining area. Examples of extracted patches from
the tumor and three non-lesion regions corresponding to (A-E) images are shown.
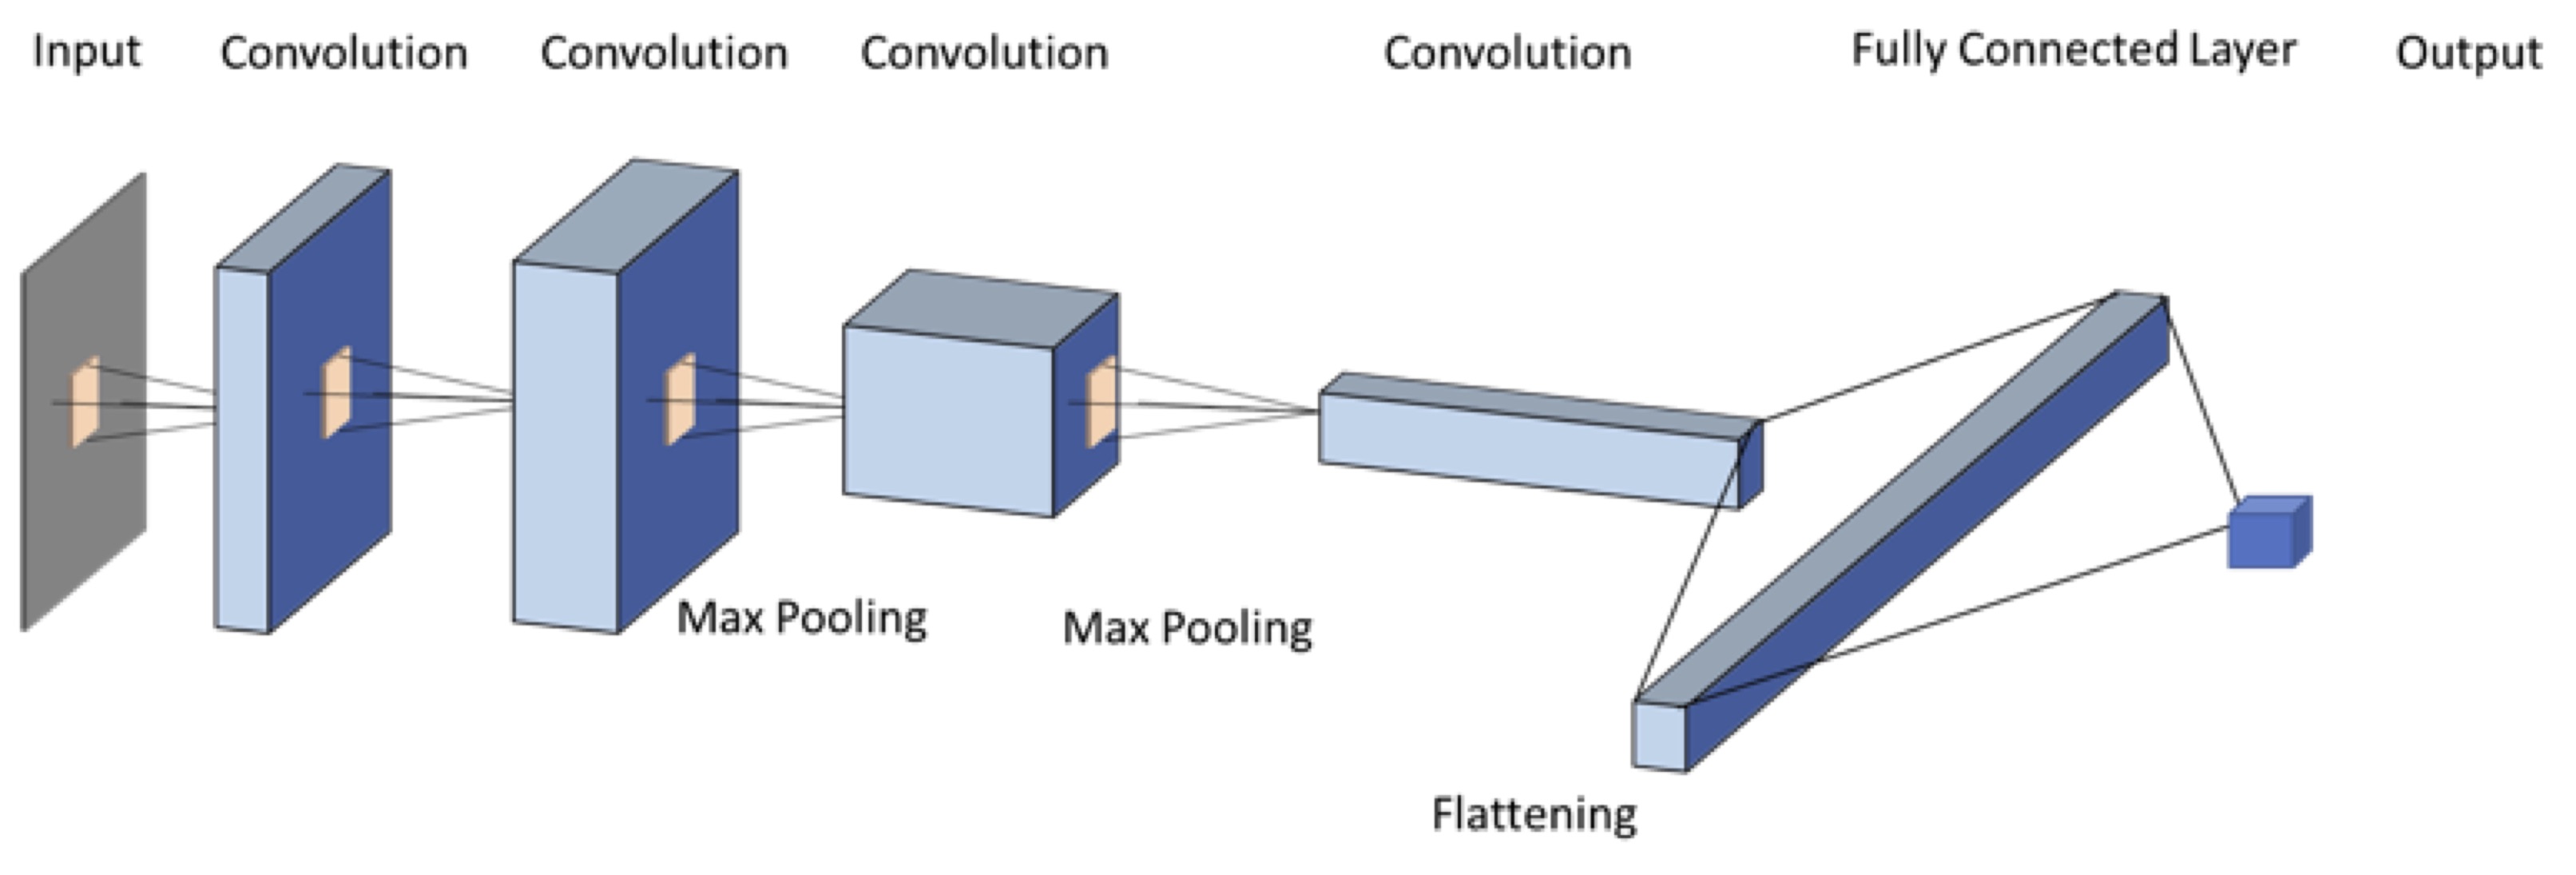
Figure 2: CNN architecture using 6 sets of images as
inputs (T2, two DWI: b=0, 800 s/mm2, three DCE: one pre-, two post-contrast).
The gray rectangle represents 3X3 convolutional kernel. 24 features are used in
the first convolutional layer, and the number doubles in each convolutional
layer (i.e. 24, 48, 96, 192). Dropout of 1/2 is used after the fully connected
layer, and 1/3 after each max pooling layer. ReLu is used for nonlinearity in each layer, except in the output layer,
where a softmax is used instead. Stride two is used in the max pooling.
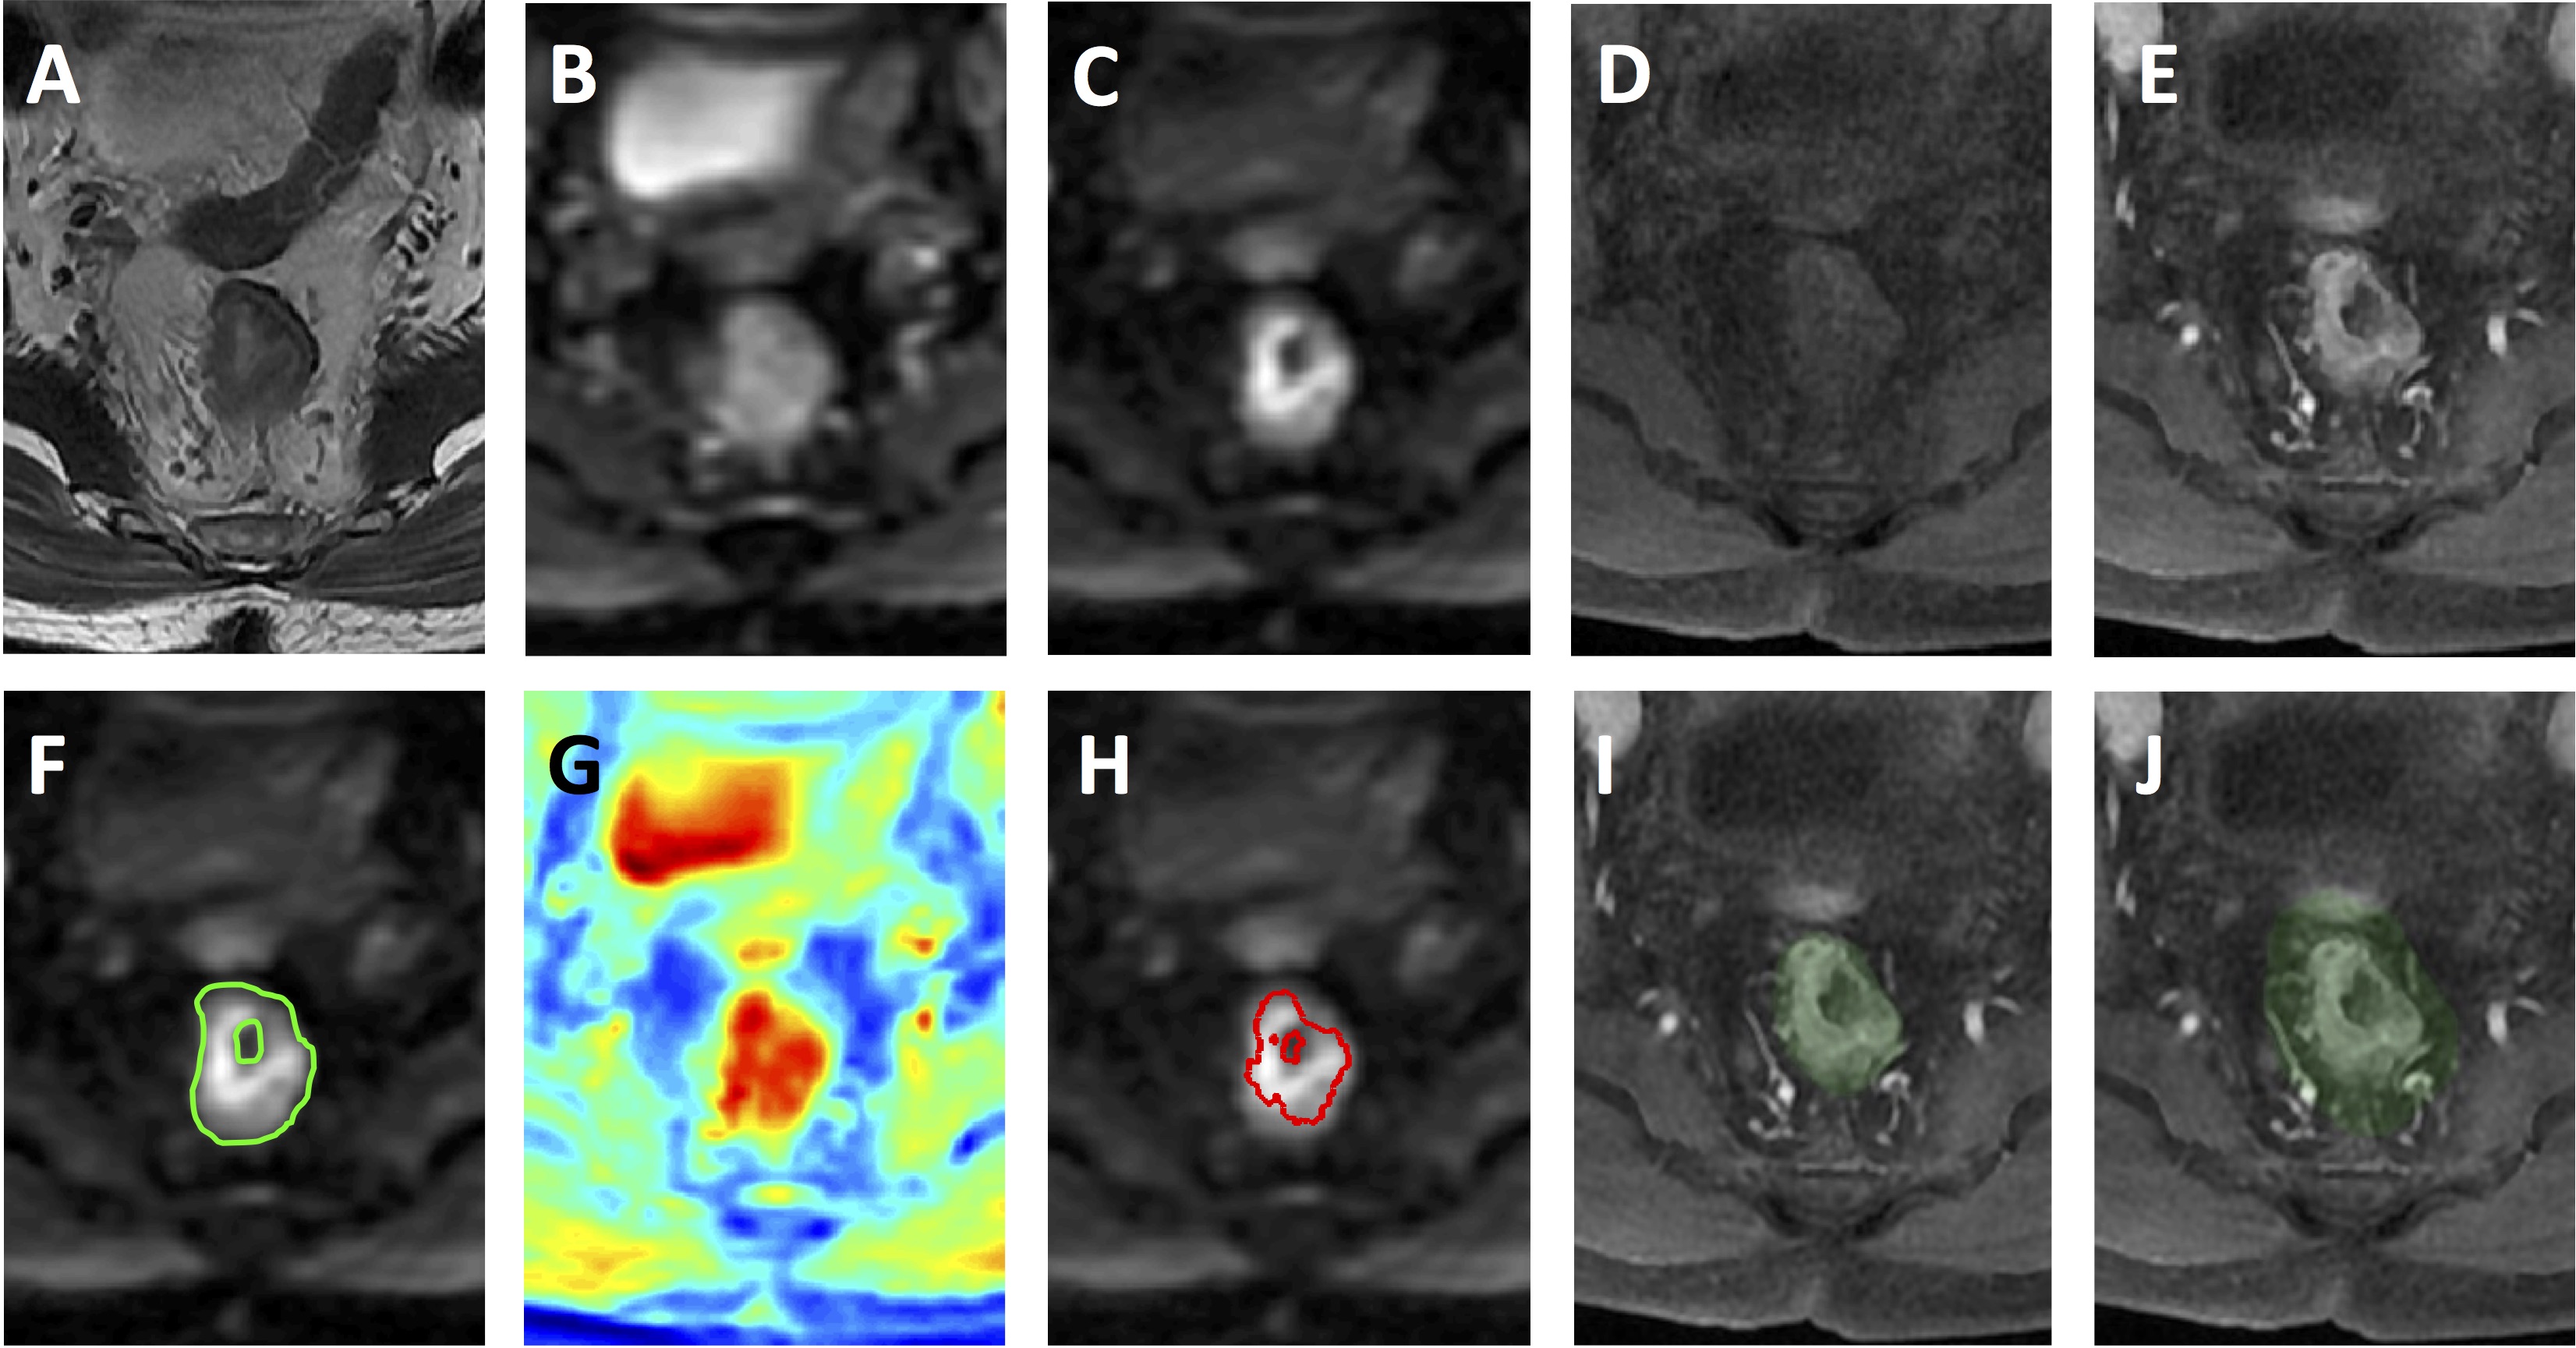
Figure 3: A
case example from a 56-year-old male patient with mid-rectum cancer. (A)
T2-weighted image. (B) DWI with b = 0. (C) DWI with b=800. (D) Pre-contrast
image. (E) Post-contrast image at 60 s after injection. (F) The ground truth tumor
ROI overlaid on DWI b=800 image. (G) The probability map generated by CNN. (H)
The predicted tumor based on threshold of 0.5 on the probability map. (I) The
segmented rectum. (J) The expansion of 1.5 times rectal area used to confine
the tumor segmentation. The wrongly segmented area from the bladder is
eliminated.
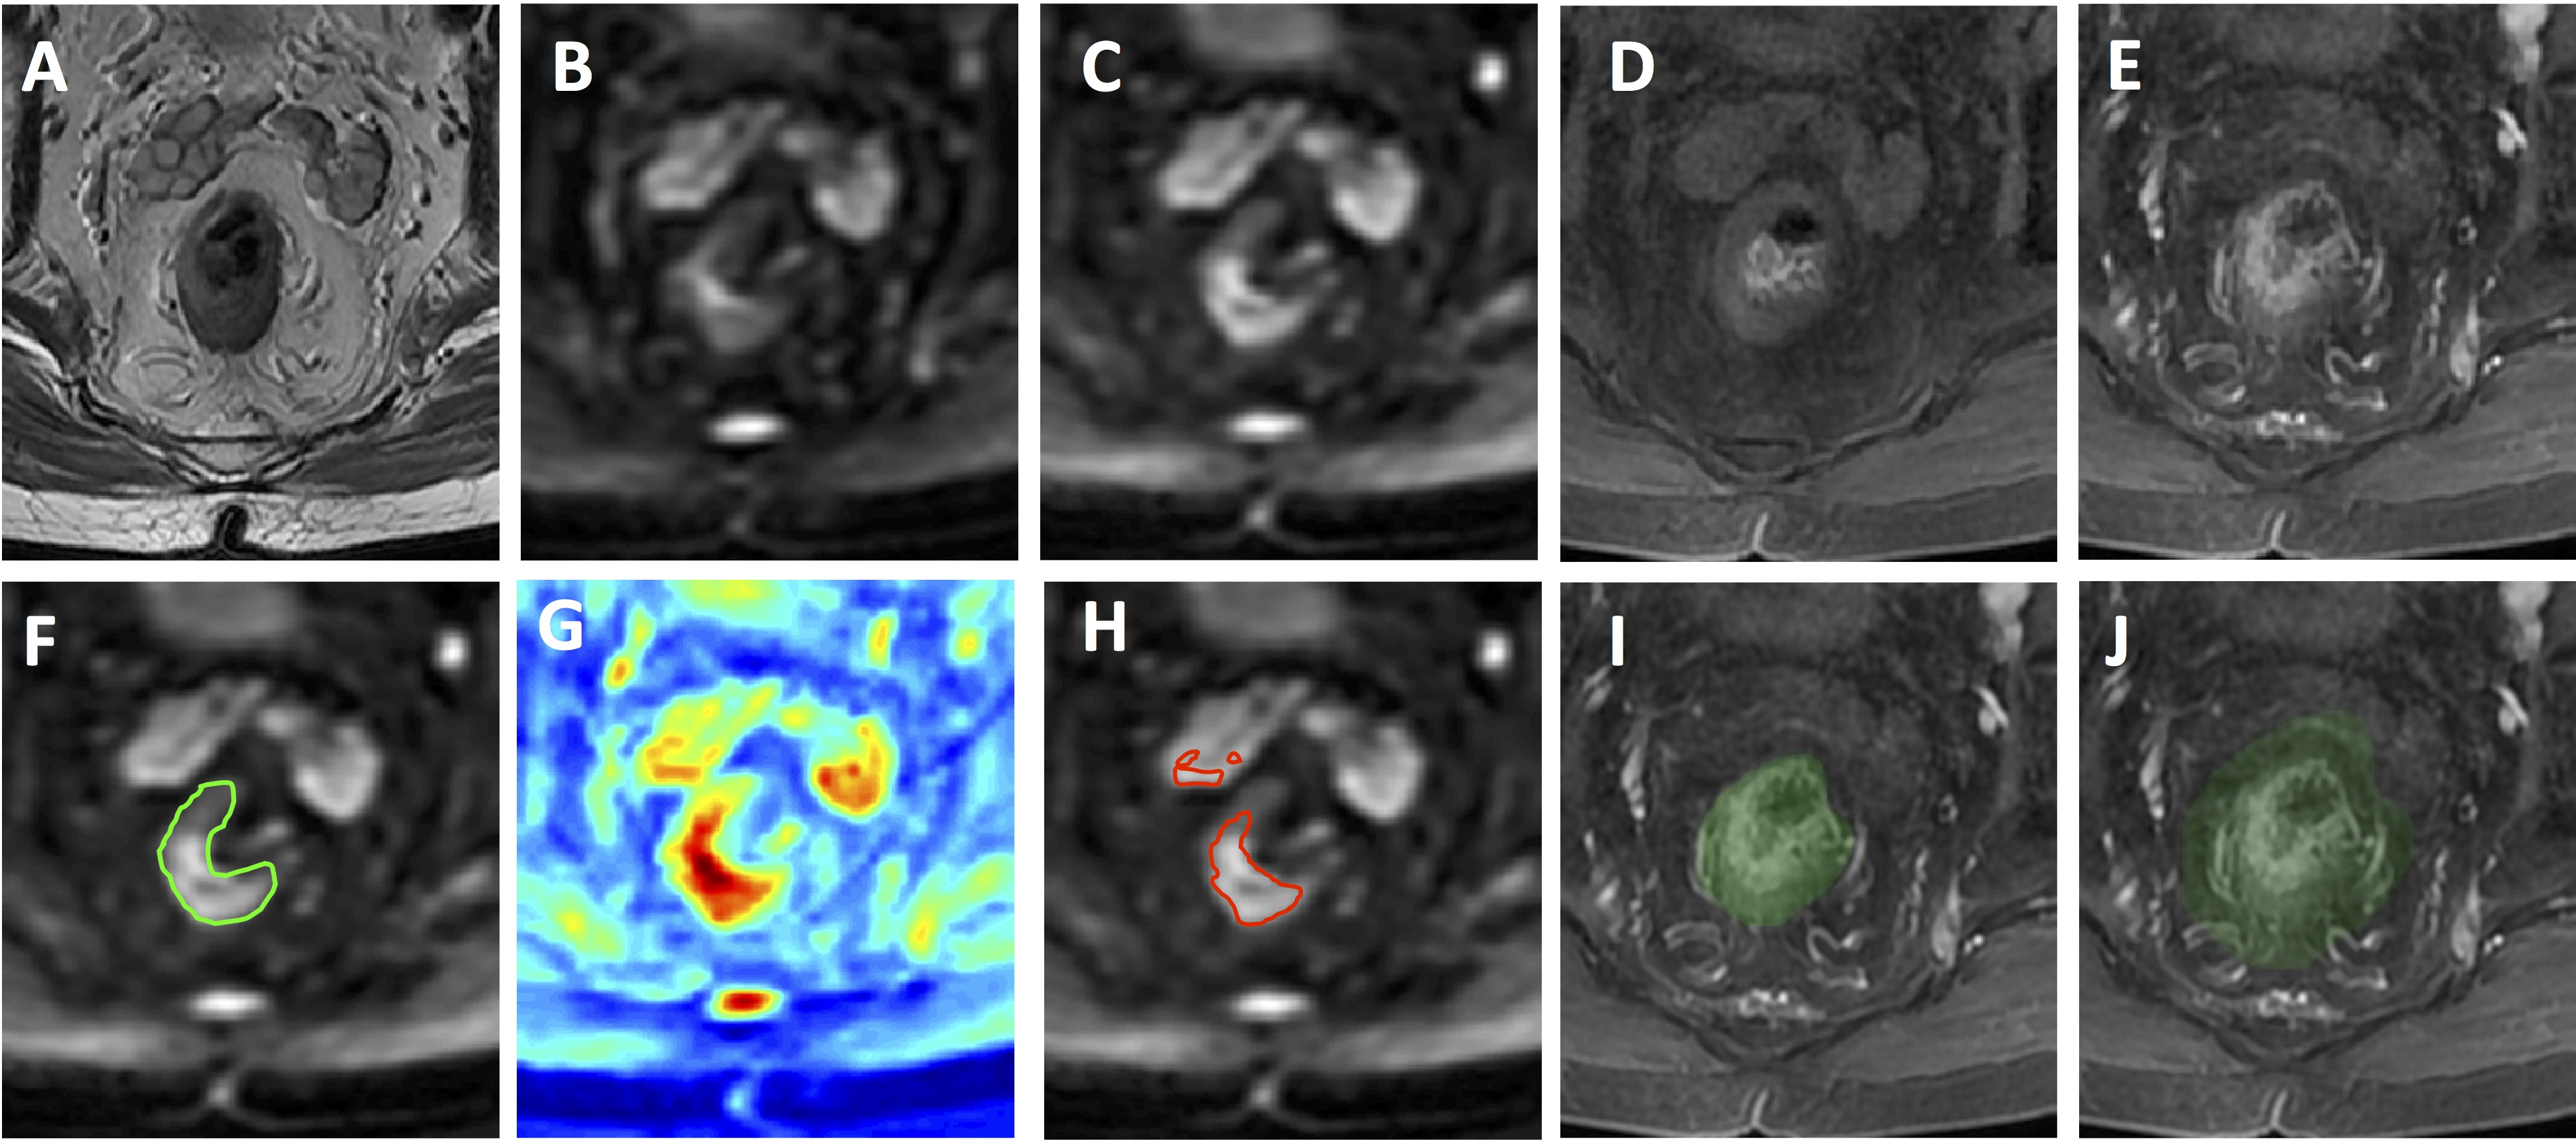
Figure 4: A
case example from an 80-year-old male patient with lower-rectum cancer. (A)
T2-weighted image. (B) DWI with b = 0. (C) DWI with b=800. (D) Pre-contrast
image. (E) Post-contrast image at 60 s after injection. (F) The ground truth tumor
ROI overlaid on DWI b=800 image. (G) The probability map generated by CNN. (H)
The predicted tumor based on threshold of 0.5 on the probability map. (I) The
segmented rectum. (J) The expansion of 1.5 times rectal area used to confine
the tumor segmentation. The wrongly segmented area outside the rectum is
eliminated.

Figure 5: A
case example from a 56-year-old male patient with mid-rectum cancer. (A)
T2-weighted image. (B) DWI with b = 0. (C) DWI with b=800. (D) Pre-contrast
image. (E) Post-contrast image at 60 s after injection. (F) The ground truth tumor
ROI overlaid on DWI b=800 image. (G) The probability map generated by CNN. (H)
The predicted tumor based on threshold of 0.5 on the probability map. (I) The
segmented rectum. (J) The expansion of 1.5 times rectal area used to confine
the tumor segmentation.