4710
Value of whole-tumor histogram-based texture analysis of baseline ADC map in prediction of tumor response to neoadjuvant chemoradiotherapy in locally advanced rectal cancer.1West China Hospital, Sichuan University, Chengdu, China
Synopsis
There has been increasing interest in quantitative methods to excavate more information than traditional descriptive features, facilitated by the availability of texture analysis software platforms. By doing whole-tumor histogram-based texture analysis on pre-treatment ADC map, histogram parameters reflecting the pixel distribution of ROIs were derived. Our study found that LARC that achieved pCR after NCRT appeared less heterogeneous on ADC map and had lower high percentile pre-treatment ADC values. Whole-tumor histogram parameters of pre-treatment ADC map were feasible to predict pCR in LARC, including the absolute value of relative deviation, frequency size, quantile 75%, 90%, and 95% of ADC value histogram.
Introduction
Neoadjuvant chemoradiotherapy (NCRT) following with total mesorectal excision a period later has become the standard of care for the locally advanced rectal cancer (LARC). Some patients can even achieve a pathological complete response (pCR) after NCRT, associated with an improved local control, and increased disease-free survival. Although still controversial, a “wait and watch” policy or a more conservative surgical treatment has been proposed for patients with complete response. 1, 2 Various preoperative variables have been used to predict the grade of tumor response after NCRT but with inconsistent results. It is now acknowledged that tumors may demonstrate considerable biologic heterogeneity that influences their clinical outcome, which can be reflected on medical images. There has been increasing interest in quantitative methods to excavate more information than traditional descriptive features, facilitated by the availability of texture analysis software platforms. 3, 4 Few previous studies have investigated the relationship between patient's outcome after NCRT and tumor heterogeneity assessed by histogram-based texture analysis on pre-treatment ADC map.This study aims to determine the diagnostic performance of ADC map before treatment in predicting pCR after NCRT in LARC by using whole-tumor histogram-based texture analysis.Methods
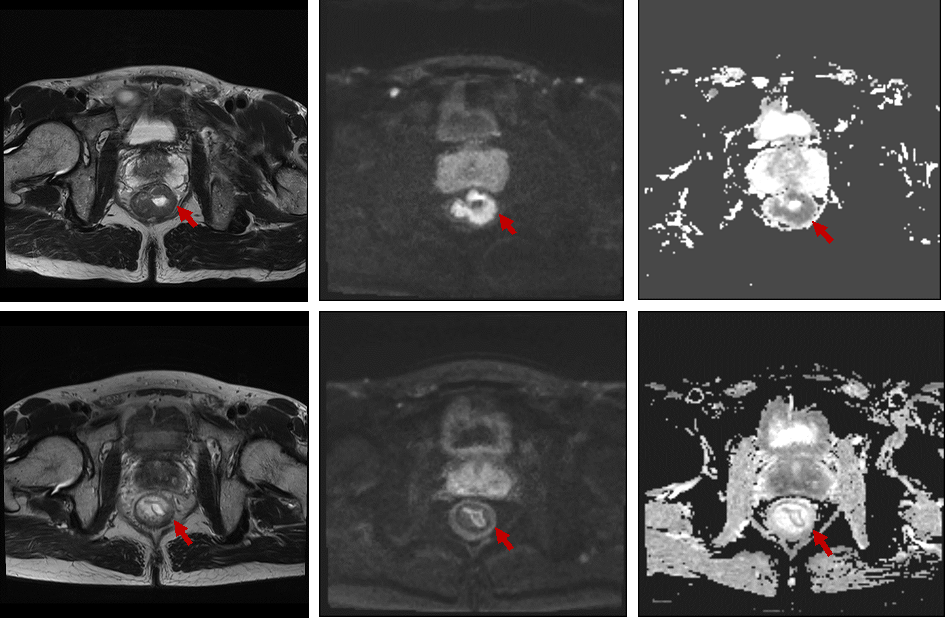
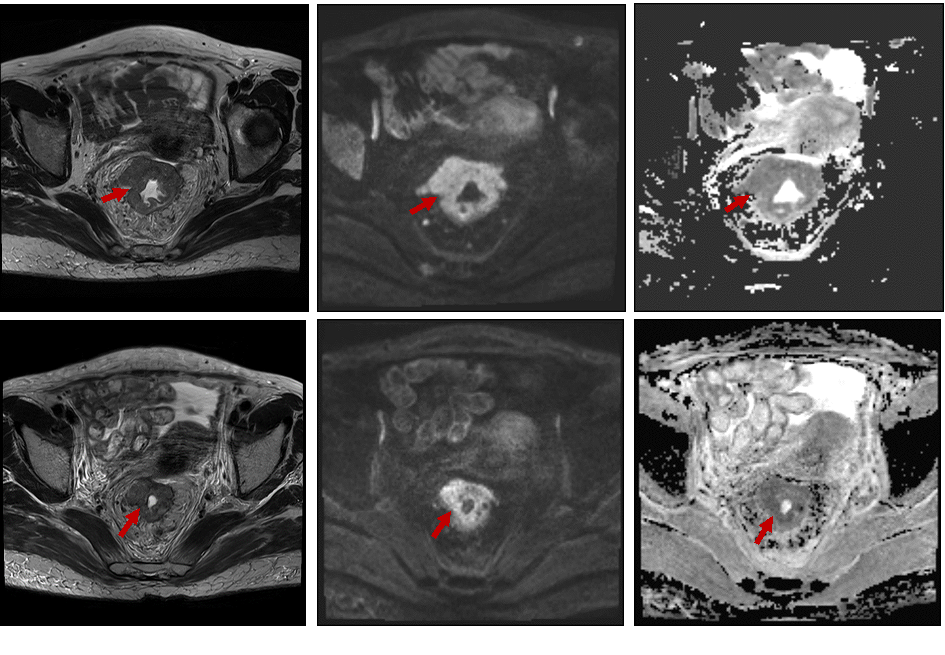
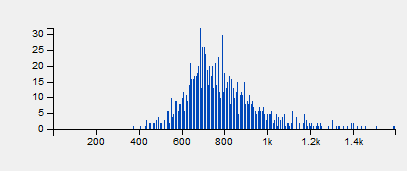
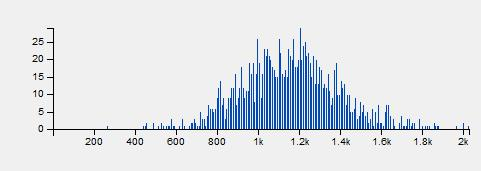
34 patients with LARC (cT3/4 or N+) who have completed neoadjuvant CRT and subsequent surgery were enrolled retrospectively. Histopathologic tumor regression grade was the reference standard. No remaining viable cancer cells in specimen was graded as pathological complete regression (pCR). ROIs covering the whole tumor were manually drawn twice (two weeks interval) on pre-treatment ADC map (b-values: 0, 1000 s/mm2) by one radiologist, blinded to the pathology results, and with T2W and DWI imaging on high b value being the reference. For texture analysis, histogram-based parameters were extracted from the pixel values on ADC map. The intraclass correlation coefficient (ICC) was used to evaluate intraobserver variability. Independent t test was used to compare histogram parameters between pCR and non-pCR group. The diagnostic performance of pre-treatment ADC map for the prediction of pCR was evaluated with receiver operating characteristics (ROC) analysis.Results
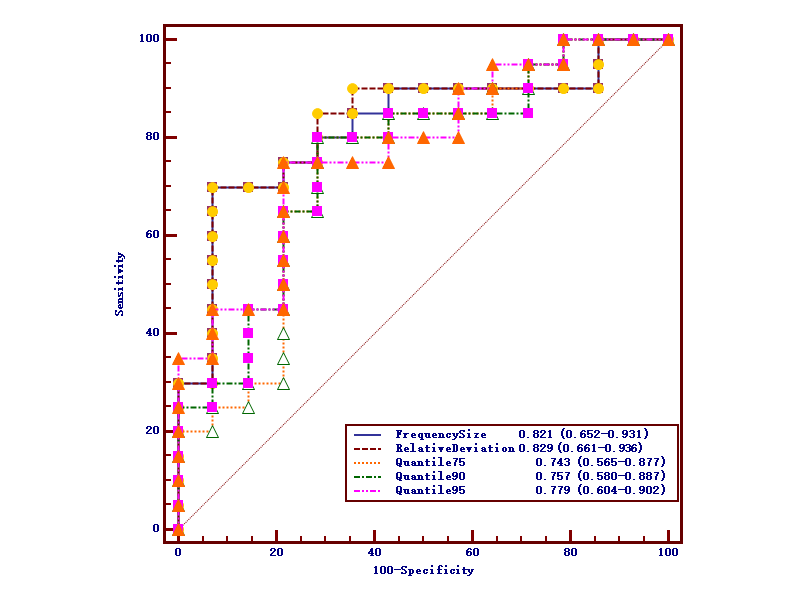
For both measurements, the standard deviation (P1=0.003, P2=0.005), variance (P1=0.006, P2=0.006), range (P1=0.016, P2=0.022), absolute value of relative deviation (P1=0.002, P2=0.005), entropy (P1=0.019, P2=0.022), frequency size (P1=0.006, P2=0.006), quantile 75% (P1=0.024, P2=0.032), quantile 90% (P1=0.01, P2=0.01) and quantile 95% (P1=0.005, P2=0.004) of whole-tumor pre-treatment ADC values were significantly lower in pCR group. And the uniformity of positive pixel distribution (UPP, P1=0.021, P2=0.028) and energy (P1=0.021, P2=0.028) were higher than non-pCR group. Since the intraobserver agreement was good for the absolute value of relative deviation (ICC=0.975, 95%CI: 0.95-0.987), frequency size (ICC=0.976, 95%CI: 0.954-0.988), quantile 75% (ICC=0.964, 95%CI: 0.93-0.982), 90% (ICC=0.933, 95%CI: 0.871-0.966) and 95% (ICC=0.867, 95%CI: 0.752-0.931), the first time measurement was employed to following ROC analysis. Respective AUCs of the absolute value of relative deviation, frequency size, quantile 75%, 90% and 95%of ADC value histogram when predicting pCR were 0.829, 0.821, 0.743, 0.757 and 0.779, with the optimal cut-off point of 1.187 (sensitivity=70%, specificity=92.9%), 1.323 (sensitivity=70%, specificity=92.9%), 1.046×10⁻³mm2/s (sensitivity=80%, specificity=71.4%), 1.203×10⁻³mm2/s (sensitivity=80%, specificity=71.4%), and 1.337×10⁻³mm2/s (sensitivity=75%, specificity=78.6%) respectively.Discussion
In this limited population study, a number of whole-tumor histogram-based texture parameters of ADC map before onset of NCRT were significantly different between pCR and non-pCR LARC patients. Absolute value of relative deviation, frequency size, quantile 75%, 90%, and 95% of baseline ADC value histogram could feasibly predict patients who were likely to achieve pCR after NCRT. Histogram-based texture parameters were determined by the way the signal intensities were distributed over the pixels in ROIs. Generally, higher entropy, lower energy, higher dispersed distribution of pixel histogram represent higher heterogeneity. 5 The present study revealed that patients who achieved pCR had relatively less heterogeneous distribution of baseline ADC values in contrast with non-pCR. In addition, high quantile (75%, 90%, and 95%) ADC values were predictive for pCR, with a respective AUC of 0.743, 0.757 and 0.779. Possible explanation is that tumors with higher high percentile pre-treatment ADC values are likely to be more necrotic, which may be correlated to poorer tissue perfusion, a more acidic micro-environment, and a lower oxygen concentration, leading to a higher possibility to treatment resistance.Conclusion
Locally advanced rectal cancer that achieved pCR after NCRT appeared less heterogeneous on pre-treatment ADC map and had lower high percentile ADC values. Whole-tumor texture analysis based on histogram parameters of pre-treatment ADC map were feasible to predict pCR in LARC.Acknowledgements
No acknowledgement found.References
1. Habr-Gama A, Perez R O, Nadalin W, et al. Operative versus nonoperative treatment for stage 0 distal rectal cancer following chemoradiation therapy: long-term results. Ann Surg, 2004, 240:711-717; discussion 717-718.
2. Maas M, Beets-Tan R G, Lambregts D M, et al. Wait-and-see policy for clinical complete responders after chemoradiation for rectal cancer. J Clin Oncol, 2011, 29:4633-4640.
3. Lisson C S, Lisson C G, Flosdorf K, et al. Diagnostic value of MRI-based 3D texture analysis for tissue characterisation and discrimination of low-grade chondrosarcoma from enchondroma: a pilot study. Eur Radiol, 2017. 10.1007/s00330-017-5014-6.
4. Beresova M, Larroza A, Arana E, et al. 2D and 3D texture analysis to differentiate brain metastases on MR images: proceed with caution. Magma, 2017. 10.1007/s10334-017-0653-9.
5. Kim J H, Ko E S, Lim Y, et al. Breast Cancer Heterogeneity: MR Imaging Texture Analysis and Survival Outcomes. Radiology, 2017, 282:665-675.
Figures