4707
Age dependency of T1 and T2 values in healthy pancreas measured at 7 Tesla1Radiology, Leiden University Medical Center, Leiden, Netherlands, 2Imaging, University Medical Center Utrecht, Utrecht, Netherlands
Synopsis
Age dependency of T1 and T2 times of the healthy pancreas at 7 Tesla with a multi-transmit system was investigated for MRI protocol optimization of the pancreas. Three age groups were measured (21 -25 yo, 26 -39 yo and 40 -72 yo). Measurements resulted in average T2 times of 52 ms, 97 ms and 127 ms for the 3 different age groups respectively, revealing an age dependency of the T2 relaxation times. Average T1 times were 856 ms, 899 ms and 858 ms for each age group respectively. No age dependency was observed for the T1 relaxation times.
Introduction
Pancreatic cancer has the highest mortality rate of all cancers: 10 out of 11 patients die within 5 years after diagnosis.1 Characterization of different tumor types is difficult, hampering optimal treatment selection. 7 Tesla (7T) MR imaging potentially offers higher signal- and contrast-to-noise and spatial resolution than lower clinical fields which can be translated into improved diagnoses. However, at 7T image artifacts such as signal voids can be substantial, particularly in the abdomen, which may reduce image quality in the region of interest (ROI). By using a multi-transmit system, the phase of each channel can be calculated to produce constructive interference in the ROI without reducing the transmit field (B1+) amplitude. In practice, MR protocols need to be optimized to enhance the contrast between normal and diseased tissue, which requires knowledge of the tissue relaxation parameters. The T2 value of pancreas at 7T has previously been investigated in relatively young volunteers (26±5 years) whereas the mean age of patients with pancreas cancer is 70 years.1 It is known that the physiology of the pancreas changes significantly with age, with factors such as pancreatic atrophy, lobulation and fatty degeneration occurring which could substantially affect relaxation times.3 The purpose of this study is to determine the mean T1 and T2 values of pancreas at 7T in older healthy volunteers and therefore the age dependency of the relaxation parameters.Methods
18 healthy volunteers, divided into three groups with age ranges of 21-25 (group 1, averaged age 24.6±1.1 years), 26-39 (group 2, averaged age 30.6±4.0 years) and 40-72 (group 3, averaged age 59.2±12.3 years) years old, were scanned with a 7T MR system (Philips, Best, The Netherlands) using eight parallel transmit channels, each connected to a transmit-receive fractionated dipole antenna4 (MR Coils BV, Drunen, The Netherlands) and 16 additional receive loops integrated with the antennas (2 per antenna) that were positioned symmetrically around the abdomen. The RF phase of each antenna was optimized by a multi-transmit system. RF phase shimming was performed to maximize the B1+ field in the pancreas region. After B1 shimming, gradient-echo images were obtained for anatomy localization. A Look-Locker sequence was used to obtain image sets for T1 determination (Turbo field echo (TFE), FA=3, TR/TE=9000/1.68ms, 20 IR times, 8:33 min total acquisition time, 4x4x10mm voxels, FOV= 222x340mm). Images acquired at a series of different echo times in one slice containing the pancreas were acquired to determine T2 (2D single shot turbo spin echo (TSE), TE/TR = 50;80;100;120ms/ 17s, SENSE factor = 2, 1.3x1.6x5mm voxels, FOV=250x350mm). To decrease motion artifacts, the study was carried out with an approximately 3 second breath-hold for the TE series and cardiac triggering for the Look-Locker sequence. Matlab scripts (R2014b, The Mathworks, Inc. ©) were used to fit T1 and T2 times using mono-exponential decays with a non-linear least squares method using the magnitude signal 5. An ROI was drawn to include the entire pancreas. Values were obtained both as an average over the ROI, and also on a voxel-by-voxel basis.Results and Discussion
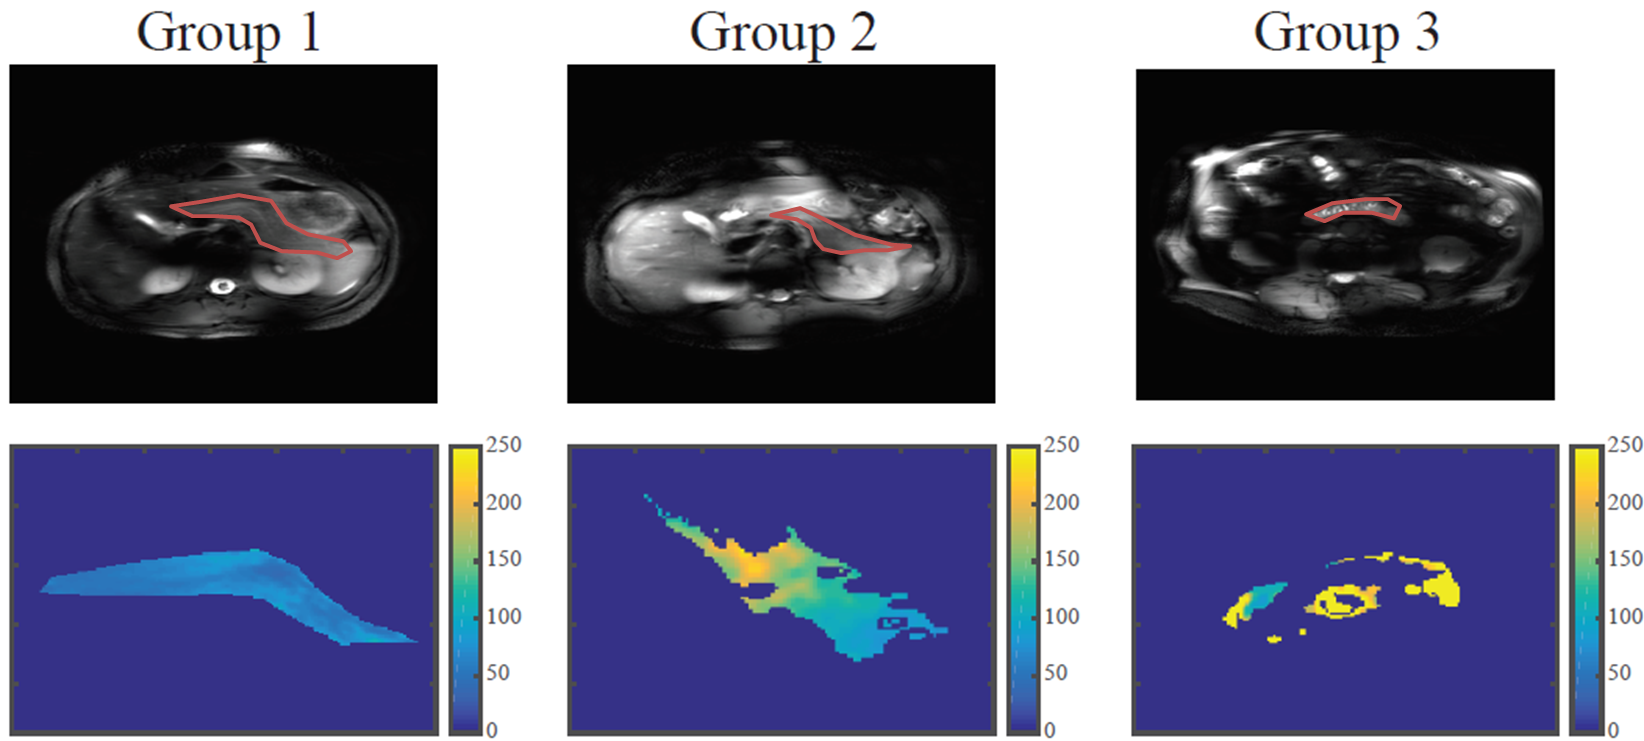
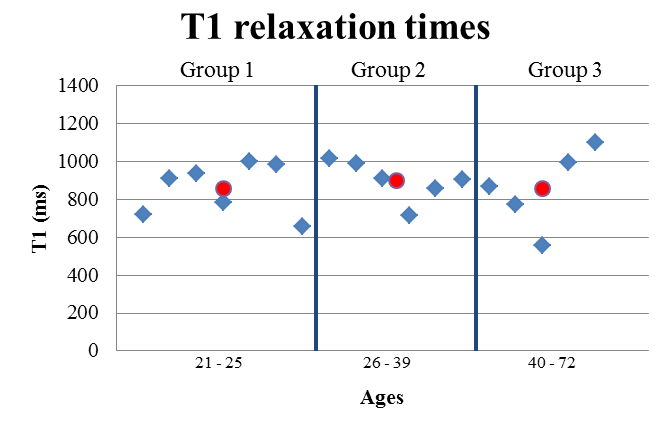
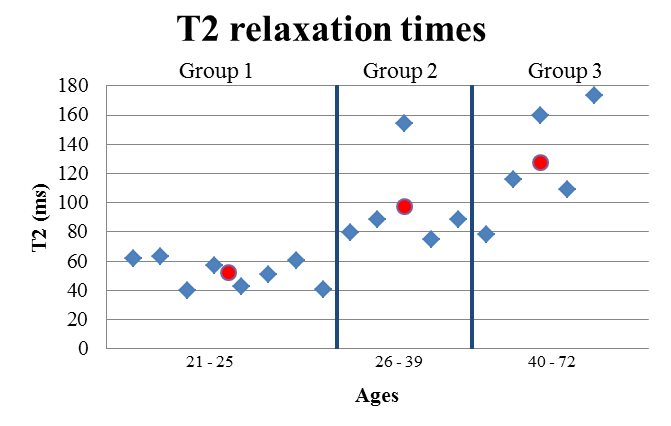
T1 and T2 fits were obtained for all volunteers. A substantial age dependency was observed for the T2 relaxation times, being more than two times higher at higher ages. Figure 1 shows a single example from each group of a T2 weighted image with the corresponding T2 map of the pancreas. Notice that with increasing age, higher T2 values are observed in the T2 maps, which can also be seen in the increased signal from the pancreas in the older groups. In the third age group, the anatomy is clearly changed, showing lobulation and fat infiltration. Voxel-by-voxel T2 fitting is more challenging in older pancreas, as observed in the T2 maps. As the size of the pancreas decreases with age, the pancreatic ducts that conduct fluids get closer together, causing motion artifacts and incorrect fits. Figure 2, shows the average T2 relaxation time in the ROI per age group. The average T2 values per group were 52±10 ms, 97±32 ms and 127±39 ms, respectively. Figure 3 shows no significant age dependency observed for the T1 relaxation times. The average T1 values per group were 856±134 ms, 899±108 ms and 858±209 ms, respectively.Conclusions
We have successfully measured the T1 and T2 values for pancreas at different ages at 7T. This resulted in an averaged T1 of 856±134 ms, 899±108 ms and 858±209 ms and a T2 value of 52±10 ms, 97±32 ms and 127±39 ms for the 3 age groups, respectively. The T2 relaxation times showed an age dependency, being higher for the older group.Acknowledgements
No acknowledgement found.References
1. National cancer institute (2015) Cancer Stat Facts: Pancreas Cancer. Retrieved from https://seer.cancer.gov/statfacts/html/pancreas.html. Accessed October 30, 2017.
2. Damen M., van Houtum Q, van Leeuwen MS, Luijten Peter R., Webb A., Klomp Dennis W.J., Arteaga de Castro CS. Quantitative T1 and T2 measurements of pancreas at 7 Tesla using a multi-transmit system. Proc Intl Soc Mag Reson Med; 2017 22-27 April; Honolulu, HI, USA.
3. Tomohiro Sato, et al., Age-related changes in normal adult pancreas: MR imaging evaluation. European Journal of Radiology, 2011.
4. Raaijmakers, A.J.E., et al., The fractionated dipole antenna: A new antenna for body imaging at 7 Tesla. Magnetic Resonance in Medicine, 2015.
5. MacFall, J.R., et al., An analysis of noise propagation in computed T2, pseudodensity, and synthetic spin-echo images. Medical Physics, 1986.
Figures