4704
Treatment effect of autoimmune pancreatitis: evaluation with T1 mapping1Radiology, Peking Union Medical College Hospital, Beijing, China, 2Siemens Healthcare, Erlangen, Germany, 3Siemens Healthcare, Beijing, China, 4Peking Union Medical College Hospital, B, China
Synopsis
This prospective study aims to evaluate the T1 relaxation time of autoimmune pancreatitis (AIP) in the native state and after corticosteroid treatment (CST). Thirty-four patients with AIP and twenty control subjects received pancreatic MR including T1 mapping. All AIP patients had T1 mapping data before and after CST. It turned out that the inflamed pancreatic parenchyma had significantly elongated T1 relaxation time, and after 4-12 weeks of CST, the T1 relaxation time shortened significantly towards normalization, in keeping with the serum biomarkers of disease activity. Therefore MR T1 mapping is a noninvasive, quantitative method to monitor AIP treatment effect.
Synopsis
This prospective study aims to evaluate the T1 relaxation time of autoimmune pancreatitis (AIP) in the native state and after corticosteroid treatment (CST). Thirty-four patients with AIP and twenty control subjects received pancreatic MR including T1 mapping. All AIP patients had T1 mapping data before and after CST. It turned out that the inflamed pancreatic parenchyma had significantly elongated T1 relaxation time, and after 4-12 weeks of CST, the T1 relaxation time shortened significantly towards normalization, in keeping with the serum biomarkers of disease activity. Therefore MR T1 mapping is a noninvasive, quantitative method to monitor AIP treatment effect.Introduction
Autoimmune pancreatitis is a special form of chronic pancreatitis, which often manifests as tumor-like swelling of the pancreas, and chronic exocrine and endocrine function loss. AIP usually respond well to steroid treatment, with clinical symptoms relief and pancreatic function restoring 1-2. However, the incidence of disease relapse is high 3. Serum biomarkers and pancreatic morphology on cross-sectional imaging has limitations in monitoring disease activity and predicting relapse 4-5. The aim of this study is to evaluate the T1 relaxation time of autoimmune pancreatitis (AIP) in the native state and its change after corticosteroid treatment (CST).Methods
The institutional review board approved this prospective study, and all patients provided written informed consent. Twenty-two patients with diffuse AIP and 12 patients with focal AIP received pancreatic MR imaging including T1-VIBE-Dixon, T2-HASTE, T2-Blade, DWI and T1 mapping on a MAGNETOM Skyra 3T MR scanner (Siemens Healthcare, Erlangen, Germany) using an 18-channel body coil and a 32-channel spine coil, both before and after steroid treatment. T1 maps were acquired using a prototype T1 Look-Locker sequence with the following parameters: FOV= 300 x 270 mm2, matrix = 128 x 115, number of slices=5, slice thickness = 4mm, TR/TE=3.00/1.31 ms, 16 TIs equally distributed from 104 ms to 2354ms. Seven of those patients received additional MR T1 mapping during disease relapse. Twenty patients without pancreatic diseases who received T1 mapping of the pancreas served as control. In each patient, T1 relaxation time of pancreatic parenchyma in the head, body and tail was measured. The association of T1 relaxation time and serum biomarkers IgG4 and C-reactive protein (CRP) was evaluated.Results
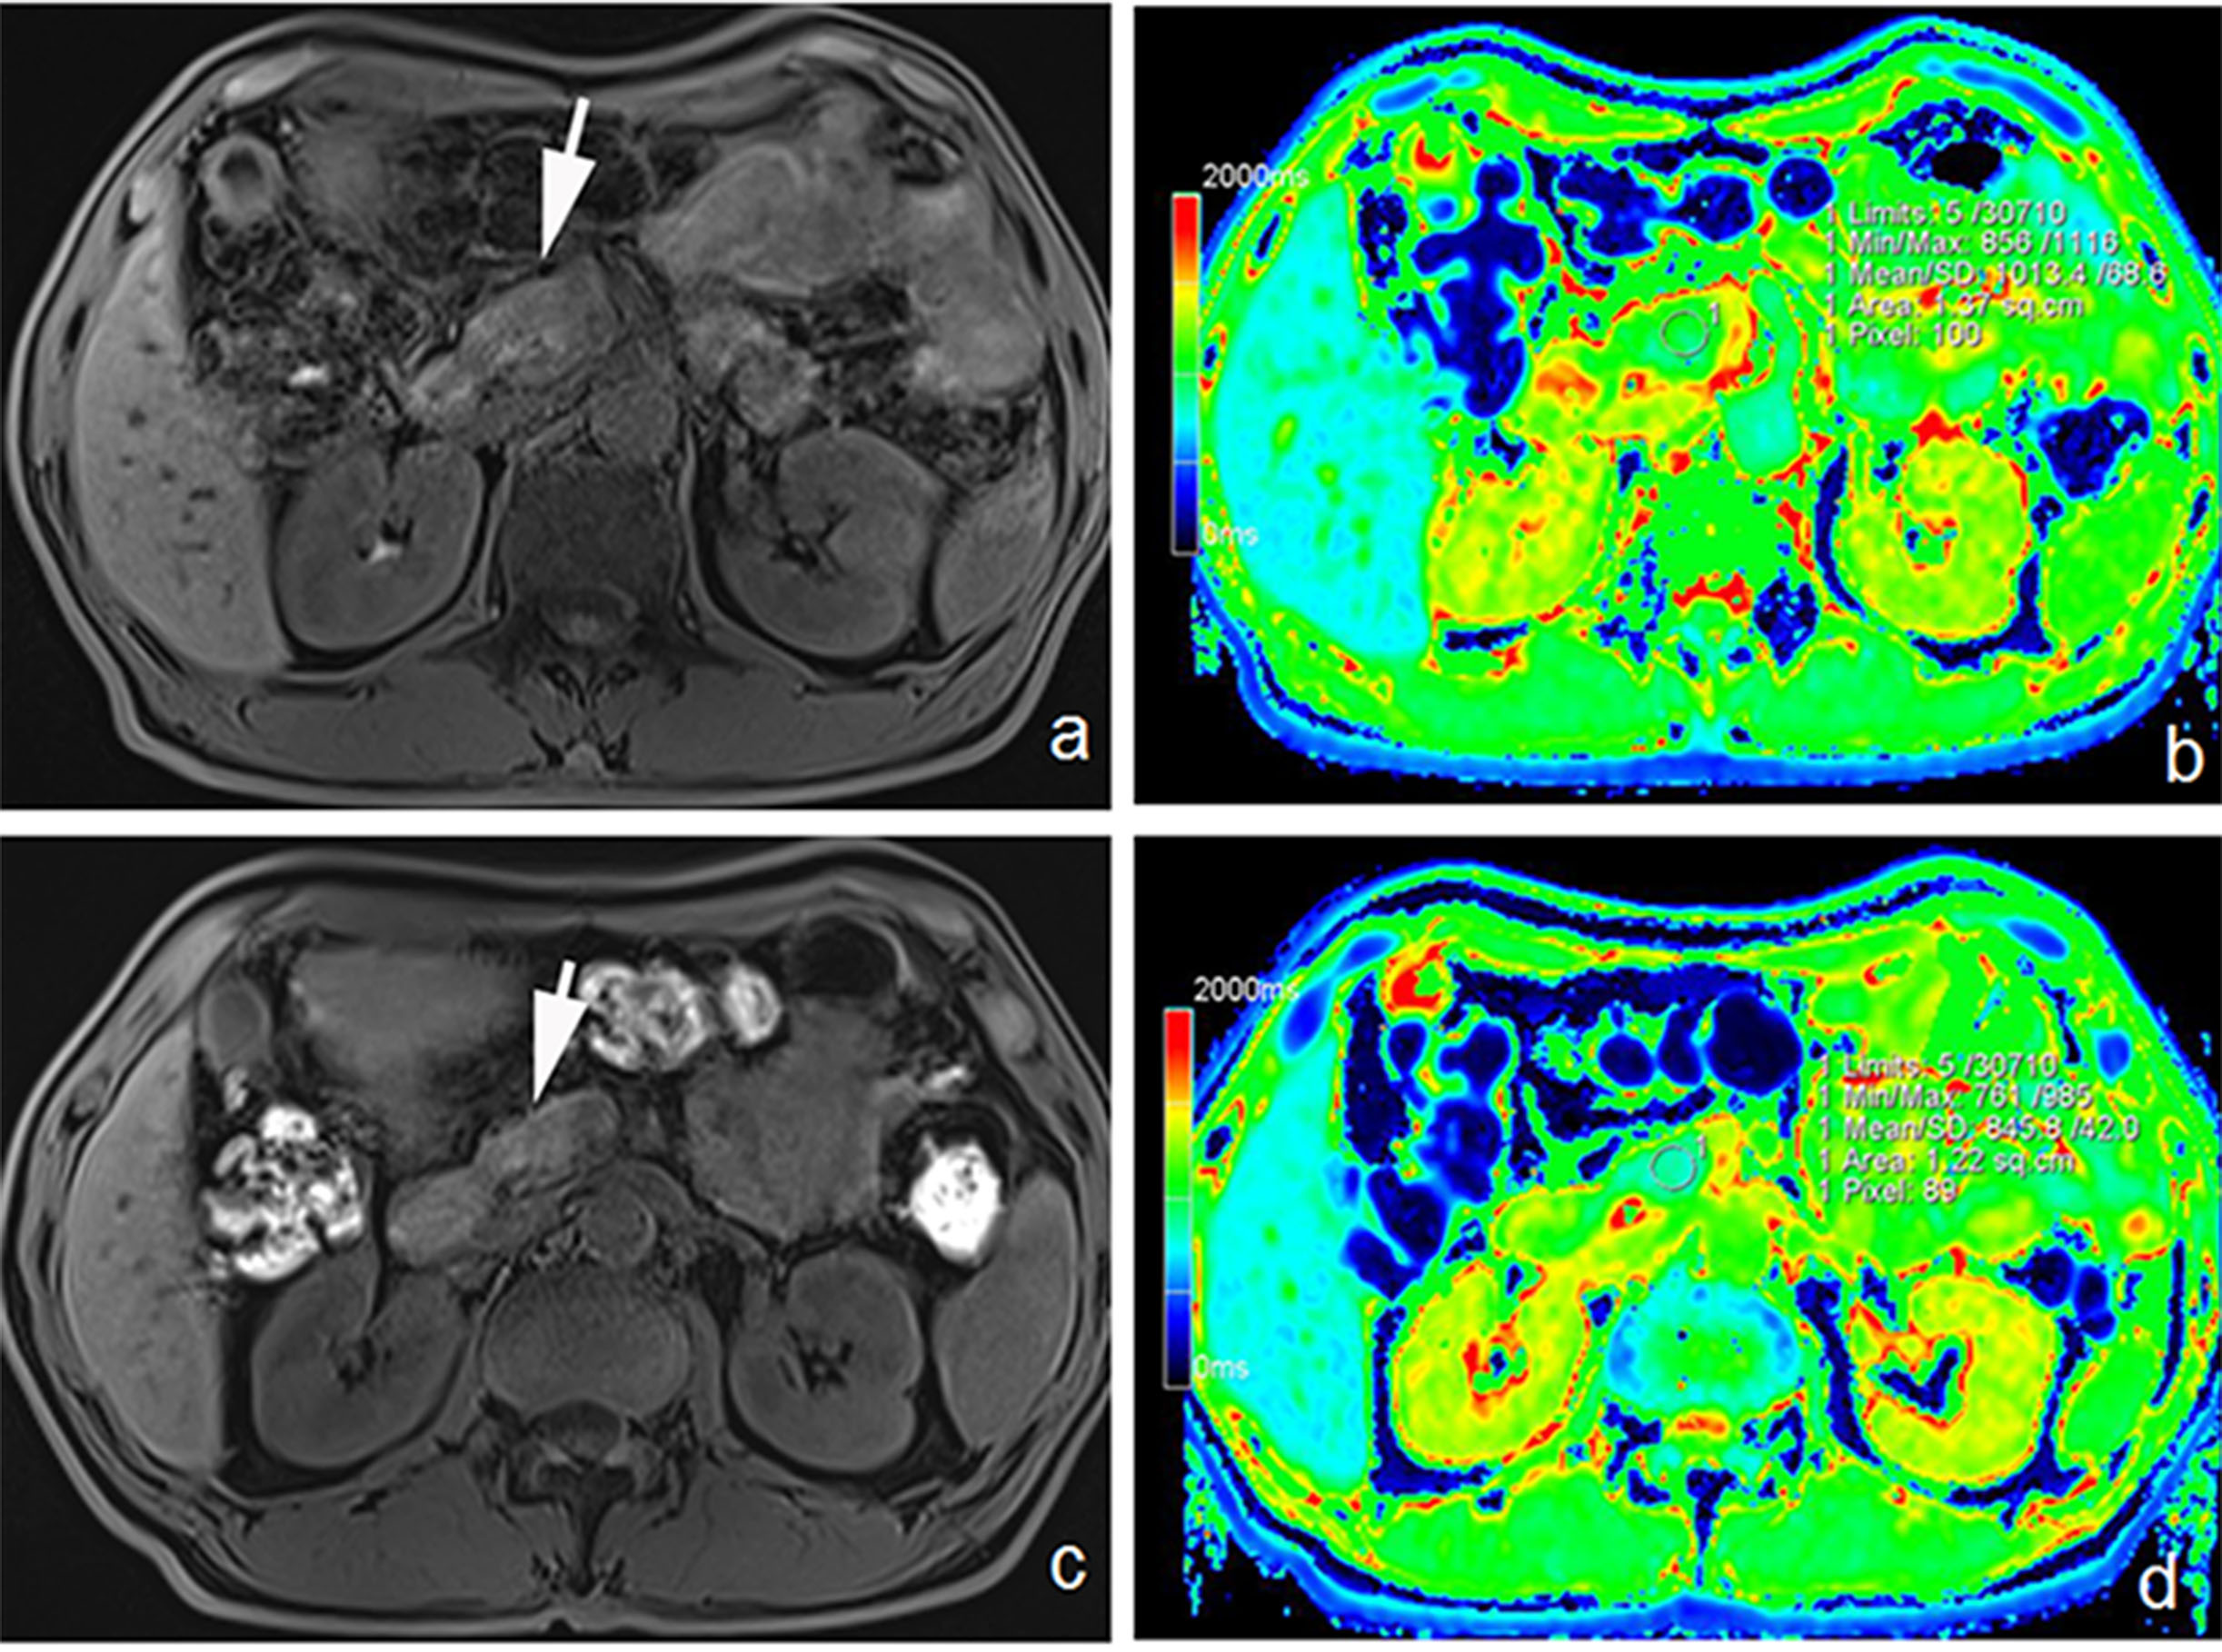
The T1 relaxation time of normal pancreatic parenchyma was 785.4±49.5 msec. For both diffuse and focal AIP, the T1 relaxation time was significantly elongated compared to the control (both p<0.001). After 4-12 weeks of CST, the T1 relaxation time of the pancreas shortened significantly towards normalization, compared to the baseline value (for diffuse AIP: from 1104.5±121.8 msec to 893.8±108.4 msec, and for focal AIP: from 1220.7±139.3 msec to 931.7±86.4 msec; both p<0.01). The visually uninvolved parenchyma in focal AIP had longer T1 relaxation time compared to the normal pancreas (p<0.01), which also shortened significantly after steroid treatment (from 918.7±128.9 msec to 831.1±94.3 msec, p<0.01). In seven patients with clinically evident disease relapse, T1 relaxation time of the pancreas elongated significantly compared to the remission state (from 927.5±95.9 msec to 1287.7±125.6 msec, p<0.01).Discussion
It is known that the pancreatic signal intensity (SI) on T1-weighted fat-saturated MR images reflects the pancreatic disease state with a high sensitivity. Inflamed pancreatic parenchyma or tumor usually has SI lower than or equal to the liver, with a diagnostic accuracy >80% 6. T1 mapping provides a more accurate quantitative measure of pancreatic parenchyma, and proved to be useful in diagnosing mild chronic pancreatitis 7. In this study, we found that T1 relaxation time significantly differs in the inflamed pancreatic parenchyma of AIP and normal pancreas, and in the same patient, T1 relaxation time changes significantly according to the inflammation-remission-relapse state. This suggests the role of T1 mapping as an effective quantitative imaging tool to monitor treatment effect of AIP and early detection of disease relapse, therefore guiding a more adequate treatment. Besides, T1 mapping detects more extensive parenchyma involvement in focal AIP, compared to visual inspection. Focal AIP often poses a diagnostic challenge, since differentiation with pancreatic cancer is often difficult 8-9. Although the morphologic features may have potential overlap, the background parenchyma inflammation of AIP, which could be sensitively detected by T1 mapping, may provide additional key information for disease characterization, thus enhancing the diagnostic confidence and waiving the necessity of more invasive diagnostic procedures.Conclusion
T1 mapping could accurately depict the inflammatory state and extent in patients with AIP, and monitor parenchyma change with treatment.Acknowledgements
No acknowledgement found.References
1. Hirano K, Tada M, Isayama H, et al. Long-term prognosis of autoimmune pancreatitis with and without corticosteroid treatment. Gut. Dec 2007;56(12):1719-1724.
2. Church NI, Pereira SP, Deheragoda MG, et al. Autoimmune pancreatitis: clinical and radiological features and objective response to steroid therapy in a UK series. The American journal of gastroenterology. Nov 2007;102(11):2417-2425.
3. Hart PA, Topazian MD, Witzig TE, et al. Treatment of relapsing autoimmune pancreatitis with immunomodulators and rituximab: the Mayo Clinic experience. Gut. Nov 2013;62(11):1607-1615. 4. Rehnitz C, Klauss M, Singer R, et al. Morphologic patterns of autoimmune pancreatitis in CT and MRI. Pancreatology : official journal of the International Association of Pancreatology. 2011;11(2):240-251.
5. Manfredi R, Graziani R, Cicero C, et al. Autoimmune pancreatitis: CT patterns and their changes after steroid treatment. Radiology. May 2008;247(2):435-443.
6. Winston CB, Mitchell DG, Outwater EK, Ehrlich SM. Pancreatic signal intensity on T1-weighted fat saturation MR images: clinical correlation. Journal of magnetic resonance imaging : JMRI. May-Jun 1995;5(3):267-271.
7. Tirkes T, Lin C, Fogel EL, Sherman SS, Wang Q, Sandrasegaran K. T1 mapping for diagnosis of mild chronic pancreatitis. Journal of magnetic resonance imaging : JMRI. Apr 2017;45(4):1171-1176.
8. Choi SY, Kim SH, Kang TW, Song KD, Park HJ, Choi YH. Differentiating Mass-Forming Autoimmune Pancreatitis From Pancreatic Ductal Adenocarcinoma on the Basis of Contrast-Enhanced MRI and DWI Findings. AJR. American journal of roentgenology. Feb 2016;206(2):291-300.
9. Kamisawa T, Takuma K, Anjiki H, et al. Differentiation of autoimmune pancreatitis from pancreatic cancer by diffusion-weighted MRI. The American journal of gastroenterology. Aug 2010;105(8):1870-1875.
Figures