4703
Diffirentiation Between Pancreatic Ductal Adenocarcinoma and Neuroendocrine Tumors :Using Whole-tumor Histogram Analysis of Non-Gaussian Distribution DWI Models1Tongji Hospital, Huazhong University of Science and Technology, Wuhan, China
Synopsis
The purpose of this paper is to explore a most helpful DWI mathematical models in differenting pancreatic ductal adenocarcinoma and neuroendocrine tumors. All parameters of three models(monoexponential, biexponential, and stretched exponential) were obtained from a histogram analysis based on the entire tumor. By comparing diagnostic performance, the significant parameters that have the highest diagnostic performance were selected to the most helpful parameters. The results of this study showed that IVIM-DWI model may be the most suitable for differenting pancreatic tumors.
Introduction:
In clinical practice, preoperative accurate diagnosis of pancreatic ductal adenocarcinoma(PDAC) and neuroendocrine tumors(NET) has always been the focus and difficulty. Because DW-MRI has no radiation and can quantitatively evaluate the microenvironment of tissue, there are some articles1 investigating its efficacy in differentiating pancreatic tumors .However, the majority of these prior investigations measured parameters from manually placed regions of interest (ROIs) on the largest possible section of tumors, which could not reflect the diffusion characteristic of the entire tumor comprehensively. Moreover, three common mathematical models (monoexponential, biexponential, and stretched exponential) of DWI have their own advantages and disadvantages2. Therefore, this article attempts to quantitatively evaluate and compare the diagnostic performance of three DWI mathematical models for identifying pancreatic ductal adenocarcinoma and neuroendocrine tumors ,by using the histogram analysis on entire-tumor.Methods:
This retrospective study has obtained the approvement from the local Institutional Review. A total of 45 patients with histopathologically confirmed pancreatic adenocarcinoma (35) and neuroendocrine Tumor (10) ,were included in this study and underwent preoperative magnetic resonance imaging (MRI) ,(including multi-b value DWI (0--1000 s/mm2) ) using a 3.0T system .Each parameter was subjected to a histogram analysis based on the entire tumor: A water-dimensional diffusion heterogeneity index (ADC), A pseudo-ADC (Dp),true ADC (Dt), perfusion fraction (fp) , A water molecular diffusion heterogeneity index (a) and distributed diffusion coefficient (DDC).The mean, median, 10th percentile, and 90th percentile of the histogram parameters are used for comparison between the two groups. The Student T test or Mann–Whitney U-test were used for comparison. Receiver operating characteristic analysis were used for evaluating the diagnostic performance of the parameters.Results:
For ADC, DDC, Dp and f,all metrics (mean、median、10%、90%) except Dp90%(P=0.492) were significantly lower in PDAC group than NET group (P < 0.05). However, α-mean and α-median values were significantly higher in PDAC group than NET group (P < 0.05). All parameters of Dt were not significantly different (P =0.338、0.510、0.619、0.739 ,respectively). The AUC values of Dp and f have a higher trend compared to ADC, DDC, and a. The AUC values of Dpmean(0.82)、Dpmedian(0.84)、Dp10%(0.82)、f-mean(0.85)、f-median(0.93), f10%(0.80) and f90%(0.81) were higher than those for ADC(0.81,0.79,,0.80,0.763),DDC(0.83,0.85,0.77,0.76),α-mean(0.81)、α-median(0.78).Among all the parameters, f-median has the highest diagnostic performance, its AUC is 0.93, threshold, sensitivity and specificity are 0.19,100% and 80%,respectively.Discussion:
Whole-tumor parameters analysis method could
increase calculation accuracy and reproducibility and potentially eliminate
sampling bias due to the selections of ROI. The diagnostic efficiency of perfusion-related
parameters Dp and f is higher than that of diffusion-related parameters ADC,
which is similar to previous result3. The results note that the difference
between pancreatic ductal adenocarcinoma and neuroendocrine tumors is mainly
related to perfusion differences. stretched exponential DWI have not been found
to be used in identifying pancreatic tumors, but articles on glioma4 and
prostate suggest that DDC has many advantages over ADC. This is also validated
in this article: DDC was superior to ADC in diagnostic efficacy, and the
difference of a was also statistically significant. This result shows that stretched
exponential DWI can be used to identify pancreatic cancer and endocrine tumors.
By comparing the three mathematical models of DWI, IVIM-DWI was found to have
the highest diagnostic efficacy (f- median, AUC = 0.93), suggesting that it may be
the best model for differenting pancreatic tumors.Conclusion:
It is feasible to identify pancreatic ductal adenocarcinomas and neuroendocrine tumors by histogram analysis of three DWI models. IVIM-derived perfusion-related f and Dp have better performance than ADC, DDC and a, and a may provide additional information.Acknowledgements
No acknowledgement found.References
1. Wang Y, Miller FH, Chen ZE, et al. Diffusion-weighted MR imaging of solid and cystic lesions of the pancreas. Radiographics 31 (3): E47-64, 2011.
2. Barral M, Taouli B, Guiu B, et al. Diffusion-weighted MR imaging of the pancreas: current status and recommendations. Radiology 274 (1): 45-63, 2015.
3. Kang KM, Lee JM, Yoon JH, et al. Intravoxel incoherent motion diffusion-weighted MR imaging for characterization of focal pancreatic lesions. Radiology 270 (2): 444-53, 2014.
4. Bai Y, Lin Y, Tian J, et al. Grading of Gliomas by Using Monoexponential, Biexponential, and Stretched Exponential Diffusion-weighted MR Imaging and Diffusion Kurtosis MR Imaging. Radiology 278 (2): 496-504, 2016.
Figures
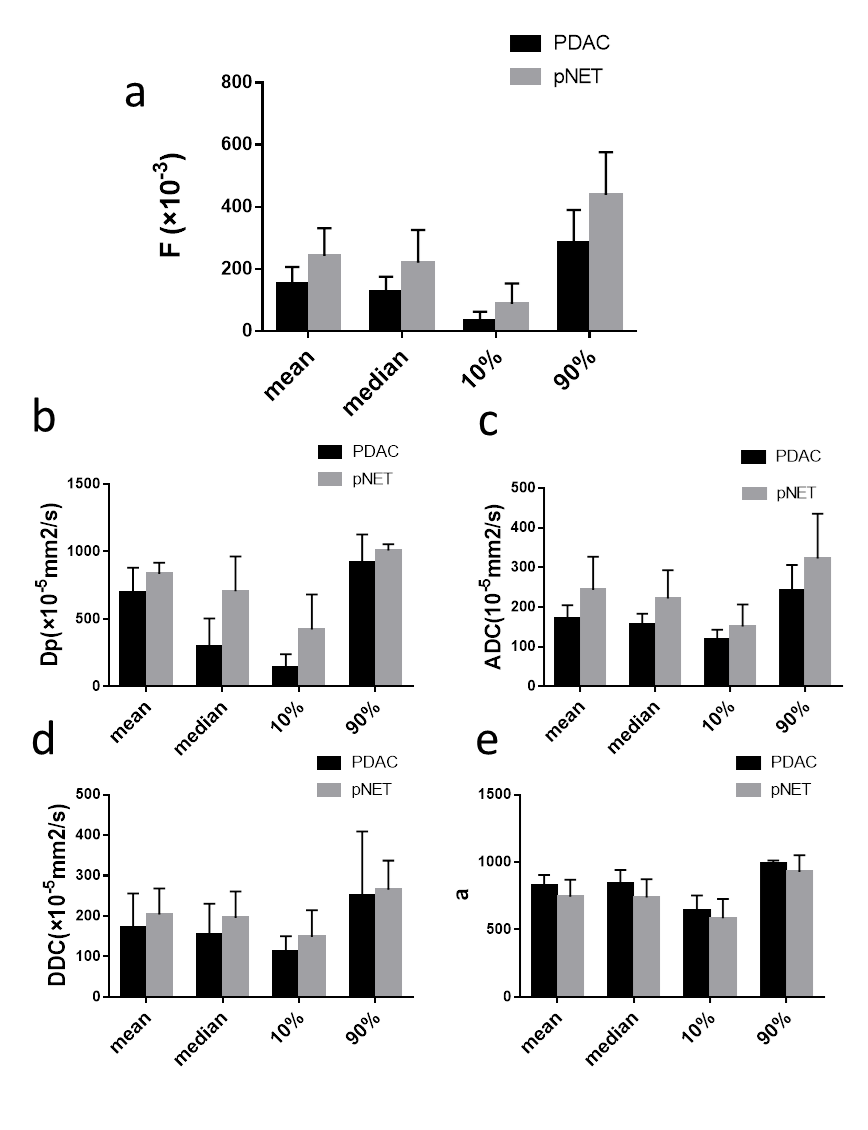
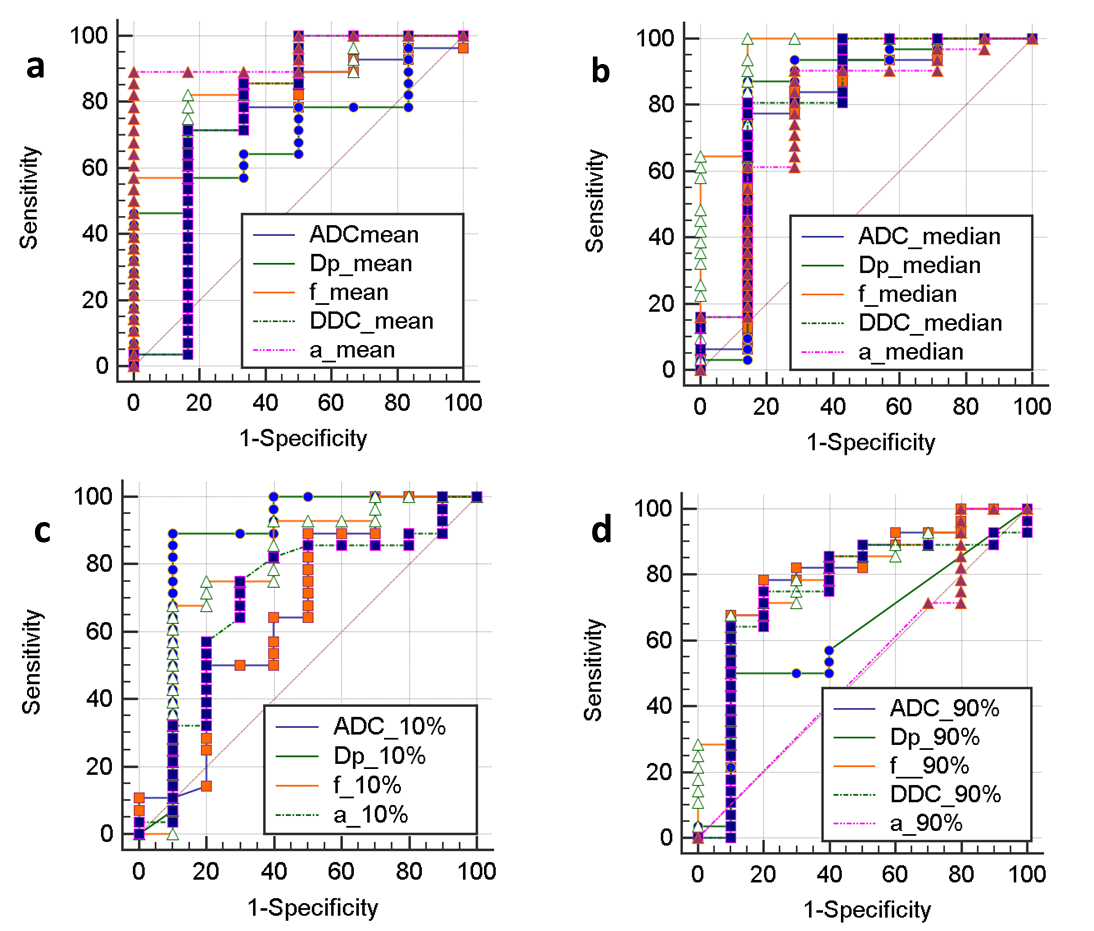
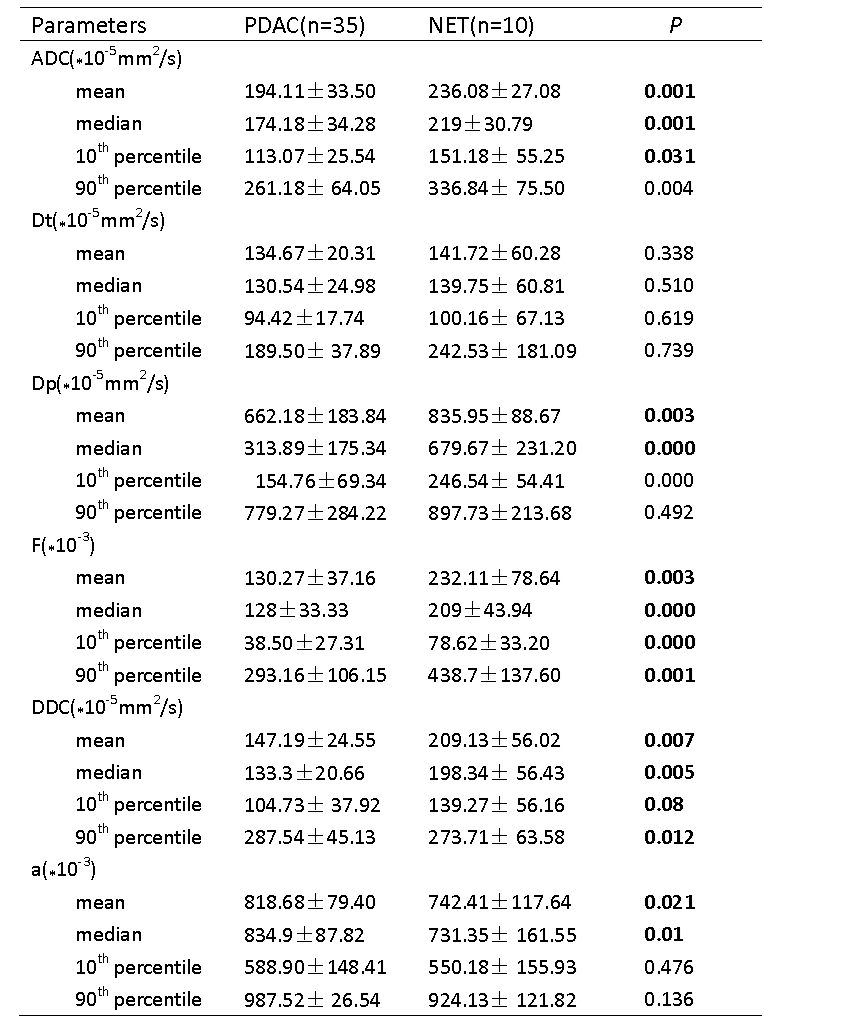
Table1. Histogram Parameters of DWI in PDAC and NET.
*Data are means ± standard deviations. Significant differences are in bold.