4701
Comparison of six diffusion-weighted imaging models for the detection of treatment effects in pancreatic cancer patients1Joint department of physics, Institute of Cancer Research and The Royal Marsden NHS Foundation Trust, London, United Kingdom, 2Department of Radiology & Nuclear Medicine, Academic Medical Center, Amsterdam, Netherlands, 3Department of Radiation Oncology, Academic Medical Center, Amsterdam, Netherlands, 4Department of Medical Oncology, Academic Medical Center, Amsterdam, Netherlands, 5LEXOR (Laboratory for Experimental Oncology and Radiobiology), Academic Medical Center, Amsterdam, Netherlands, 6Department of Surgery, Academic Medical Center, Amsterdam, Netherlands
Synopsis
We tested the performance of six diffusion models for detecting effects from treatment in pancreatic ductal adenocarcinoma. All models, including the mono-exponential fit, were able to detect parameter changes after treatment in individual patients for five out of nine patients. For multi-parametric models treatment affected different parameters for different patients, allowing potentially discriminating between types of effects. The pseudo diffusion coefficient values from the intravoxel incoherent motion model were in line with instant dephasing due to bulk motion rather than capillary perfusion, limiting its clinical interpretation. Using two mono-exponential fits, one at low and one at high b-values, was preferred.
Introduction
Evaluation of treatment response for pancreatic ductal
adenocarcinoma (PDAC) is notoriously challenging as treatment response often is
not reflected by radiological size criteria1–3. Intravoxel incoherent motion
(IVIM) modelling of diffusion-weighted MRI (DWI) bears much promise for monitoring
treatment response based on functional changes rather than changes in size4–6. However, IVIM is poorly
repeatable in pancreas7 and other models8–10 may be more accurate. We test
the performance of six fit models in PDAC.
Methods
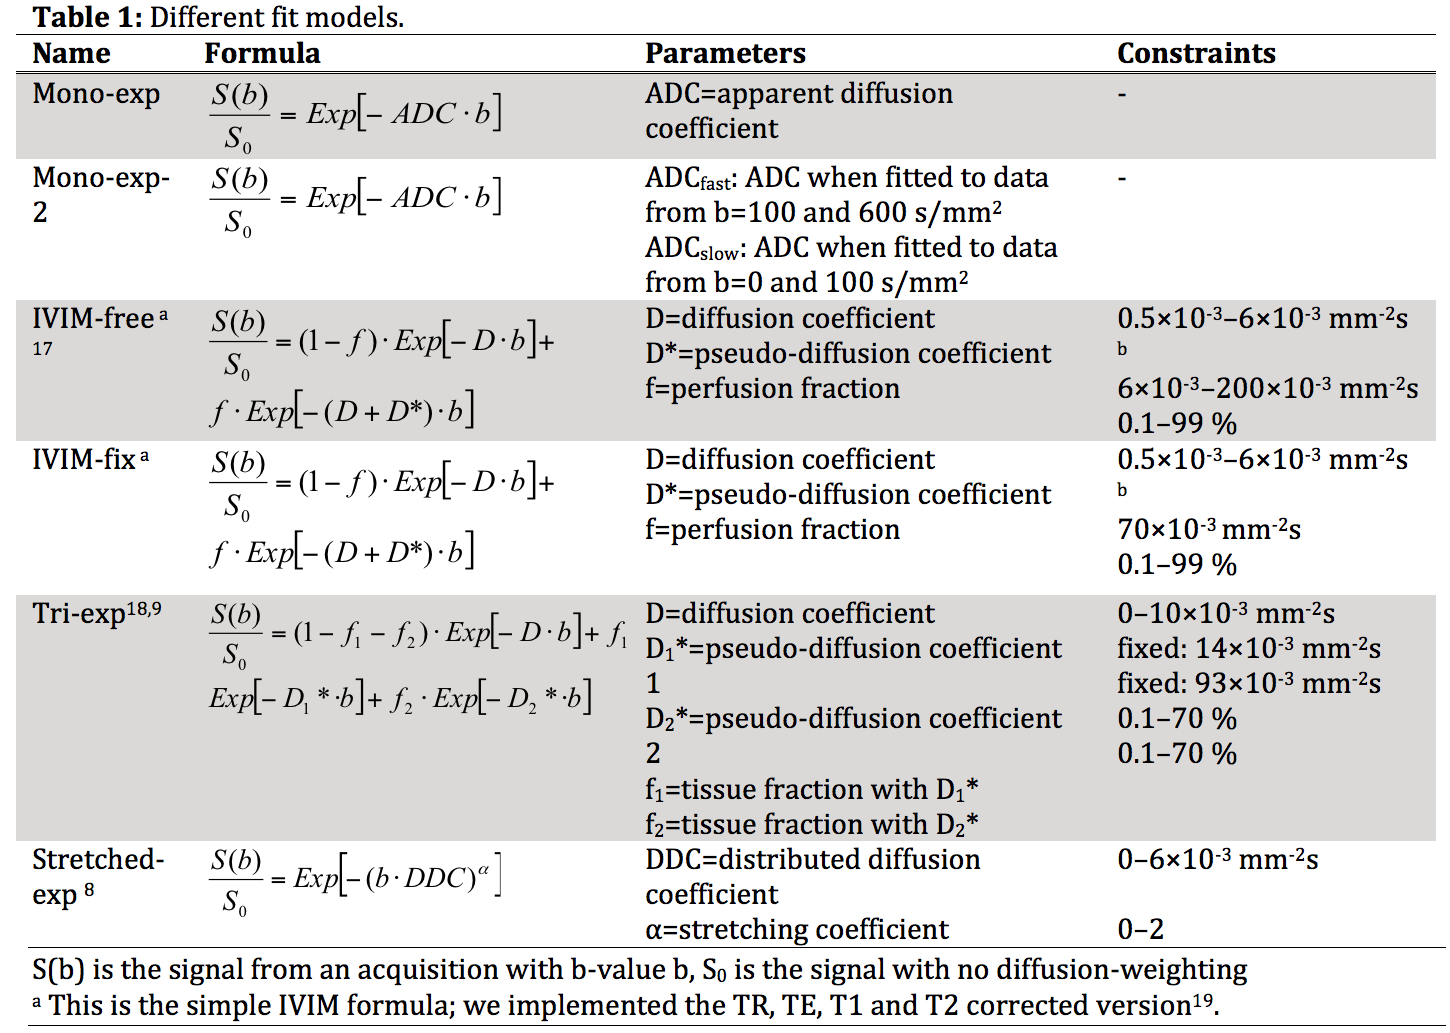
We obtained DWI data (b=0, 10, 20, 30, 40, 50, 75, 100, 150, 250, 400 and 600 s/mm2) on a 3T scanner in 25 PDAC patients with either repeated baseline (pre-treatment; 14 patients), single baseline (2) or repeated measurements with nine weeks of chemo-radiotherapy treatment in-between (9). All analyses were done in Matlab. All DWI images were denoised (Rician adaptive non-local means)11 and registered (Elastix)12,13. We tested six common DWI models summarized in Table 1. Regions of interest (ROIs) were drawn in consensus by 2 observers14.
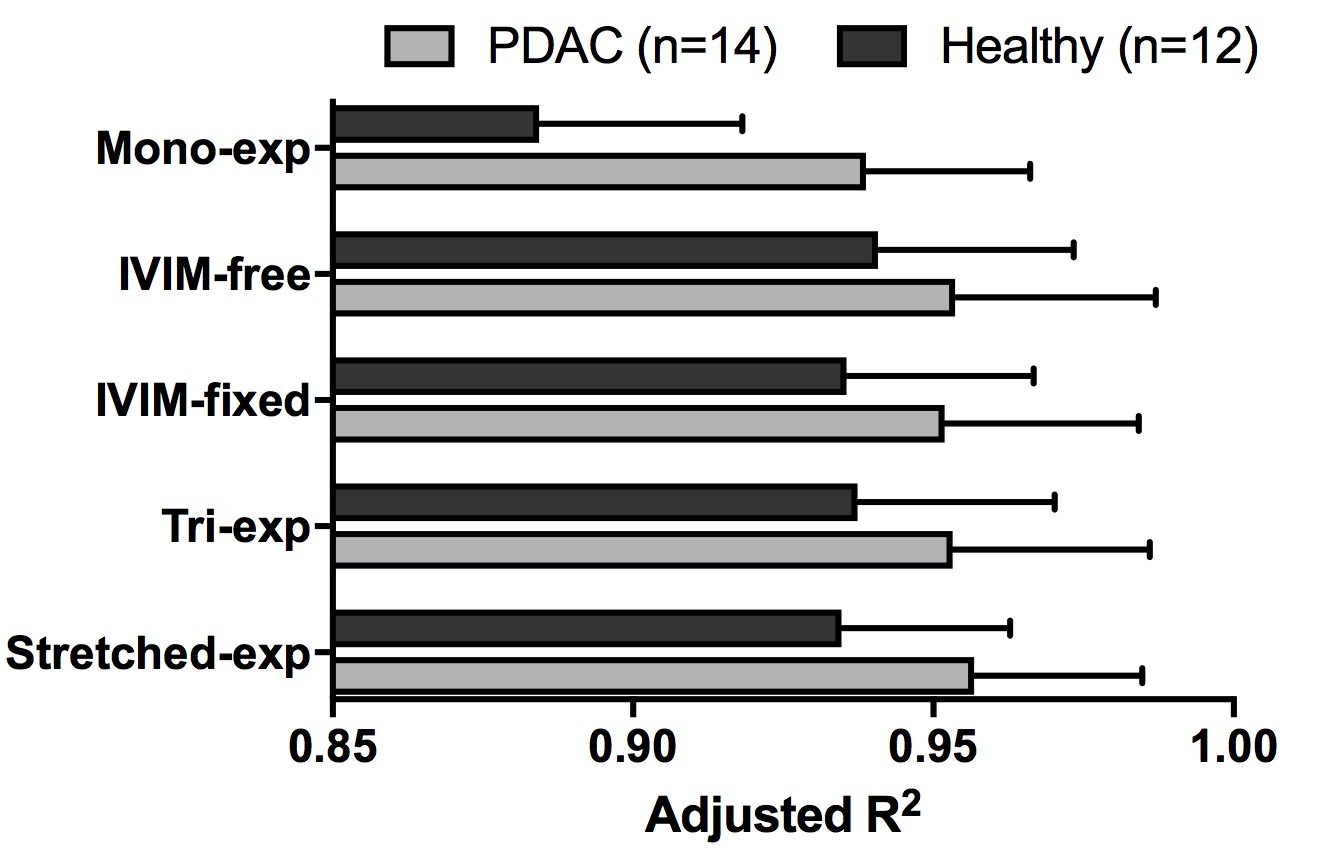
The goodness of fit was assessed by calculating adjusted R2. Adjusted R2 characterizes the proportion of the variance in the signal that is predicted by the independent variables, corrected for the model’s degrees of freedom.
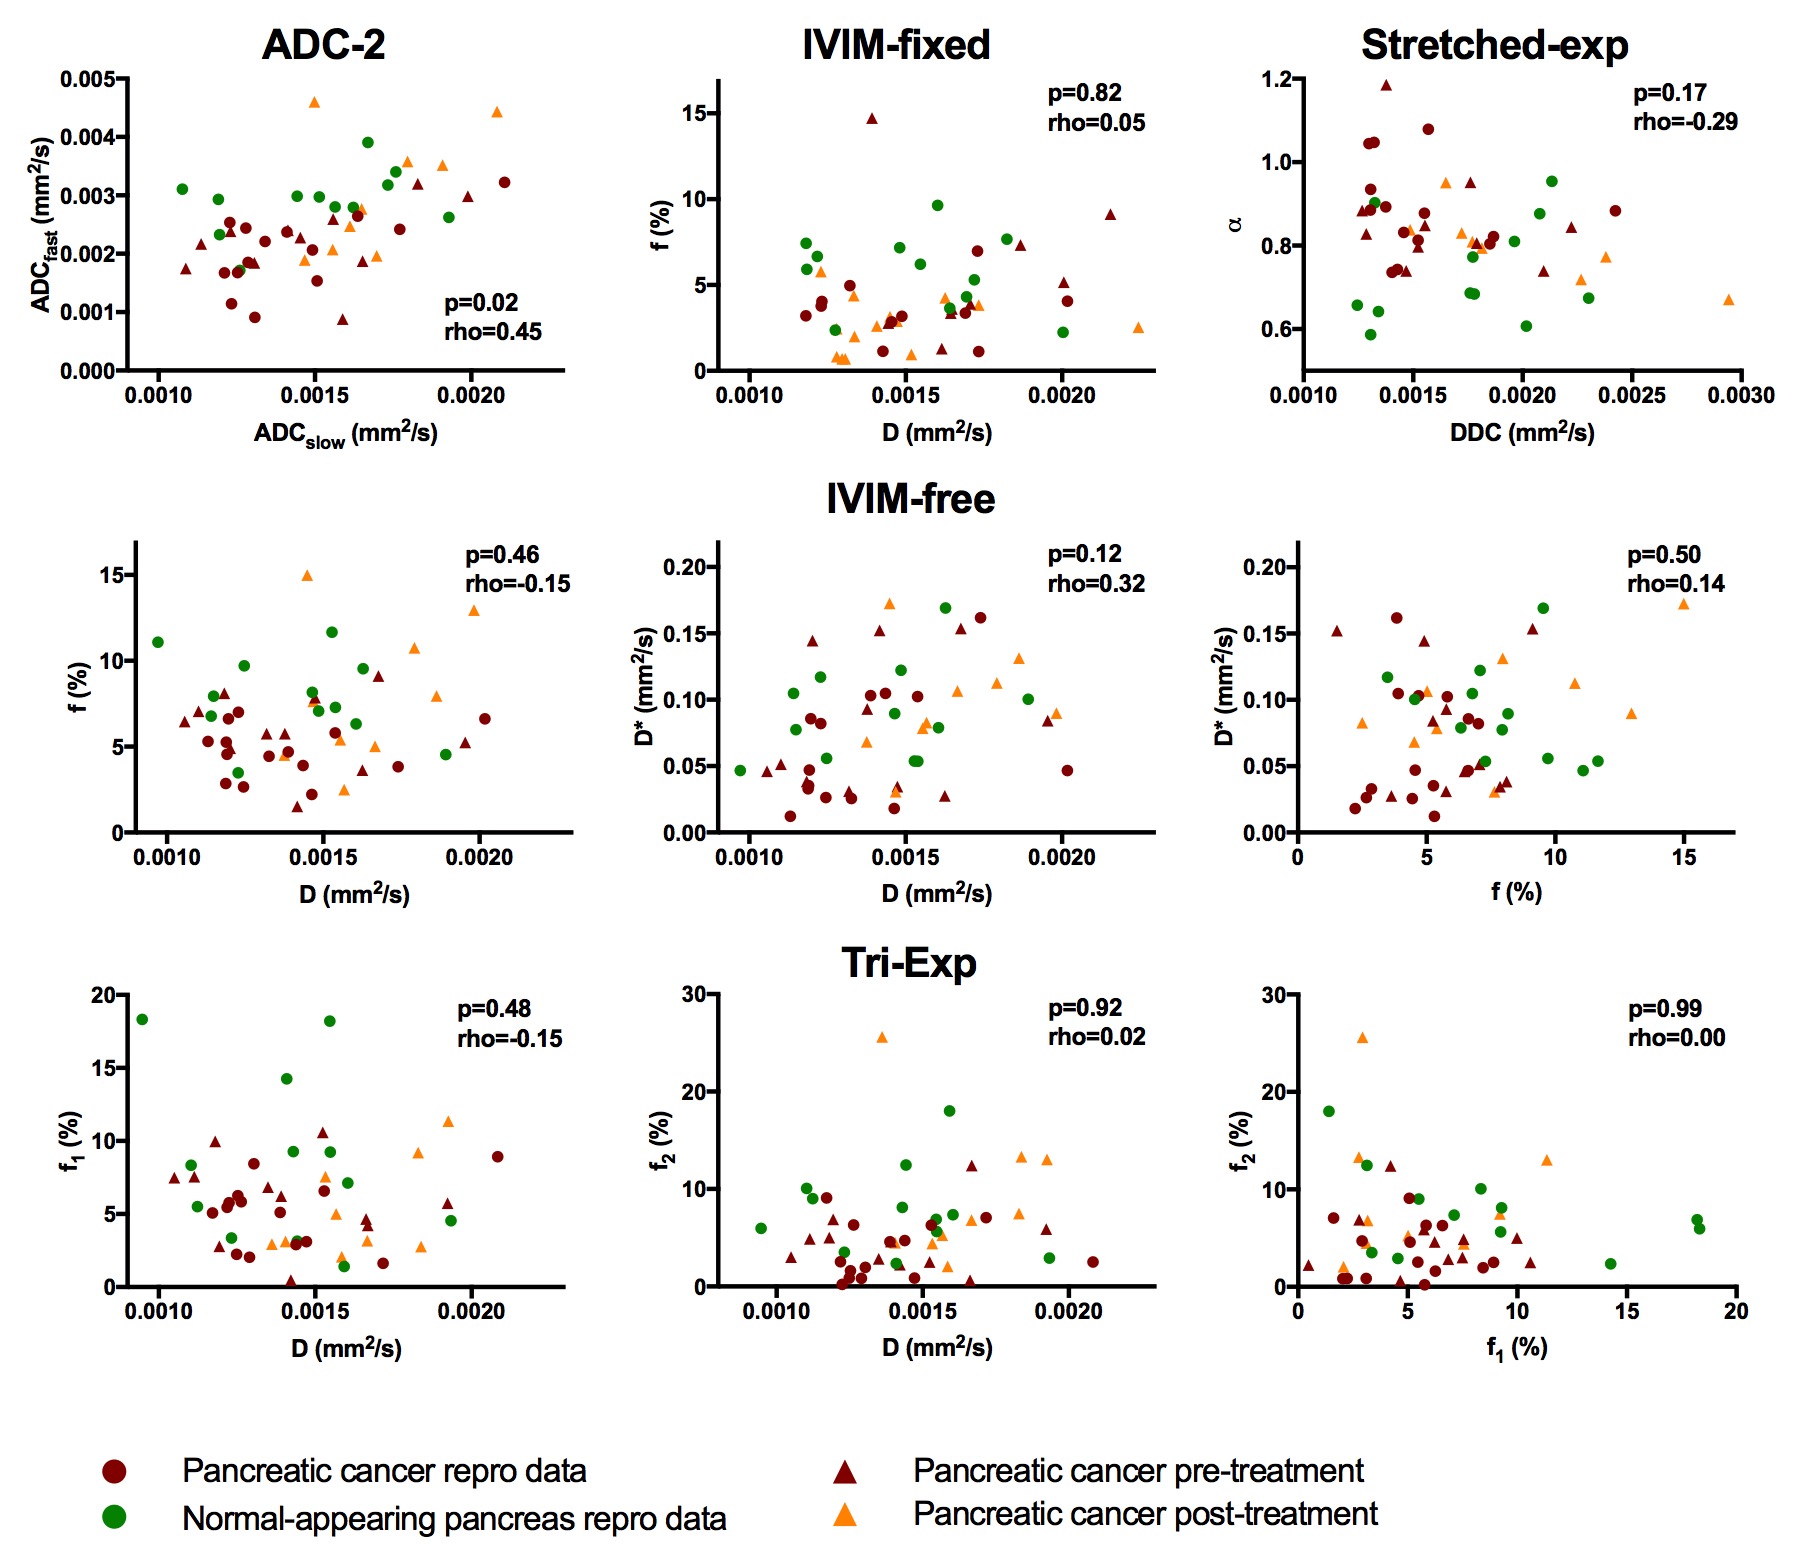
We used a Spearman’s rank correlation test between the fit parameters to examine the unique nature of the fit parameters (significance level α=0.05).
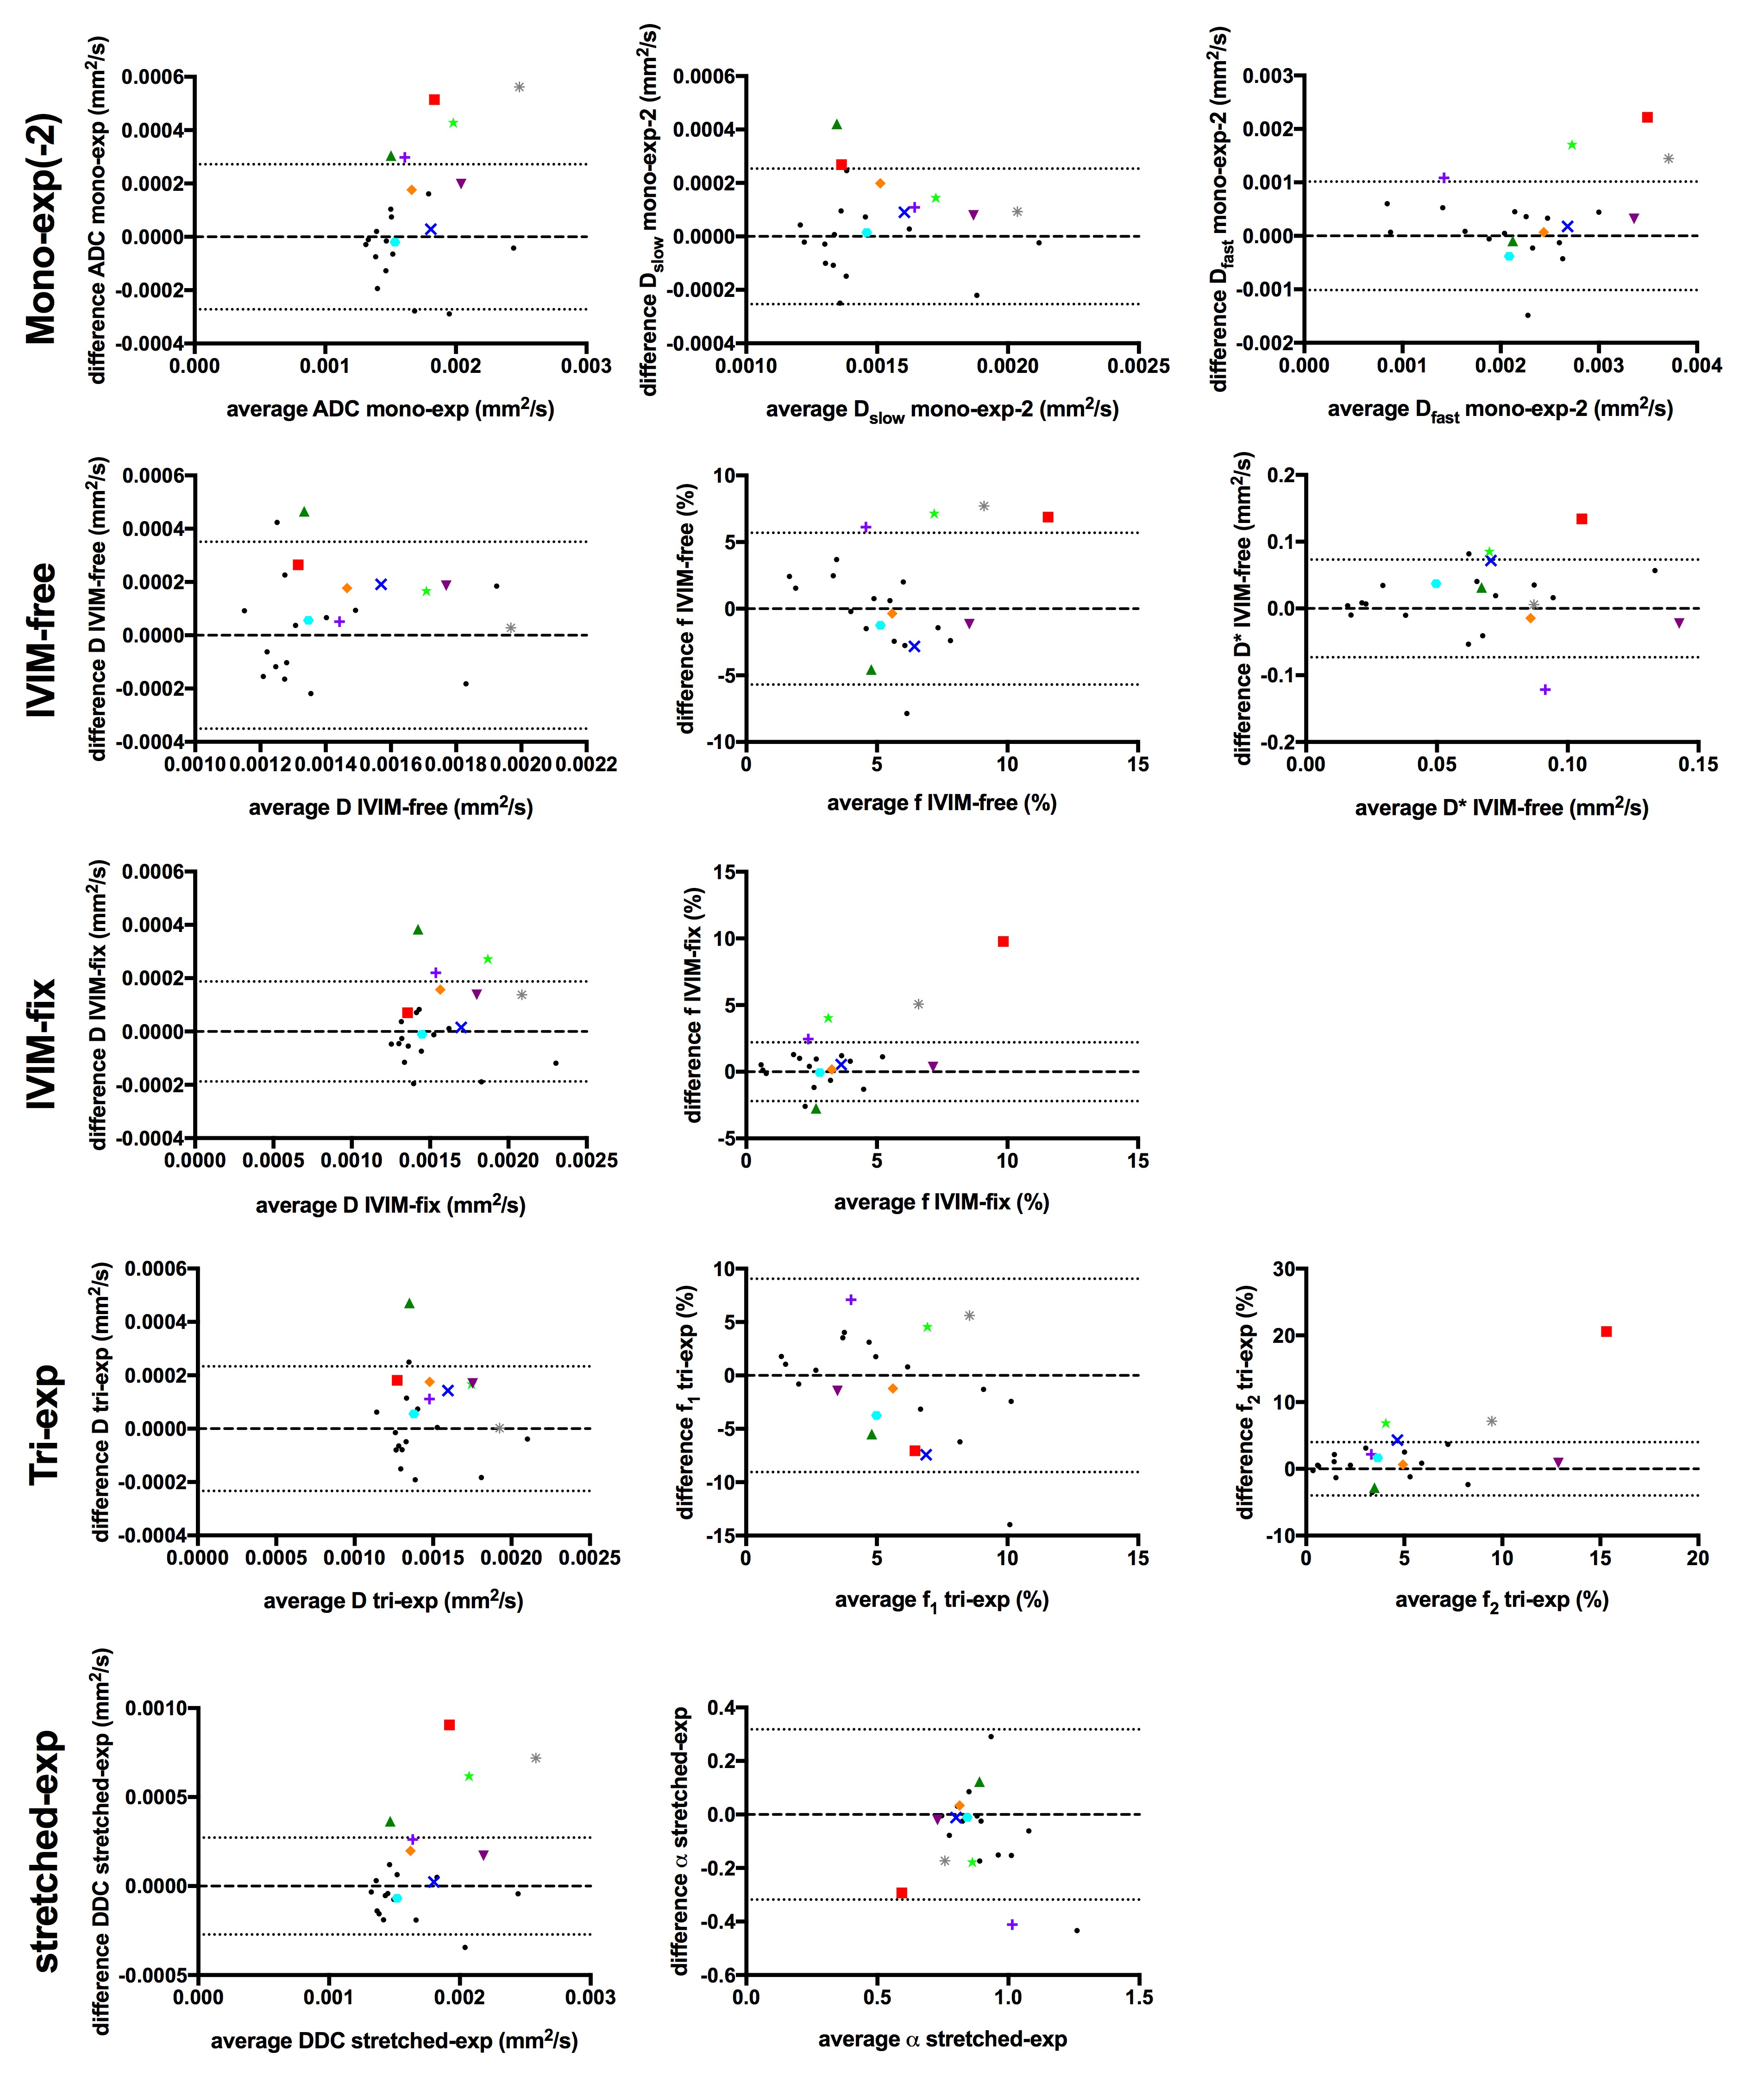
From the repeated baseline measures we calculated the inter- and intra-session within-subject coefficient of variation (wCV) of the tumour ROI as a measure of precision15. Bland-Altman plots with 95% confidence interval were plotted for the repeated baseline measures.
We added the parameter values from the treated patients to the Bland-Altman plots (mean vs. difference pre-post treatment). Patients with values outside the 95% confidence interval were considered to be affected by treatment for this parameter.
Results
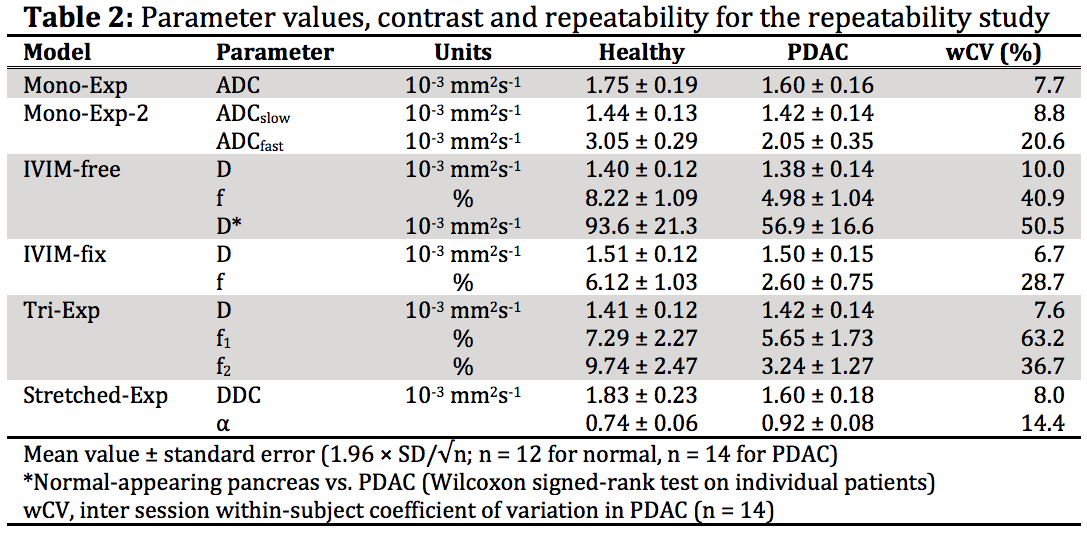
Table 2 shows the mean parameter values.
All models had high adjusted R2 (Fig 1). The adjusted R2 was lowest for the mono-exponential model both in normal-appearing pancreatic tissue as well as in the tumour.
We observed a significant correlation in mono-exp-2, between ADCslow and ADCfast (rho=0.45,p=0.023). All other models had unique parameters (Fig 2)
The wCV values (Table 2) of the diffusion related parameters (D, DDC; wCV=6.7–10%) were much lower than the wCV of the perfusion-related parameters (f, D*, f1, f2, α; wCV=14–63%). IVIM-fixed had the best repeatable diffusion related parameter, D, with wCV=6.7%, however, had a poor wCV for f of 29%. The stretched-exponential model had two repeatable parameters, α, with wCV=14.4% and DDC, with wCV=8.0%.
Figure 3 shows that all models detected a significant effect from treatment in 5 out of 9 patients in at least one of the parameters. For all, except the tri-exp model, the affected patients were the same (red, light green, olive green, purple and grey).
Discussion and Conclusions
We compared six DWI models for detection of treatment effects in PDAC patients. All models, except the tri-exponential model, detected the same patients for which parameters changed significantly during treatment. Furthermore, when multi-parametric models were used, different patients had different parameters affected (i.e. IVIM-fix had 1 patient with increased D and decreased f, 2 patients with only increased f and 2 patients with increased f and D), which enables discriminating between treatment effects. The simplest model that enabled discriminating between treatment effects was the double mono-exponential fit to b=0 and 100 s/mm2, and to b=100 and 600 s/mm2, which, from the multi-parametric models, enables shortest acquisitions and is the only one available on most commercial scanners. Therefore, this fit may be preferred.
As there was no correlation between f1 and f2 from the tri-exponential model, they likely are describing different, uncorrelated, processes. The high D*2 value relates to almost instant dephasing of the spins, with 57% of signal gone at b=10 s/mm2 and 83% gone at b=20 s/mm2. This should be associated with bulk motion of, for instance, blood in larger vessels9, whereas D*1 is probably more related to capillary perfusion. The tri-exp f2 was best at detecting treatment-induced changes from the tri-exponential parameters. Contrary, the tri-exp f1 did not allow detection of changes.
The D* from IVIM-free and IVIM-fixed were closer to D*2 than to D*1, suggesting that these models describe mainly the process from D*2. These results suggest that the IVIM-fits in PDAC patients might be describing bulk motion and large vessel flow effects16. Therefore, the clinical interpretation of the perfusion-related IVIM parameters (f, D*) is not as straightforward as the IVIM model suggests.
Acknowledgements
This work was funded by the Dutch cancer society - Alpe d’HuZes Grant no: 2013-5932.References
1. Katz MHG, Fleming JB, Bhosale P, et al. Response of borderline resectable pancreatic cancer to neoadjuvant therapy is not reflected by radiographic indicators. Cancer. 2012;118(23):5749–5756.
2. Ferrone CR, Marchegiani G, Hong TS, et al. Radiological and Surgical Implications of Neoadjuvant Treatment With FOLFIRINOX for Locally Advanced and Borderline Resectable Pancreatic Cancer. Ann. Surg. 2015;261(1):12–17.
3. Cassinotto C, Mouries A, Lafourcade J-P, et al. Locally Advanced Pancreatic Adenocarcinoma: Reassessment of Response with CT after Neoadjuvant Chemotherapy and Radiation Therapy. Radiology. 2014;273(1):108–116.
4. Klauß M, Mayer P, Bergmann F, et al. Correlation of Histological Vessel Characteristics and Diffusion-Weighted Imaging Intravoxel Incoherent Motion–Derived Parameters in Pancreatic Ductal Adenocarcinomas and Pancreatic Neuroendocrine Tumors. Invest. Radiol. 2015;50(11):792–797.
5. Lemke A, Laun FB, Klauß M, et al. Differentiation of pancreas carcinoma from healthy pancreatic tissue using multiple b-values: Comparison of apparent diffusion coefficient and intravoxel incoherent motion derived parameters. Invest. Radiol. 2009;44(12):769–775.
6. Re TJ, Lemke A, Klauß M, et al. Enhancing pancreatic adenocarcinoma delineation in diffusion derived intravoxel incoherent motion f-maps through automatic vessel and duct segmentation. Magn. Reson. Med. 2011;66(5):1327–1332.
7. Gurney-Champion OJ, Froeling M, Klaassen R, et al. Minimizing the Acquisition Time for Intravoxel Incoherent Motion Magnetic Resonance Imaging Acquisitions in the Liver and Pancreas. Invest. Radiol. 2016;51(4):211–220.
8. Bennett KM, Schmainda KM, Bennett RT, et al. Characterization of continuously distributed cortical water diffusion rates with a stretched-exponential model. Magn. Reson. Med. 2003;50(4):727–734.
9. van der Bel R, Gurney-Champion OJ, Froeling M, et al. A tri-exponential model for intravoxel incoherent motion analysis of the human kidney: in silico and during pharmacological renal perfusion modulation. Eur. J. Radiol. 2017;91(12):168–174.
10. Cercueil JP, Petit JM, Nougaret S, et al. Intravoxel incoherent motion diffusion-weighted imaging in the liver: comparison of mono-, bi- and tri-exponential modelling at 3.0-T. Eur. Radiol. 2015;25(6):1541–1550.
11. Manjón J V, Coupé P, Martí-Bonmatí L, et al. Adaptive non-local means denoising of MR images with spatially varying noise levels. J. Magn. Reson. Imaging. 2010;31(1):192–203.
12. Klein S, Staring M, Murphy K, et al. Elastix: A toolbox for intensity-based medical image registration. IEEE Trans. Med. Imaging. 2010;29(1):196–205.
13. Huizinga W, Poot DHJ, Guyader JM, et al. PCA-based groupwise image registration for quantitative MRI. Med. Image Anal. 2016;29:65–78.
14. Fedorov A, Beichel R, Kalpathy-Cramer J, et al. 3D Slicer as an image computing platform for the Quantitative Imaging Network. Magn. Reson. Imaging. 2012;30(9):1323–1341.
15. Barnhart HX, Barboriak DP. Applications of the repeatability of quantitative imaging biomarkers: a review of statistical analysis of repeat data sets. Transl. Oncol. 2009;2(4):231–235.
16. Wetscherek A, Stieltjes B, Laun FB. Flow-compensated intravoxel incoherent motion diffusion imaging. Magn. Reson. Med. 2015;74(2):410–419.
17. Le Bihan D, Breton E, Lallemand D, et al. Separation of diffusion and perfusion in intravoxel incoherent motion MR imaging. Radiology. 1988;168(2):497–505.
18. van Baalen S, Leemans A, Dik P, et al. Intravoxel incoherent motion modeling in the kidneys: Comparison of mono-, bi-, and triexponential fit. J. Magn. Reson. Imaging. 2016.
19. Lemke A, Laun FB, Simon D, et al. An in vivo verification of the intravoxel incoherent motion effect in diffusion-weighted imaging of the abdomen. Magn. Reson. Med. 2010;64(6):1580–1585.
Figures