4696
Free-breathing 3D quantitative susceptibility and T2* mapping of the human placenta: Initial experience in healthy pregnanciesZungho Zun1,2,3,4 and Catherine Limperopoulos1,2,3,4
1Division of Diagnostic Imaging and Radiology, Children's National Medical Center, Washington, DC, United States, 2Division of Fetal and Transitional Medicine, Children’s National Medical Center, Washington, DC, United States, 3Department of Pediatrics, George Washington University, Washington, DC, United States, 4Department of Radiology, George Washington University, Washington, DC, United States
Synopsis
Quantitative susceptibility mapping (QSM) is an emerging imaging technique for measuring magnetic susceptibility of tissue, and may have the potential for depicting hypoxia, hemorrhage, and calcification of the placenta. In this study we demonstrate simultaneous acquisition for QSM and T2* mapping of the human placenta using a 3D multi-echo gradient echo sequence with maternal free breathing. Compared to T2-weighted images, both QSM and T2* maps demonstrate more lobulated contrast in the placenta with lower susceptibility and higher T2* values within the lobules. This is the first study to investigate QSM of the human placenta in vivo.
INTRODUCTION
Quantitative susceptibility mapping (QSM) is an emerging imaging method for measuring magnetic susceptibility of tissue, which represents the distribution of biomaterials such as deoxyhemoglobin, hemorrhage and calcification. In this study we demonstrated simultaneous acquisition for QSM and T2* mapping of the human placenta with maternal free breathing. While QSM and susceptibility-weighted imaging of the placenta have been explored in animal models1,2, this is the first study to investigate QSM of the human placenta in vivo.METHODS
Five healthy pregnant women underwent fetal MRI under a protocol approved by institutional review board. Image acquisition for QSM and T2* mapping was performed using a 3D multi-echo RF-spoiled gradient echo sequence with flow compensation. Imaging parameters include TR = 93 ms, 16 TEs ranging from 4.0 to 77.7 ms with echo spacing of 4.9 ms, bandwidth = ±50 kHz, flip-angle = 20°, FOV = 36-38 cm, matrix size of 320x128, and 22-30 slices with slice thickness of 3 mm. Prospective respiratory triggering was performed using respiratory bellows, and an acquisition window of 30% was placed at end-expiration. For the outside acquisition window, a dummy acquisition was performed to minimize perturbation of the transition and steady state of magnetization. Total scan time was 6-7 min with parallel imaging (acceleration factor=2). T2-weighted 2D single-shot fast spin echo images were also acquired as a reference. All MRI scans were performed on a GE MR450 1.5 T scanner using an 8-channel cardiac coil. QSM reconstruction was performed using the approach of morphology-enabled dipole inversion (MEDI)3. T2* was calculated using nonlinear fitting of multi-echo data. The placenta was manually delineated on each slice for QSM reconstruction and T2* fitting. Voxels with T2* values outside the range [first TE /3, last TE x3] were assigned by T2* values of adjacent voxels4.RESULTS
One pregnant woman was excluded from the analysis due to severe motion artifacts in the images. Gestational age of the remaining four pregnant women at fetal MRI was 24 6/7, 26 5/7, 34, and 34 3/7 weeks, respectively. Figure 1 shows the distribution of susceptibilities within the placenta for each subject. All subjects showed a symmetric susceptibility distribution but with different variation. Figure 1 also contains median T2* values of the placenta, and Figure 2 shows the T2* values as a function of gestational age. There was a trend for decreasing T2* with advancing gestational age, similar to T2 of the placenta5. Figure 3 demonstrates susceptibility and T2* maps as well as reference T2-weighted images of one pregnant subject. Both susceptibility and T2* maps show lobulation on the placenta more pronounced than T2-weighted images. Regions inside the lobules show lower susceptibility and higher T2* values.DISCUSSION
We demonstrate for the first time the feasibility of performing QSM of the human placenta. Our preliminary data showed different distributions of susceptibilities across subjects, and placentas with a wider variation of susceptibilities showed lower T2* as expected. Lower susceptibility and higher T2* values within the lobules of the placenta may be due to higher oxygenation in these highly vascularized regions. QSM may also have the potential to distinguish hypoxia and hemorrhage from calcification given that they have opposite signs on QSM while they all show reduced T2* values. Future work will explore comparison of QSM between high-risk and low-risk pregnancies.Acknowledgements
R01 HL116585-01 from NIH National Heart, Lung, and Blood Institute, and UL1TR000075/KL2TR000076 from the NIH National Center for Advancing Translational Sciences.References
1. Krishnamurthy U, Szalai G, Neelavalli J, et al. Quantitative T2 changes and susceptibility-weighted magnetic resonance imaging in murine pregnancy. Gynecol Obstet Invest 2014;78:33-40. 2. Zhu A, Sharma SD, Nguyen S, et al. Ferumoxytol-Enhanced Quantitative Susceptibility Mapping of the Rhesus Placenta. ISMRM 2017; Abstract 4867. 3. Liu J, Liu T, de Rochefort L, et al. Morphology enabled dipole inversion for quantitative susceptibility mapping using structural consistency between the magnitude image and the susceptibility map. Neuroimage 2012;59:2560–2568. 4. Marques JP, Khabipova D, Gruetter R. Studying cyto and myeloarchitecture of the human cortex at ultra-high field with quantitative imaging: R1, R2* and magnetic susceptibility. Neuroimage. 2017;147:152-163. 5. Wright C, Morris DM, Baker PN, et al. Magnetic resonance imaging relaxation time measurements of the placenta at 1.5 T. Placenta. 2011;32:1010-1015.Figures
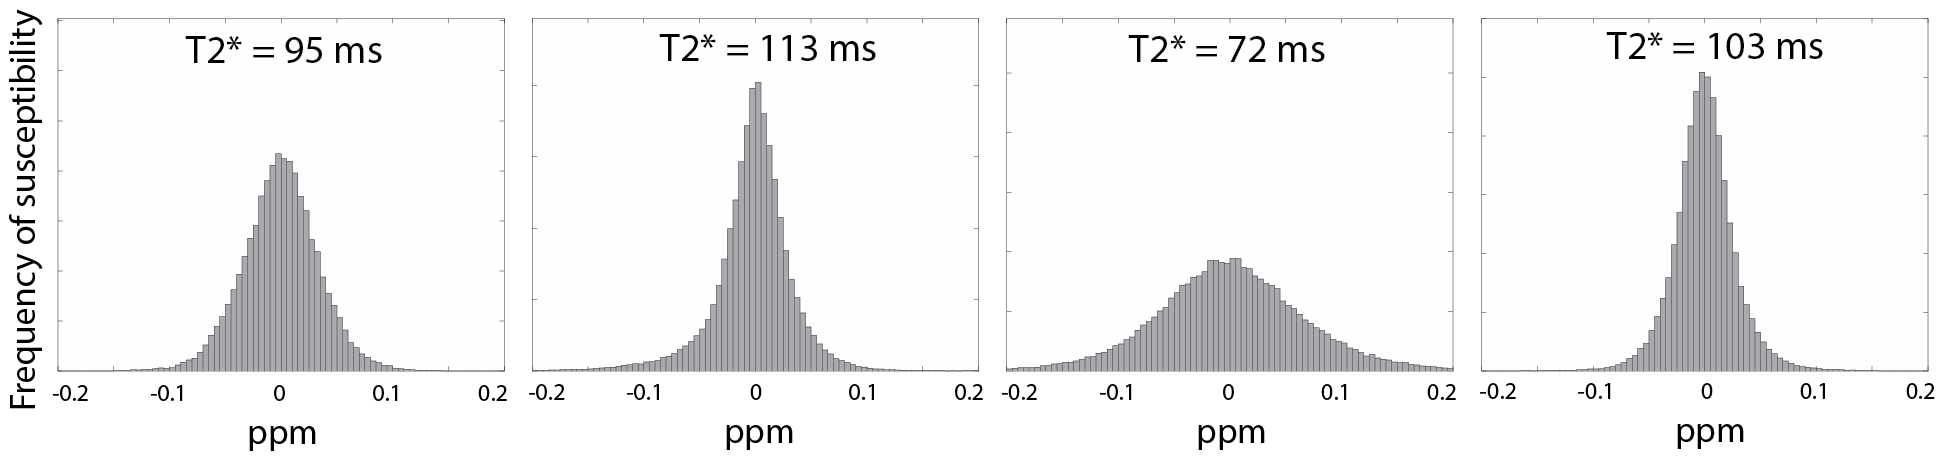
Figure 1. Distribution of
susceptibilities within the placenta of four healthy pregnant women with
gestational age of 24 6/7, 26 5/7, 34, and 34 3/7 weeks (from left). Areas under
the curve are all normalized. Median T2* value is also displayed for each
subject.
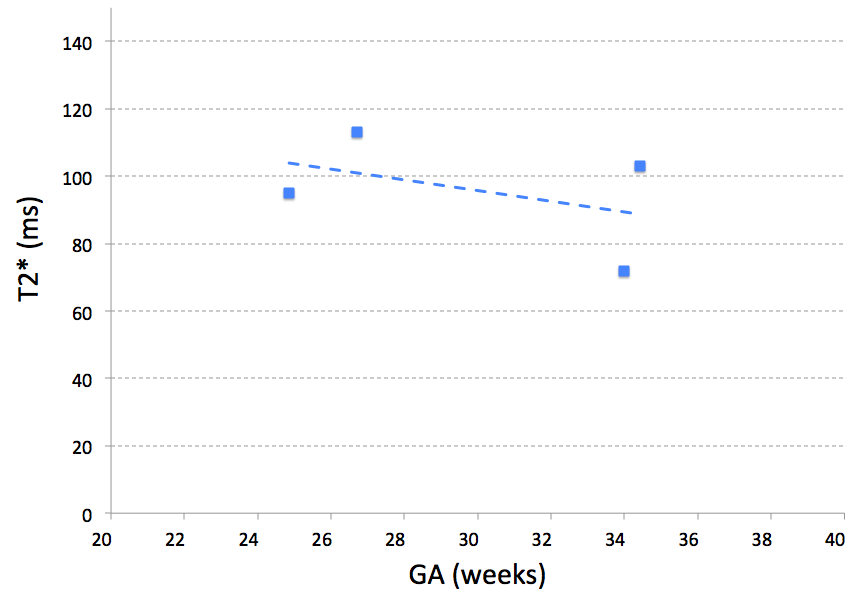
Figure 2. Median T2*
values within the placenta of each subject as a function of gestational age
(GA) at fetal MRI.
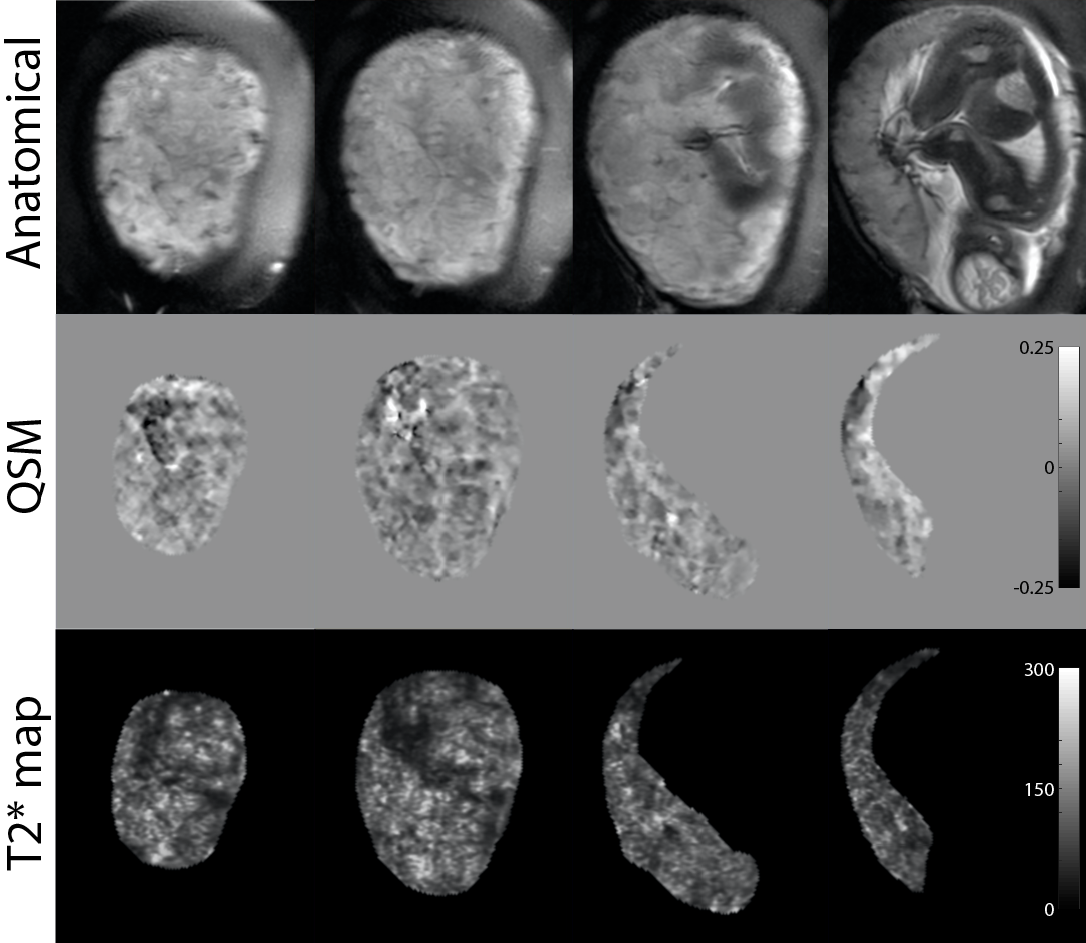
Figure 3. Susceptibility (in ppm) and T2* (in ms) maps along with T2-weighted anatomical images of one representative
healthy pregnant woman in selected slice locations (GA: 34 weeks). Compared to
T2-weighted images, both susceptibility and T2* maps demonstrate more lobulated
contrast with lower susceptibility and higher T2* values inside the lobules.