4694
Background-suppressed pulsed arterial spin labeling of placental perfusion at 1.5T1Department of Bioengineering, University of Pennsylvania, Philadelphia, PA, United States, 2Department of Neurology, University of Pennsylvania, Philadelphia, PA, United States, 3Department of Radiology, University of Pennsylvania, Philadelphia, PA, United States, 4Department of Obstetrics and Gynecology, University of Pennsylvania, Philadelphia, PA, United States
Synopsis
We present the feasibility of measuring and quantifying placental blood flow in healthy pregnant subjects at 1.5T. We used a Flow Alternating Inverson Recovery (FAIR) scheme with background suppression. Using statistical parametric mapping, discrete regions of labeling were observed, likely corresponding to individual spiral artery distributions.
Introduction
Common high-risk pregnancies are believed to be attributed to insufficient placental perfusion [1]. Previous studies have developed non-contrast MR measurements of placental perfusion using arterial spin labeled (ASL) MRI [2-4]. Prior work in humans used either Fluid-Attenuated Inversion Recovery (FAIR) without background suppression at 0.5T [2] or using pseudocontinuous labeling (pCASL), at 3 Tesla [3]. In this study, we sought to validate FAIR ASL at 1.5 Tesla, using background suppression to reduce physiological noise [5].Methods
We imaged 19 healthy singleton pregnancies (GA range = 17 weeks - 38 weeks and 4 days) to characterize normal placental perfusion at 1.5T. We acquired HASTE localizer images in four axial slice positions through the placenta, followed by free-breathing, pulsed arterial spin labeling (PASL) in the same region with a FAIR labeling scheme and a 2D EPI readout (4 slices, 12.5 mm gap, GRAPPA rate=2, matrix=64x64, target voxel size = 4x4x10 mm3). A background suppression (BS) scheme was optimized to suppress the static tissue signal with T1s between 650 and 4000 ms to 10% of its equilibrium value. An M0 scan with no magnetization preparation and identical imaging parameters was also acquired for quantification. BS FAIR ASL was acquired with several inversion times and test-retest reliability was also assessed in N=8 subjects.
Data analysis included motion correction of the ASL images using a nonlinear deformation [6] and compared signal changes in three types of ROI: manual tracing of the placenta based on the M0 image and statistical parametric mapping based on temporal correlation with the label/control paradigm thresholded at p<0.05 uncorrected or Bonferroni corrected for the number of placental voxels. We estimated placental blood flow using the equation $$$F=\frac{6000\cdot \Delta M \cdot e^{\frac{TI}{1.531}}}{2\cdot M0\cdot TI}$$$ with adjustment of M0 for 90% background suppression and using 1.53s for blood T1 in women [7].
Results
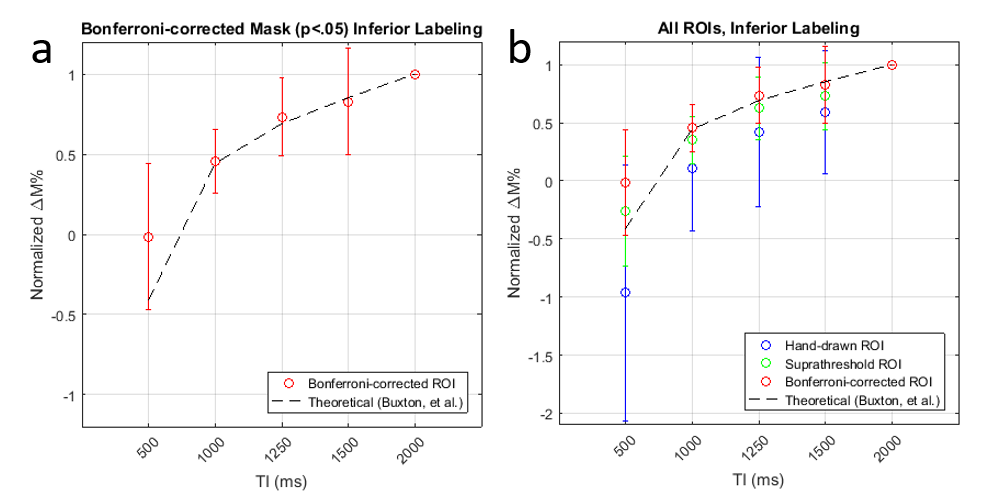
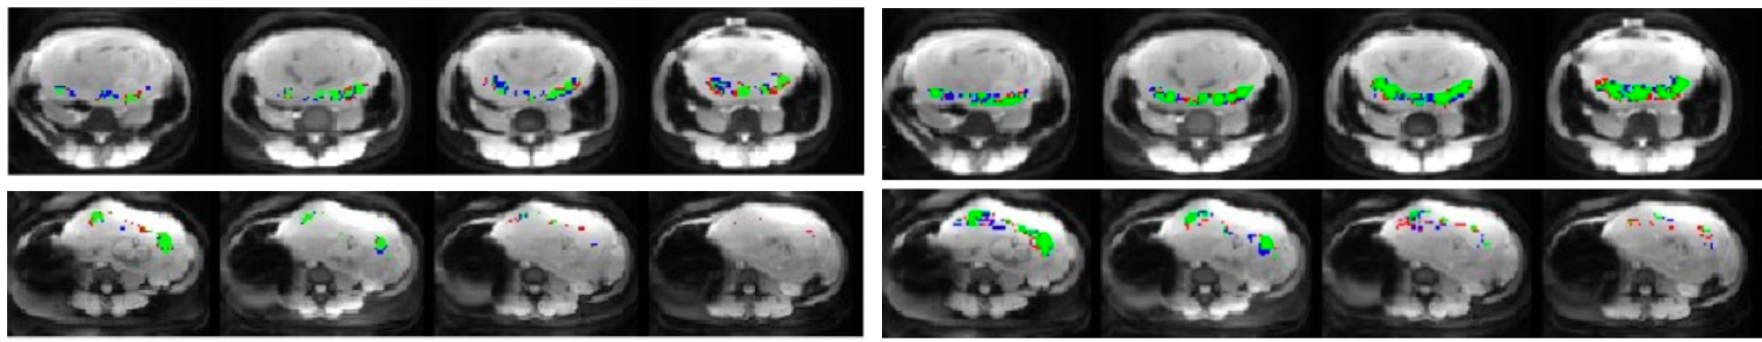
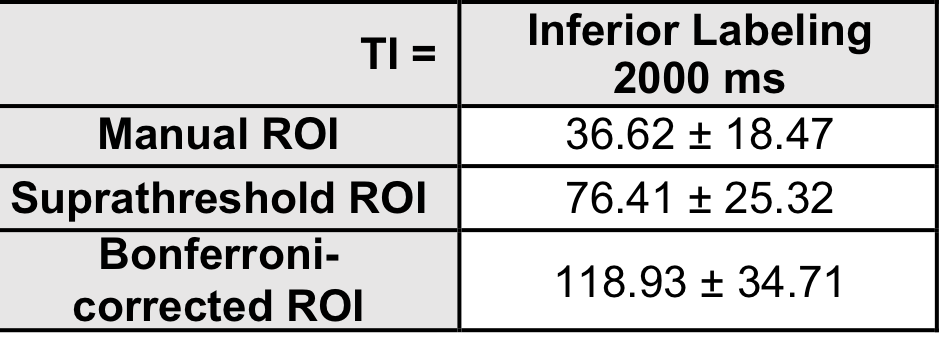
Using data from the p<0.05 corrected voxels, ASL signal changes starting at TI=1000 increased with TI in a manner consistent with the increasing signal regime [8] based on an estimated arterial transit time of 700 msec [3]. (Fig. 1a). Compared to the other ROIs, the Bonferroni-corrected ROI produced a larger signal (Fig. 1b). When comparing the agreement between two repetitions of the 2000 ms inferior labeling using a more generous P<0.05 uncorrected mask, we found considerable but not perfect overlap (Fig. 2). Average overlap was 54% and 50% for the p<0.05 corrected and uncorrected maps after excluding two subjects with very poor reproducibility. Estimated placental perfusion results using the three ROI are presented in Fig. 3.Discussion
Background suppressed 1.5T FAIR ASL signal changes yielded a TI dependence consistent with ASL theory and provided reproducible maps of placental blood flow. As expected, placental perfusion was highest in the ROI comprised of the voxels with the most significant label/control effect. Note that placental “perfusion” is not homogeneous, but rather signal changes are localized to discrete regions likely representing the distributions of individual spiral arteries, which deliver blood to chorionic villi. Some of these spiral artery distributions are found to infarcted in patients with fetal growth retardation [9], and placental ASL provides a potential approach for detecting this pathology in vivo. Placental blood flow values were in the range of previously published values [2,3], though when averaged across the anatomically defined ROI, values were considerably lower. While these preliminary studies did not provide whole placental coverage, multiband and accelerated imaging strategies can be used to greatly increase the slice coverage.Conclusion
We demonstrated the feasibility of measuring and quantifying placental blood flow in healthy pregnant subjects in the 2nd and 3rd trimester using background suppressed FAIR ASL at 1.5T. Placental ASL provides an approach for noninvasively mapping and quantifying maternal blood flow to the placenta.Acknowledgements
National Child Health and Human Development (U01-HD087180); National Science Foundation (DGE-1321851); National Institute of Biomedical Imaging and Bioengineering (T32-EB009384); National Institute of Biomedical Imaging and Bioengineering (P41-EB015893); National Heart Lung and Blood Association (R00-HL108157); National Child Health and Human Development (R00-HD074649)References
- I. Derwig et al., "Association of placental perfusion, as assessed by magnetic resonance imaging and uterine artery Doppler ultrasound, and its relationship to pregnancy outcome," Placenta, vol. 34, no. 10, pp. 885-91, Oct 2013.
- P. A. Gowland et al., "In vivo perfusion measurements in the human placenta using echo planar imaging at 0.5 T," (in English), Magnetic Resonance in Medicine, vol. 40, no. 3, pp. 467-473, Sep 1998.
- X. Shao et al., "Measuring human placental blood flow with multi-delay 3D GRASE pseudo-continuous arterial spin labeling at 3 Tesla," in Proc. Intl. Soc. Mag. Reson. Med. 25, Honolulu, HI, 2017.
- K. D. Ludwig et al., "Perfusion MRI of the Placenta: Preliminary Results using ASL FAIR and Ferumoxytol DCE MRI in the Rhesus Macaque," in Proc. Intl. Soc. Mag. Reson. Med. 25, Honolulu, HI, 2017, 2017.
- F. Q. Ye, J. A. Frank, D. R. Weinberger, and A. C. McLaughlin, "Noise reduction in 3D perfusion imaging by attenuating the static signal in arterial spin tagging (ASSIST)," Magn Reson Med, vol. 44, no. 1, pp. 92-100, Jul 2000.
- B. B. Avants, N. J. Tustison, G. Song, P. A. Cook, A. Klein, and J. C. Gee, "A reproducible evaluation of ANTs similarity metric performance in brain image registration," Neuroimage, vol. 54, no. 3, pp. 2033-44, Feb 01 2011.
- X. Zhang et al., "In vivo blood T(1) measurements at 1.5 T, 3 T, and 7 T," Magn Reson Med, vol. 70, no. 4, pp. 1082-6, Oct 2013.
- R. B. Buxton, L. R. Frank, E. C. Wong, B. Siewert, S. Warach, and R. R. Edelman, "A general kinetic model for quantitative perfusion imaging with arterial spin labeling," Magn Reson Med, vol. 40, no. 3, pp. 383-96, Sep 1998.
- W. Mifsud and N. J. Sebire, "Placental pathology in early-onset and late-onset fetal growth restriction," Fetal Diagn Ther, vol. 36, no. 2, pp. 117-28, 2014.
Figures