4693
Characterization of uterine artery geometry in normal pregnancy with time-of-flight angiographyEileen Hwuang1, M. Dylan Tisdall1, Nadav Schwartz1, John A. Detre1, and Walter R. Witschey1
1University of Pennsylvania, Philadelphia, PA, United States
Synopsis
While measuring uterine artery (UtA) impedance is commonly used to assess for risk of preeclampsia and intrauterine growth restriction, little is understood about the remodeling process during gestation. An improved understanding of geometrical changes can lead to predictive biomarkers of adverse pregnancies. Here we present a method of measuring path length and curvature of the tortuous UtAs by segmentation and centerline extraction of time-of-flight MR angiography. We show in 8 pregnant subjects in the 2nd and 3rd trimester that this technique is feasible for investigating longitudinal trends of UtA remodeling and cases of maladaptation.
Purpose
During pregnancy, the maternal uterine arteries (UtAs) undergo vasodilation and elongation to accommodate the gravid uterus and match fetal demand for oxygen and nutrients [1]. Maternal arterial dysfunction is characteristic of pregnancy disorders such as preeclampsia [2] and patients have inward smooth muscle hypertrophy, increased wall thickness, and limited vasodilation at delivery [3]. However, there is limited quantitative information about temporal remodeling of UtAs. This information may add value to diagnosis and screening of hypertensive pregnancy disorders [1]. We have shown that noninvasive, non-contrast MRI is feasible for characterization of UtA anatomy and hemodynamics in humans [4]. Our objective was to quantitatively describe the geometry of the pelvic arteries in healthy pregnant subjects using time-of-flight (TOF) MRI angiography. We hypothesize that the UtA lengthens and becomes more tortuous with gestational age.Methods
We analyzed TOF MRI data (Fig. 1a) from 8 healthy pregnant subjects (n=2 in the 2nd trimester, and n=6 in the 3rd trimester, gestational age = 29.9±2.8 weeks). The TOF parameters were: TR=394 ms, TE=4.4 ms, flip angle=50°, and diastolic ECG-gating. The TOF angiogram was segmented (Seg3D), isosurfaces and centerlines were generated, and length and curvature were quantified (VMTK) (Fig. 1b). The centerline connected the center points of maximally-inscribed spheres, approximated by a Voronoi diagram, along the interior of the vessel. The curvature, $$$\kappa$$$, was defined as the reciprocal of the radius, $$$r$$$, of the osculating circle ($$$\kappa=\frac{1}{r}$$$) tangent to the centerline in the normal direction using the Frenet reference system (Fig. 1c). Vessel tortuosity was measured using the root mean squared (RMS) curvature. Pearson’s R correlation was performed to test for linear correlations between path length, RMS curvature, and gestational age.Results
Figure 2a shows the centerline and UtA curvature histograms of a representative subject (Fig. 2b,c). The UtAs formed a tortuous structure, looped superiorly, and crossed the external iliac arteries towards the placenta at the fundus of the uterus. Subject demographics and geometric quantities, anatomical length, curvature for all subjects are reported in Figure 3. The unilateral length of the UtAs from the bifurcation of the internal and external iliac arteries to the most inferior point of the UtAs was 130.5 ± 21.0 mm (range = 92.4-161.4 mm). We observed an increasing trend (R2 = 0.12, p = 0.18) between gestational age and unilateral length (Fig. 4). The RMS curvature was found to be 0.12 ± 0.04 mm-1 (range = 0.07-0.19 mm-1) within the same UtA segments. There was a decreasing trend between gestational age and RMS curvature from the bifurcation to the most inferior point of the UtA (R2 = 0.07, p = 0.30; Fig. 5). The difference between the left and right UtA length was 13±6% and RMS curvature was 25±19%.Discussion
This study demonstrated quantitative characterization of UtA length and curvature geometry using TOF MRI angiography. Curvature was found to be a quantitatively meaningful descriptor of UtA tortuosity and could differentiate bilateral UtA anatomical heterogeneity. This may reflect variations in placental location, viability and distal uterine and spiral arterial remodeling. Additionally, this study provided important preliminary data regarding the association between UtA length, curvature and gestational age. It was expected that the UtA path length would increase during angiogenesis and become more tortuous to accommodate fetal growth and decreasing blood flow pulsatility. However, we saw a decrease in curvature. Based on our initial findings, to detect a 20 mm difference in length between 2nd and 3rd trimester, we would need a sample of 18 subjects. Similarly, to detect a 0.04 mm‑1 difference in curvature, we would need 16 subjects. UtA remodeling is believed to rapidly occur within the first two trimesters to anticipate increased fetal oxygen and metabolic demand, tapering off by 3rd trimester [1, 5]. We observed that path length and curvature vary considerably with laterality. Future work will investigate curvature and tortuosity in patients with adverse pregnancy outcomes.Conclusions
The major contributions of this study are 1) the development an approach to measuring length and curvature of the UtAs, and 2) trends toward UtA elongation and decreased tortuosity with gestational age. Additional subjects will confirm that these trends are consistent with UtA remodeling in animals [1]. This approach is applicable to studying UtA remodeling early in pregnancy and can be used to investigate the relationship between vascular geometry and hemodynamics.Acknowledgements
National Child Health and Human Development (U01-HD087180); National Science Foundation (DGE-1321851); National Institute of Biomedical Imaging and Bioengineering (T32-EB009384); National Institute of Biomedical Imaging and Bioengineering (P41-EB015893); National Heart Lung and Blood Association (R00-HL108157); National Child Health and Human Development (R00-HD074649)References
- G. Osol and L. G. Moore, "Maternal uterine vascular remodeling during pregnancy," Microcirculation, vol. 21, no. 1, pp. 38-47, Jan 2014.
- A. T. Papageorghiou, C. K. Yu, and K. H. Nicolaides, "The role of uterine artery Doppler in predicting adverse pregnancy outcome," Best Pract Res Clin Obstet Gynaecol, vol. 18, no. 3, pp. 383-96, Jun 2004.
- S. S. Ong, P. N. Baker, T. M. Mayhew, and W. R. Dunn, "Remodeling of myometrial radial arteries in preeclampsia," Am J Obstet Gynecol, vol. 192, no. 2, pp. 572-9, Feb 2005.
- E. Hwuang, M. Vidorreta, N. Schwartz, J. A. Detre, D. J. Licht, and W. R. Witschey, "Assessment of uterine artery hemodynamics in normal pregnancy with 4D Flow MRI," in Proc. Intl. Soc. Mag. Reson. Med. 25, Honolulu, HI, 2017, 2017.
- J. C. Konje, E. S. Howarth, P. Kaufmann, and D. J. Taylor, "Longitudinal quantification of uterine artery blood volume flow changes during gestation in pregnancies complicated by intrauterine growth restriction," BJOG, vol. 110, no. 3, pp. 301-5, Mar 2003.
Figures
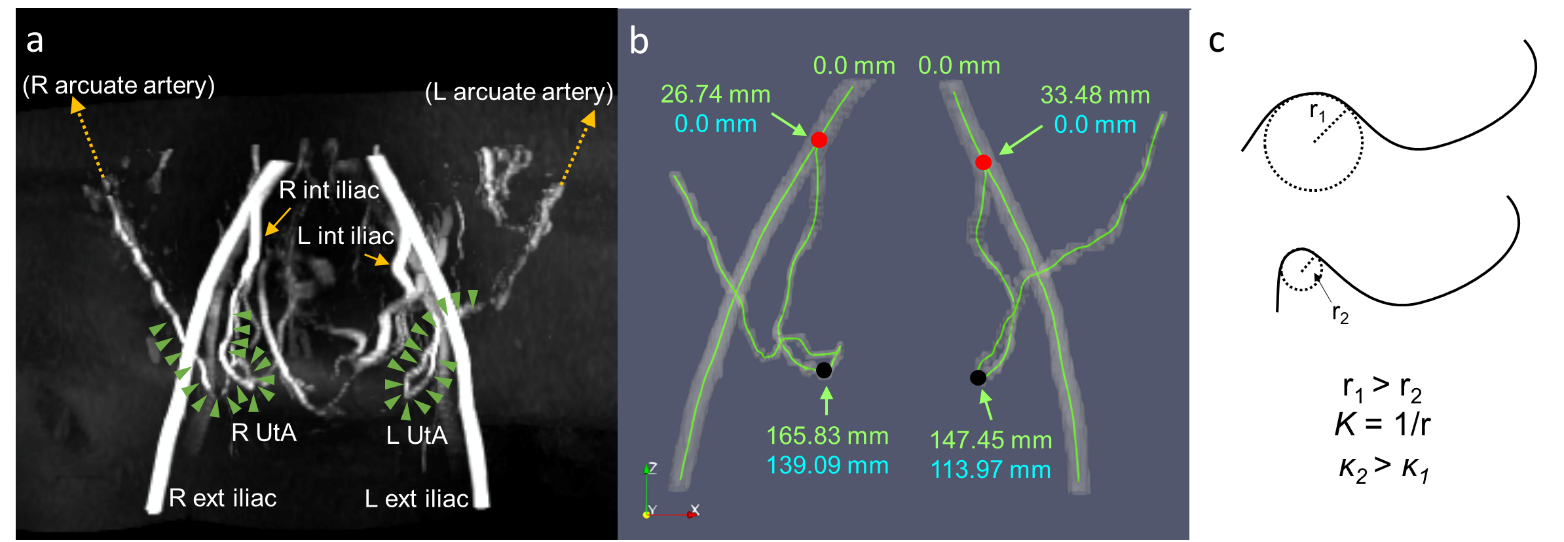
Figure 1: a) 3D maximum intensity projection
of the TOF angiogram in a representative subject. The green arrowheads
delineate the UtAs after branching from the internal iliac arteries. b) The
isosurface and centerline extraction of the same subject. Red dots represent
the starting landmarks at the bifurcation of the internal and external iliac
arteries. Black dots represent the ending landmarks at the most inferior point
of the UtAs. The path length and root mean squared curvature reported in this
study are calculated from the blue coordinates. C) Diagram of curvature
computation based on the osculating circle, r=radius, κ=curvature.
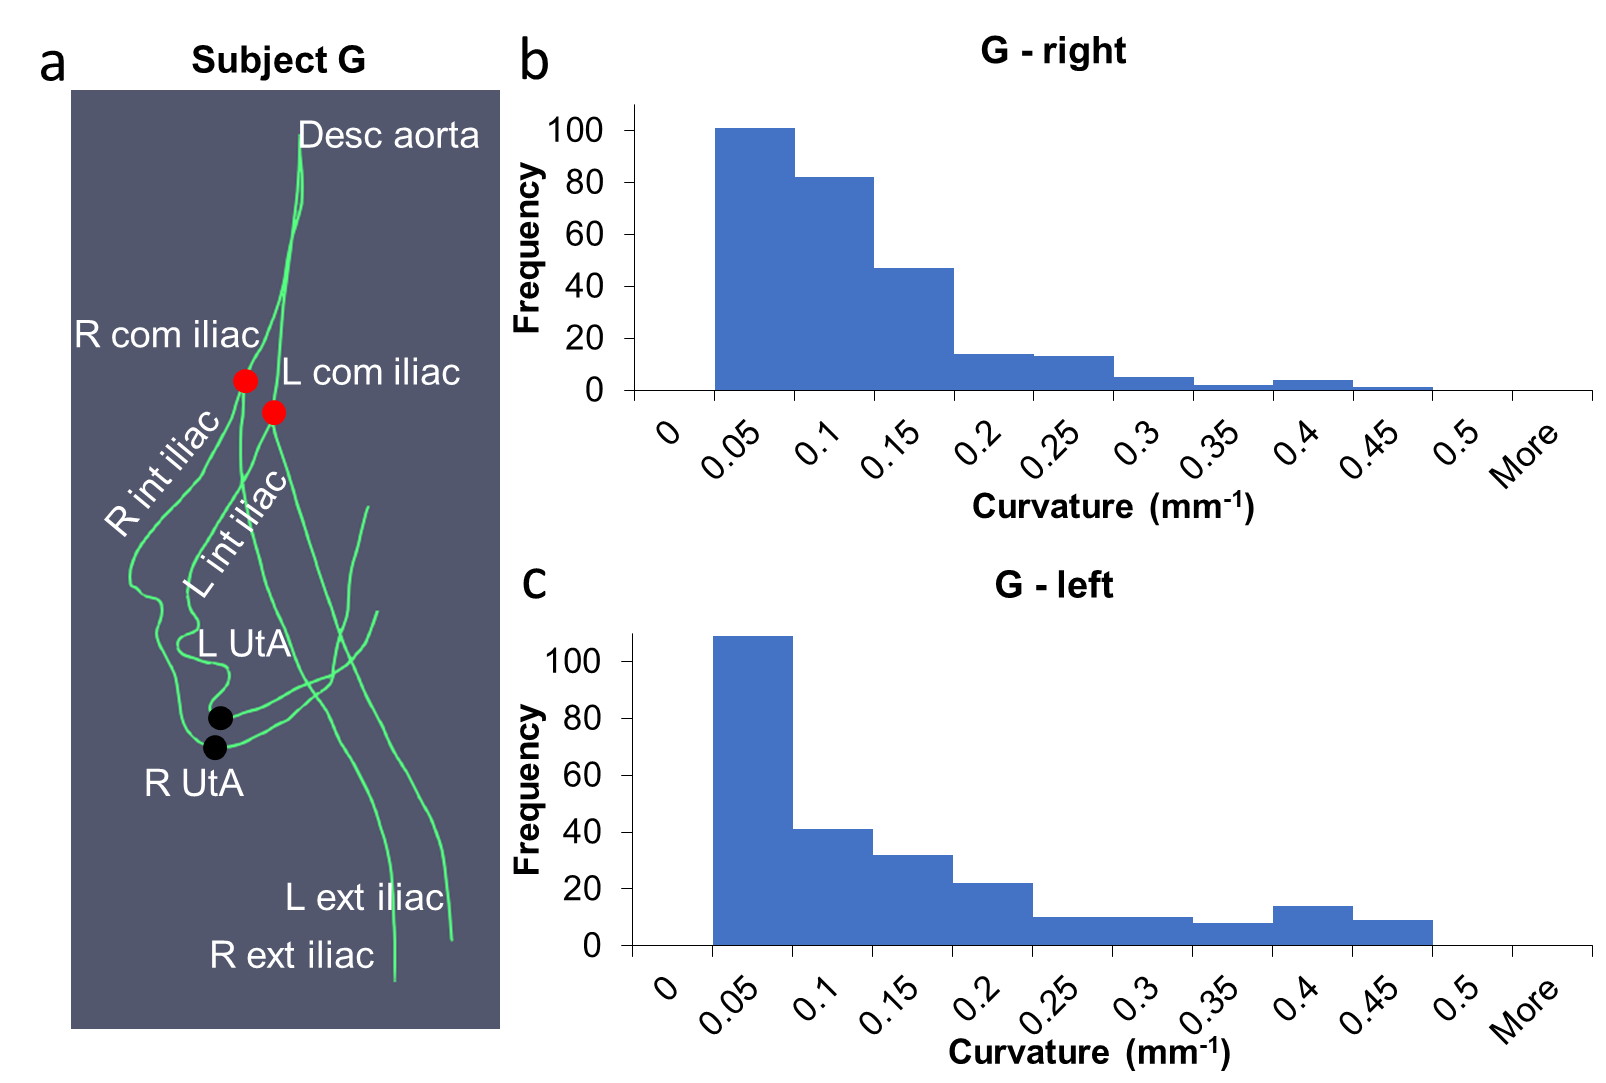
Figure 2: a) Centerlines of Subject G with
difference in tortuosity between the left and right UtA. It extends from the
descending aorta through the common iliac arteries, internal iliac arteries, UtAs,
and external iliac arteries. Red dots represent the starting landmarks at the
bifurcation of the internal and external iliac arteries. Black dots represent
the ending landmarks at the most inferior point of the UtAs. The curvature
histogram of the right UtA (b) has a narrower distribution than the left UtA
(c).
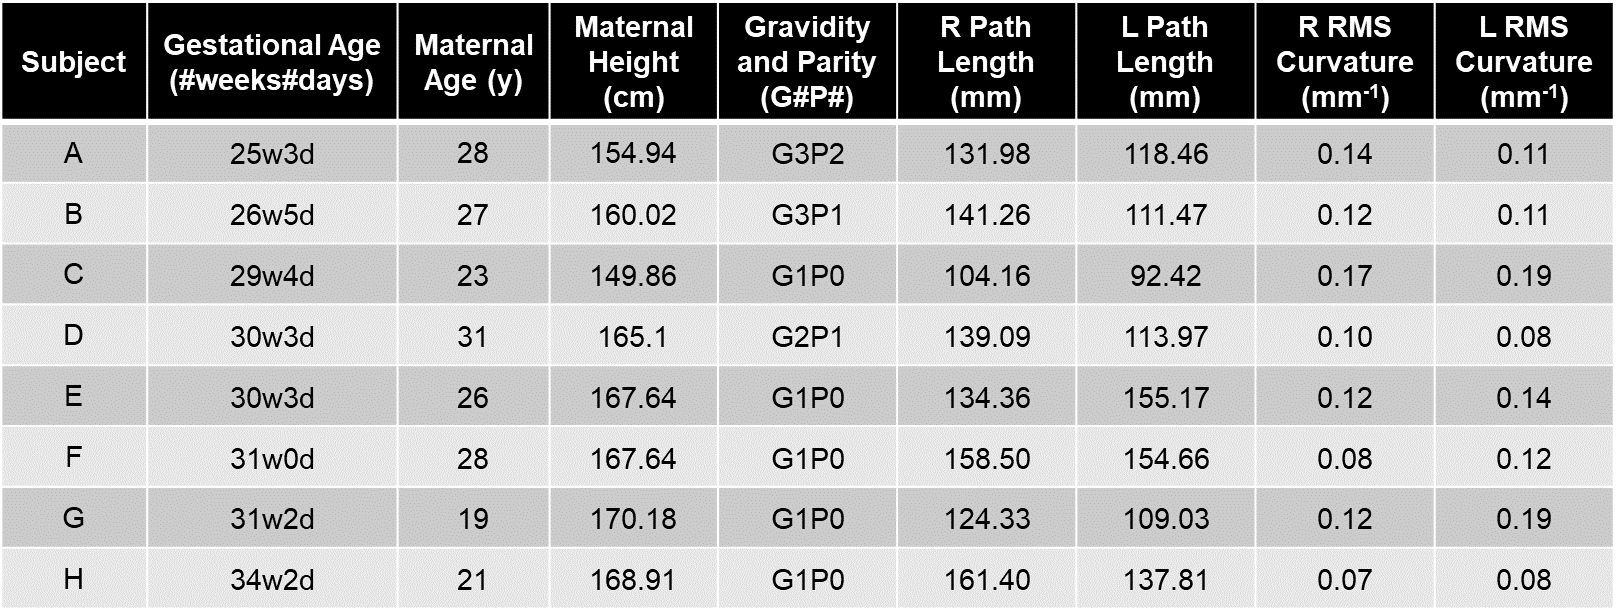
Figure 3: This table reports data from the eight
subjects analyzed in this study with gestational age, maternal age, maternal
height, gravidity, parity, measurements of path length between the landmarks
annotated in Fig. 1b, and root mean squared (RMS) curvature between the
landmarks (R = right, L = left).
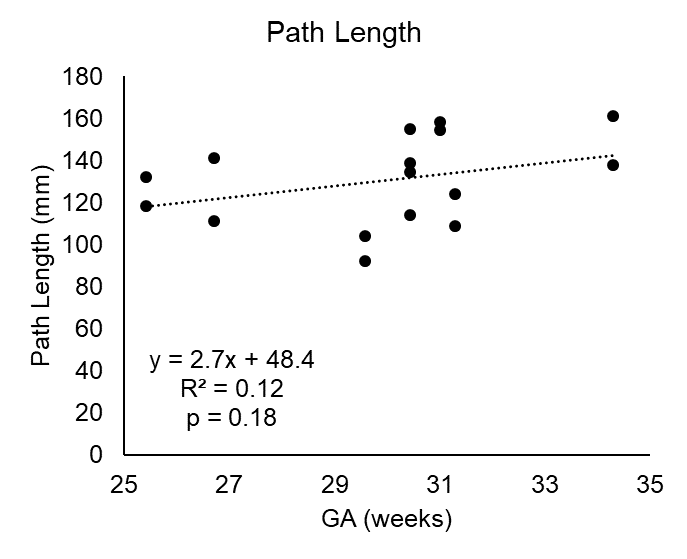
Figure 4: Plot with linear correlation
results showing increasing trend in path length over gestational age (GA) in
the left UtA and right UtA.
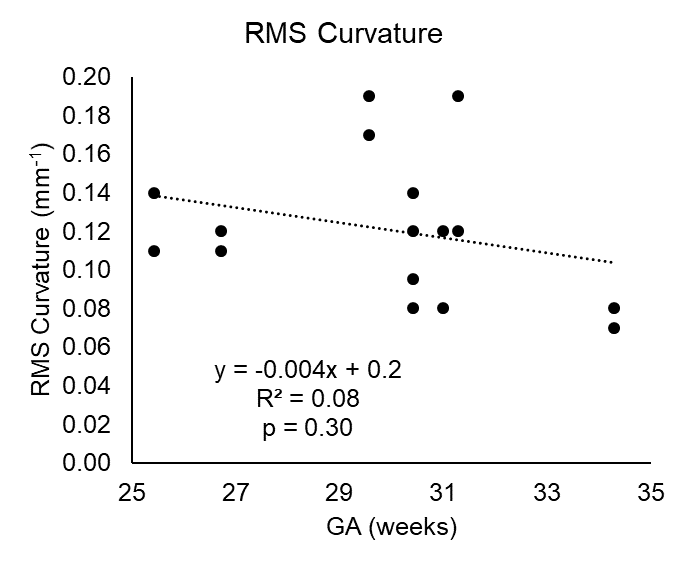
Figure 5: Plot with linear correlation
results showing curvature with decreasing trend with gestational age (GA) in
the left UtA and right UtA.