4690
Utility of histogram analysis of apparent diffusion coefficient maps in differential diagnosis of uterine sarcoma and degenerated uterine leiomyoma1The First Affiliated Hospital of Zhengzhou University, Zhengzhou, China
Synopsis
Histogram analysis of ADC values could provide more useful information than the mean ADC values and it has been proved to be valuable to evaluate tumor heterogeneity. We analyzed histogram features of ADC maps of uterine sarcoma and degenerated uterine leiomyoma. From our study, histogram analysis of ADC values has a high diagnostic efficiency in differential diagnosis of uterine sarcoma and degenerated uterine leiomyoma.
Purpose
To investigate the value of histogram analysis of apparent diffusion coefficient (ADC) maps for discriminating uterine sarcoma and degenerated uterine leiomyoma.Method
We retrospectively collected 41 cases of uterine sarcoma (median age was 58 years; [range, 16-82 years]) and 46 cases of degenerated uterine leiomyoma (mean age was 43 years; [range, 29-66 years]) eventually confirmed by pathology from August 2012 to April 2016. All of these patients without invasive examinations (such as biopsy, fine-needle aspiration) within three days underwent an MRI examination including DWI sequence. Following the MRI examination, all patients received surgery or biopsy within two weeks, and pathological results were obtained subsequently. Data were collected on a MAGNETOM Skyra 3T MR scanner (SiemensHealthcare, Erlangen, Germany) with a 16-channel body coil.The following sequences in the imaging protocol were used: T2-weighted fast spin-echo images in the axial, sagittal and coronal planes (repetition time [TR] / echo time [TE], 3000 to 4300 / 90 to 108 millisecond); T1-weighted spin-echo images in the axial planes (TR/TE, 732 / 12 msec; 160 flip angle); fat-suppressed T1-weighted spin-echo images in the axial, sagittal and coronal planes (TR/TE, 3.95 / 1.8 msec; 9 flip angle) after intravenous administration of gadopentetate dimeglumine (one mmol/kg; Magnevist; Berlex Laboratories, Montville, NJ). Slice thickness was 4-5 mm with a 1mm gap for all acquisitions.Before administration of contrast medium, axial DW images were obtained (TR/TE, 3500/58 msec; b factors, 0 and 800s/mm2; 128 × 128 matrix; field of view 300mm; 4mm section thickness with 1mm gap; sensitivity encoding reduction factor, 2; 4 excitations; acquisition time, 1.56min). DWI was used for fat suppression in the spin-echo echo-planar imaging sequence, with free breathing during acquisition. Regions of interest (ROIs) of every slice over the tumors were manually drawn on the ADC maps under the guidance of two radiologists who were bland to the pathological results of each tumors. ADC histogram of every ROI of each tumor slice was generated with Matlab(R2016b) software (MathWorks Inc., U.S.), and histogram parameters of the associated ADC values of every case were derived. The histogram parameters were as follows: the 5th, 10th, 25th, 50th, 75th, 90th, 95th percentiles and the mean value of ADC, kurtosis, and skewness.Result
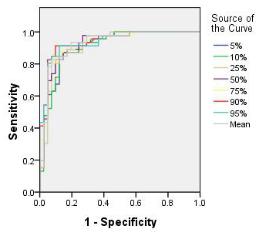
Uterine sarcoma demonstrated significantly lower mean values of ADC, 5%, 10%, 25%, 50%, 75%, 90%, 95% than degenerated uterine leiomyoma (P < 0.05)(Table 1). ROC curve analysis of the 90% yielded the best area under the ROC curve (AUC;0.941), sensitivity of 91.3%, and specificity of 90.2%, with a cutoff value of 1.155×10⁻³mm2/s(Figure 1).Acknowledgements
No acknowledgement found.References
1. Guan Y, Shi H, Chen Y, et al. Whole-lesion histogram analysis of apparent diffusion coefficient for the assessment of cervical cancer[J]. Chinese Journal of Chromatography, 2015, 40(2):212-217.
2. Jerome NP, Miyazaki K, Collins DJ, et al. Repeatability of derived parameters from histograms following non-Gaussian diffusion modelling of diffusion-weighted imaging in a paediatric oncological cohort[J]. European Radiology, 2017, 27(1):345-353.
3.Barral M, Placé V, Dautry R, et al. Magnetic resonance imaging features of uterine sarcoma and mimickers.[J]. Abdominal Radiology, 2017:1-11.
Figures
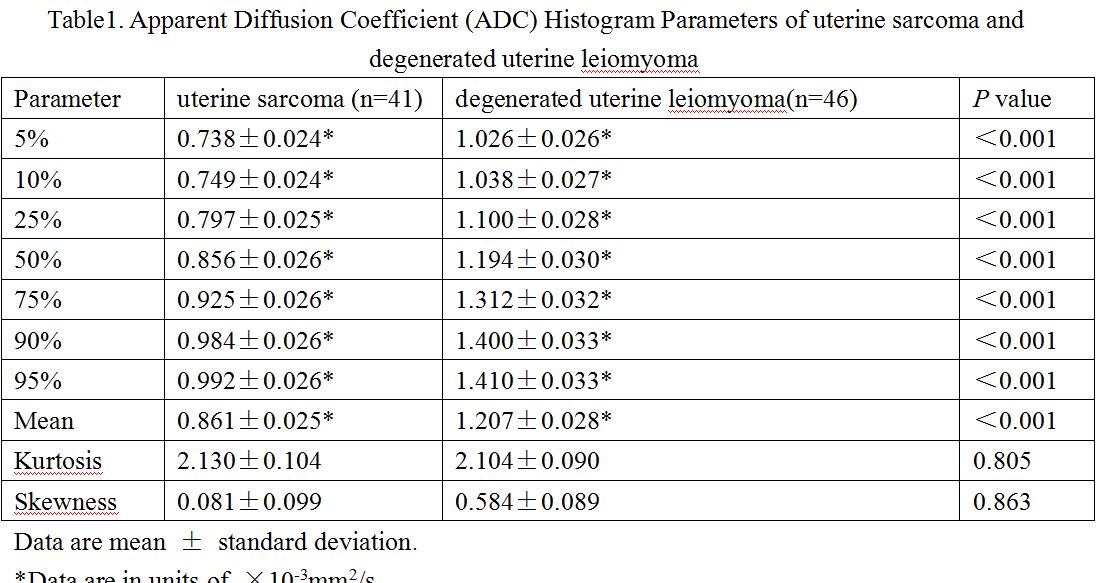
Table1. Apparent Diffusion Coefficient (ADC) Histogram Parameters of uterine sarcoma and degenerated uterine leiomyoma.