4689
To explore the diagnostic value of Multi-parameter MRI in ovarian endometriosisYe Li1, Ailian Liu1, Qingwei Song1, and Lizhi Xie2
1First Affiliated Hospital of Dalian Medical University, Dalian, China, 2GE Healthcare, MR Research China, Beijing, China
Synopsis
Endometriosis is a disease characterized by the invasion of active endometrial glands and stroma into any location other than the endometrium. Clinical symptoms of ovarian endometriosis include abdominal pain, irregular menstruation, abnormal vaginal bleeding, and a tendency to malignant transformation. In this study, T1WI, T2WI, diffusion weighted imaging (DWI) and enhanced T2 star weighted angiography (ESWAN) MR measurements were performed to evaluate the feasibility of them in diagnosing ovarian endometriosis cysts, and optimize the combination of the quantitative parameters of the above MRI sequences.
Purpose
Long-term intracystic bleeding accumulation lead to a lot of blood components in the cystic fluid. The T1WI signal intense of cyst fluid may turn to hyperintense, and the T2WI signal intensity of cyst may reduce. The quantitative R2* value on the ESWAN sequence varies according to the content of paramagnetic materials, such as hemosiderin, methemoglobin, and deoxygenated hemoglobin1. The apparent diffusion coefficient (ADC) values depend on the content of protein2. The purpose of this study is to investigate the diagnostic value of the parameters of T1WI, T2WI, diffusion weighted imaging (DWI) and enhanced T2 star weighted angiography (ESWAN) in ovarian endometriosis.Methods
This retrospective study was approved by Institutional Review Board of participated hospital. Sixty-eight patients with eighty lesions underwent an Pelvic MR scan including T1WI、T2WI、DWI ( TR/TE:4000/70 ms,b=0, 600 s/mm2 ) and ESWAN (axial 3D, matrix: 272×192, first echo: TR/TE: 16.3/2.1ms, 5 echo, flip angle=12°) on a 1.5T clinical MR scanner (Signa HDxt, GE) from April 2012 to February 2014. All lesions confirmed by the pathology were retrospectively reviewed. The patient was divided into ovarian endometriosis (42 case, group A) and other cystic lesions (38 cases, group B). There are two observers measuring the signal value of T1WI, T2WI of cyst fluid and iliopsoas, the ADC value, phase values and R2 * values of cyst fluid, who then calculated the cyst fluid/iliopsoas ratio (T1R and T2R). The non-parametric Mann-Whitney U test was used to compare the above parameter values between the two groups. The values of diagnostic performance were analyzed by using receiver operating characteristic curve (ROC). Logistics regression parameters of diagnostic efficacy were used to select the highest Youden index for the best parameter association after combining the parameters step by step.Results and Discussion
T1R and R2* values for group A (3.39(3.03,3.73)、(15.08(9.72,19.00) )Hz) were statistically higher than those for groups B (0.91(0.74,1.88)、(3.01(1.69,5.27) )Hz),the P value were all less than 0.001. The T2R, ADC value, phase value of group A (5.28(4.57,7.46)、(1.20(0.97,1.45))×10-3 mm2/s、2.19(1.16,3.27))were lower than those of group B(10.85(8.17,14.56)、(2.64(2.07,2.93) )×10-3 mm2/s,2.67(2.29,4.65) ) (the P value were <0.001、<0.001、0.004, separately). The AUC of T1R, T2R, ADC value, phase values and R2 * value were 0.930, 0.874, 0.891, 0.685 and 0.924 respectively. When combining T1R, ADC value, R2 * value, the Youden index (84.97) is highest, with a sensitivity of 92.86% and a specificity of 89.47%.Conclusion
Combine T1R, ADC and R2* value can provide an effective way to discriminate endometrial ovarian cyst from other ovary cystic lesions. Due to bleeding time of different T1WI performance diversification, we need find new way to diagnostic ovarian endometriosis. DWI is currently the only noninvasive method can detect the in vivo diffusion movement, and the apparent diffusion coefficient (ADC) values depend on the content of protein2. In addition to T2, the T2* is also more sensitive to the inhomogeneity of the magnetic field caused by the inhomogeneity of the main magnetic field. Therefore, according to the different imaging characteristics of DWI and ESWAN sequence, we can make the diagnosis of ovarian endometriosis.Acknowledgements
No acknowledgement found.References
1. Ye Li, Qing-Wei Song, Mei-Yu Sun, et al. Use of enhanced T2 star-weighted angiography (ESWAN) and R2*values to distinguish ovarian cyst to endometriosis from other causes. Abdom Imaging, 2015(40):1733-1741. PMID:25504223. 2. Moteki T, Horikoshi H, Endo K. Relationship between apparent diffusion coeffcient and signal intensity in endometrial and other pelvic cysts. Magn Reson Imaging, 2012, 20(6): 463~470.Figures
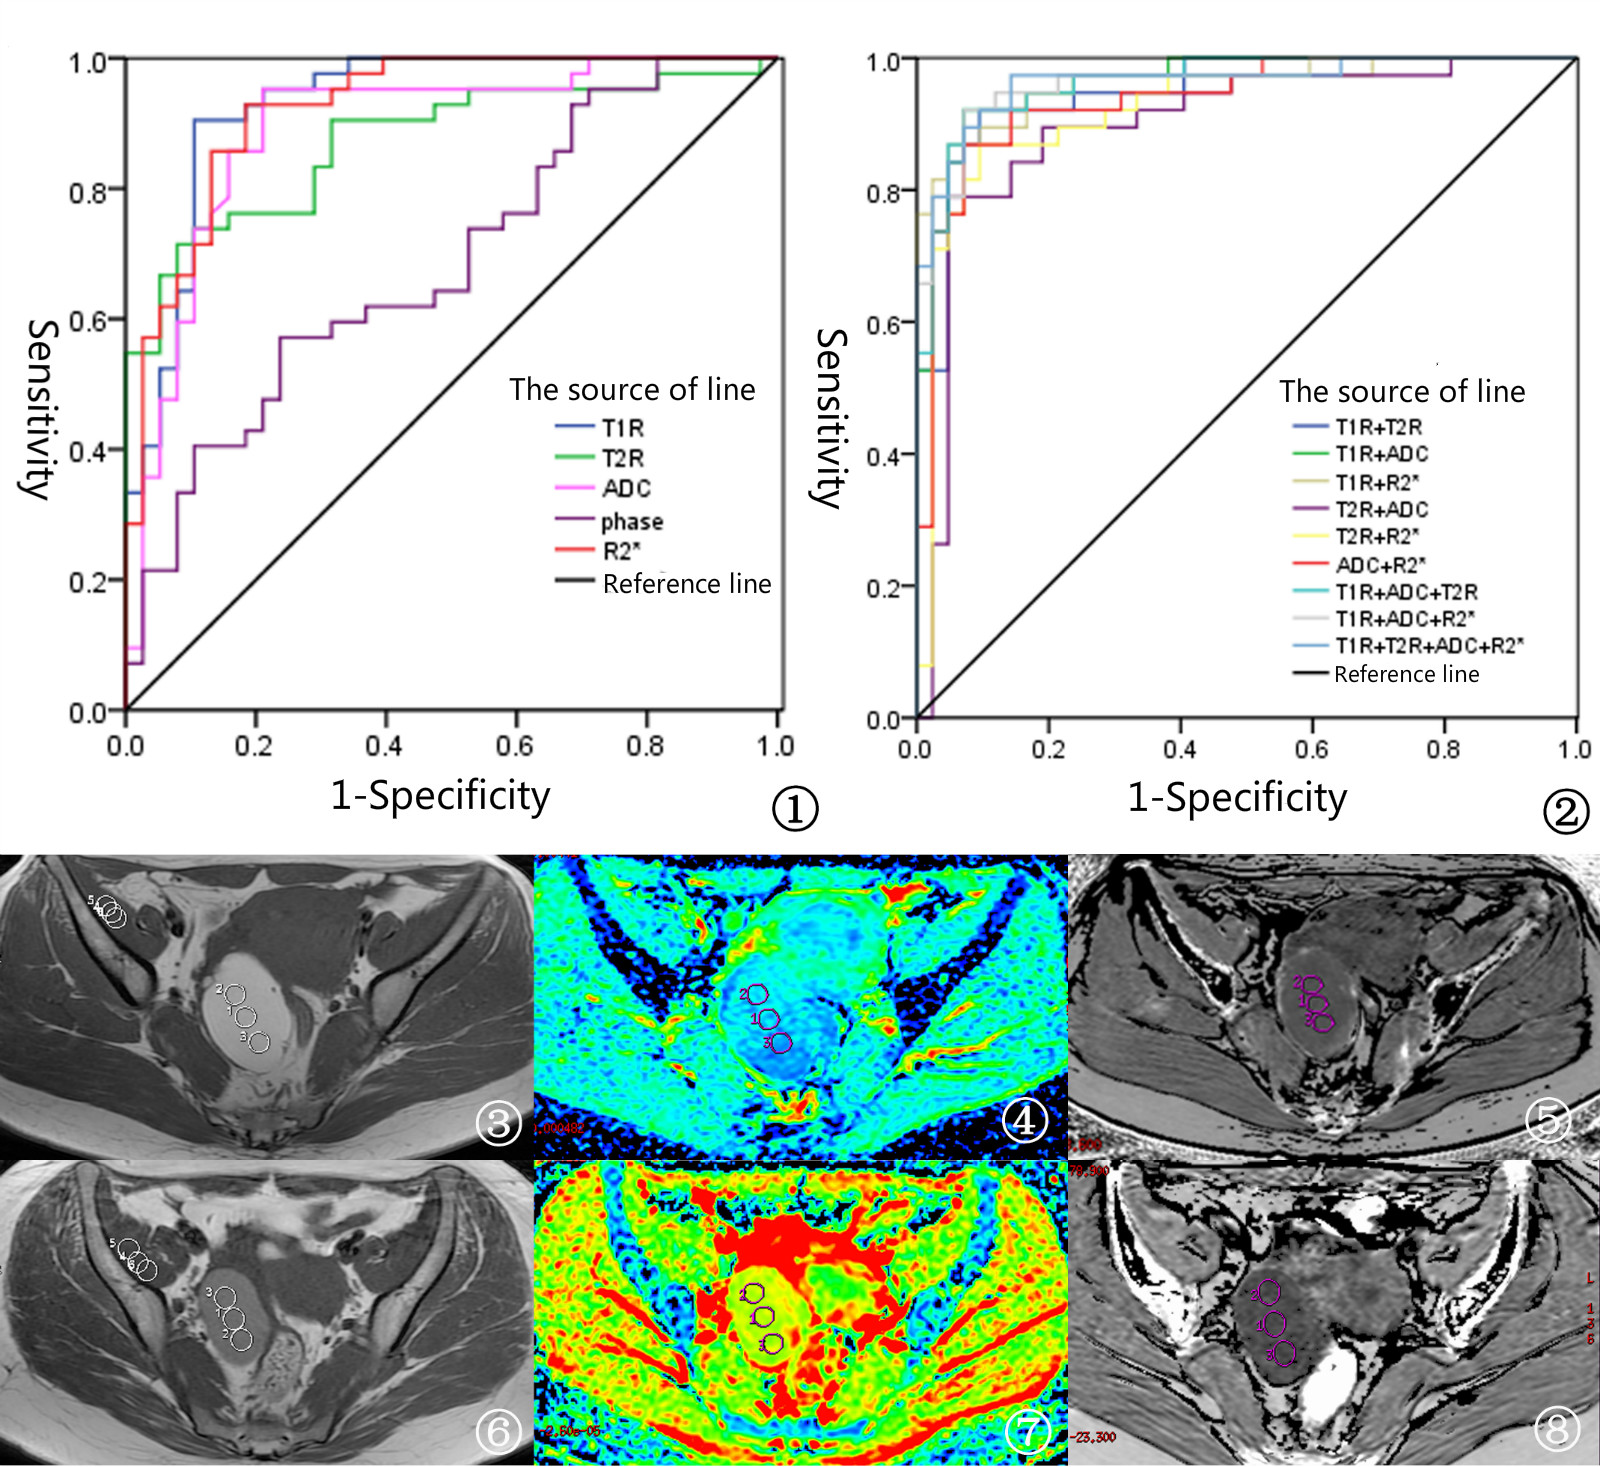
Figure 1 The ROC curve of T1R,
T2R, ADC values and phase values, R2 * value in the diagnosis of ovarian
endometriosis cyst. Figure 2 The ROC curve of T1R, T2R, ADC values, R2 * value
two joint, three joint and four joint after the diagnosis of ovarian
endometriosis cyst. Figure3 ~ 5, 47-year-old patients with dysmenorrhea
progression, CA125 30.43 IU/ml, confirmed by pathology of ovarian endometriosis
cyst on the right side. Its ROI for 1 ~ 3 is located in the liquid capsule, ROI
4 ~ 6 side iliopsoas muscle; Figure 3 as T1WI images, T1R value is 3.03; Figure
4 for ADC, the ADC value is 1.30 x 10⁻³ was/s; Figure 4 R2 * ESWAN sequence, R2
* value is 15.88 Hz. Figure 6 ~ 9, 31-year-old patients, because of pelvic
tumors, CA125 11.61 IU/ml, confirmed by pathology on the right side of ovarian
serous cystic adenoma. Its ROI for 1 ~ 3 is located in the liquid capsule, ROI
4 ~ 6 side iliopsoas muscle lesions; Figure 3 as T1WI images, T1R value is
1.80; Figure 4 for ADC, the ADC value is 1.72 x 10⁻³ was/s; Figure 4 R2 * of
ESWAN sequence, R2* value is 9.86 Hz.