4686
Texture analysis of multiparametric MRI: interobserver variability of texture features and associations with nodal status.1Diagnostic Radiology, The University of Hong Kong, Hong Kong, Hong Kong, 2Philips Healthcare, Hong Kong, Hong Kong
Synopsis
Texture analysis of pre-treatment multiparametric MRI (mpMRI) consisting of diffusion-weighted MRI (DWI) and T2-weighted (T2W) texture features could be a promising and reproducible quantitative approach in assessing tumor heterogeneity in cervical cancer. We retrospectively studied forty treatment-naïve patients who had mpMRI examinations. We observed that around 30% of texture features had low interobserver variability, and that most of these features were from the Gray-Level Co-occurrence Matrix (GLCM) and Gray-Level Run Length Matrix (GLRLM). Furthermore, T2W features had moderate associations with pelvic lymph node (PLN) status.
Purpose
To determine interobserver variability of mpMRI texture features and to examine associations of these mpMRI features with nodal status.Methods
Forty patients with treatment-naïve cervical cancer who underwent whole-pelvis CRT were retrospectively analyzed. MRI examinations were performed on a 3.0T TX Achieva scanner (Philips Healthcare).
DWI was acquired using single-shot spin-echo echo-planar imaging in free breathing (b=0-1,000 s/mm2). Conventional T2W sequences were also acquired. Two radiologists independently delineated volumetric regions of interest (VOIs) to encompass the whole cervical tumor.
Images were normalized by applying a µ±3σ threshold (3σ normalization) and then discretized the image into 64 gray levels1. Four families of mpMRI features (Table 1) were extracted from all slices of the VOIs, totaling 100 features. For direction-dependent feature families, GLCM and GLRLM, directions were averaged for rotational invariance. For feature families that depend on the distance of measurements, GLCM, fine, medium, and coarse variants were extracted.
Nodal status was assessed the absence or presence of lymph node metastasis by size (short axis > 1.0cm) and morphology criteria (round, heterogeneous signal, extracapsular irregularity)2, and was evaluated in the pelvic region (PLN) and considered bilateral extension (BI).
To assess interobserver variability of texture features, and to preform feature reduction, Bland-Altman analysis was used. Acceptable interobserver variability was defined as having a limits of agreement (LoA) of less than 10% which was calculated by:
$$$LoA = \bar{d} \pm 1.96s $$$
Where $$$\bar{d}$$$ is the mean difference between measurements and s is the standard deviation of those differences3.
The Mann-Whitney U test was used to compare mpMRI features with low interobserver variability between different nodal statuses. Significantly different features were used in subsequent multivariable logistic regression analysis to test for associations with PLN and BI. Associations were assessed by receiver operating characteristic (ROC) analysis.
Results
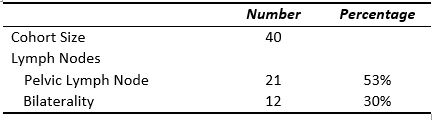
Clinical characteristics of patients are summarized in Table 2. DWI had 26 features with acceptable interobserver variability, while T2W had 31 features with acceptable interobserver variability (Table 1). The majority of features with low interobserver variability come from the GLCM and GLRLM families, with a few stable features from Histogram, and no stable features from Neighborhood Ggray Level Distribution Matrix (NGLDM).
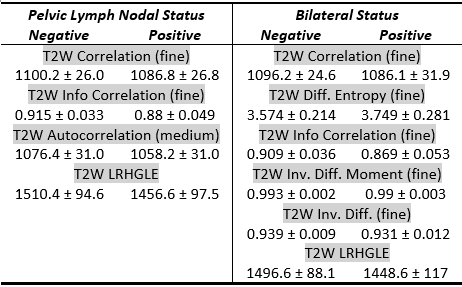
Only T2W textures were significantly different between positive and negative PLN and BI status. In both PLN and BI, only textures from the GLCM and GLRLM families were significantly different. Results of univariate analysis are tabulated in Table 3.
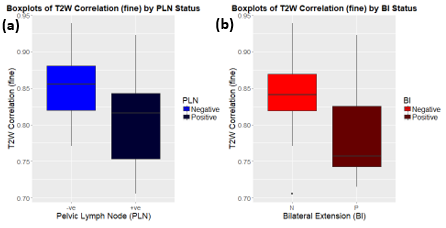
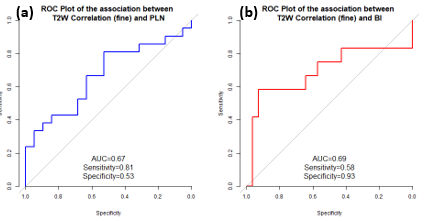
The fine T2W Correlation texture had the strongest association with PLN (AUC = 0.67, sensitivity = 0.81, specificity = 0.53), and with BI (AUC = 0.69, sensitivity = 0.58, specificity = 0.93). Boxplots and ROC curves of these associations can be found in Figure 1 and 2 respectively. Multivariable analysis did not create models with better associations between mpMRI features and nodal status.
Discussion
Texture analysis is a promising tool in quantifying spatial heterogeneity of cervical cancer, and has been shown to be useful in predicting treatment response in cervical cancer using dynamic contrast-enhanced MRI4.
The higher order texture families consider more than one pixel simultaneously5 to compute descriptors of image heterogeneity6. The study by Chicklore et al. visually demonstrated that histogram analysis fails at differentiating four images that would appear different to human observers5. This suggests that histogram analysis may not adequately assess the heterogenous nature of cervical cancer on MRI.
One pitfall of texture analysis is the issue of feature stability7 although it is not well explored in MRI7-9. An MRI phantom study suggested that GLCM features are robust against changes in MRI acquisition parameters, leading to high transferability10. We observed that less than half of the tested features were had acceptable interobserver variability, with the majority of these features coming from the GLCM and GLRLM families.
Only T2W textures had significant associations with both nodal statuses. This suggests that T2W image heterogeneity may be linked to nodal staging. Furthermore, our results suggest that tumors with higher homogeneity metrics have better prognosis in terms of nodal staging.
Though our study found that multivariable analysis does not improve the associations of mpMRI features with PLN and BI, T2W11 and DWI12 are important MRI sequences in the assessment of anatomical delineation and functional variations in cervical cancer. Texture analysis of mpMRI may act as an adjunct tool in providing prognostic information in patients with cervical cancer.
Conclusion
After rigorous stability testing, texture analysis of mpMRI could be a potentially useful technique in assessing tumor heterogeneity in cervical cancer.Acknowledgements
No acknowledgement found.References
1. Collewet, G., Strzelecki, M. & Mariette, F. Influence of MRI acquisition protocols and image intensity normalization methods on texture classification. Magnetic Resonance Imaging 22, 81-91 (2004). 2. Brown, G., Richards, C.J., Bourne, M.W., Newcombe, R.G., Radcliffe, A.G., Dallimore, N.S. & Williams, G.T. Morphologic Predictors of Lymph Node Status in Rectal Cancer with Use of High-Spatial-Resolution MR Imaging with Histopathologic Comparison 1. Radiology 227, 371-377 (2003).
3. Bland, J.M. & Altman, D. Statistical methods for assessing agreement between two methods of clinical measurement. The lancet 327, 307-310 (1986).
4. Torheim, T., Malinen, E., Kvaal, K., Lyng, H., Indahl, U.G., Andersen, E.K. & Futsaether, C.M. Classification of dynamic contrast enhanced MR images of cervical cancers using texture analysis and support vector machines. IEEE Transactions on medical imaging 33, 1648-1656 (2014).
5. Chicklore, S., Goh, V., Siddique, M., Roy, A., Marsden, P.K. & Cook, G.J.R. Quantifying tumour heterogeneity in 18F-FDG PET/CT imaging by texture analysis. European Journal of Nuclear Medicine and Molecular Imaging 40, 133-140 (2013).
6. Lambin, P., Rios-Velazquez, E., Leijenaar, R., Carvalho, S., van Stiphout, R.G., Granton, P., Zegers, C.M., Gillies, R., Boellard, R. & Dekker, A. Radiomics: extracting more information from medical images using advanced feature analysis. European journal of cancer 48, 441-446 (2012).
7. Leijenaar, R.T.H., Carvalho, S., Velazquez, E.R., van Elmpt, W.J.C., Parmar, C., Hoekstra, O.S., Hoekstra, C.J., Boellaard, R., Dekker, A.L.A.J., Gillies, R.J., Aerts, H.J.W.L. & Lambin, P. Stability of FDG-PET Radiomics features: An integrated analysis of test-retest and inter-observer variability. Acta Oncologica 52, 1391-1397 (2013).
8. Aerts, H.J., Velazquez, E.R., Leijenaar, R.T., Parmar, C., Grossmann, P., Cavalho, S., Bussink, J., Monshouwer, R., Haibe-Kains, B. & Rietveld, D. Decoding tumour phenotype by noninvasive imaging using a quantitative radiomics approach. Nature communications 5(2014).
9. van Timmeren, J.E., Leijenaar, R.T., van Elmpt, W., Wang, J., Zhang, Z., Dekker, A. & Lambin, P. Test–Retest Data for Radiomics Feature Stability Analysis: Generalizable or Study-Specific? TOMOGRAPHY 2, 361-365 (2016).
10. Mayerhoefer, M.E., Szomolanyi, P., Jirak, D., Materka, A. & Trattnig, S. Effects of MRI acquisition parameter variations and protocol heterogeneity on the results of texture analysis and pattern discrimination: an application‐oriented study. Medical physics 36, 1236-1243 (2009).
11. Hricak, H., Gatsonis, C., Chi, D.S., Amendola, M.A., Brandt, K., Schwartz, L.H., Koelliker, S., Siegelman, E.S., Brown, J.J. & McGhee Jr, R.B. Role of imaging in pretreatment evaluation of early invasive cervical cancer: results of the intergroup study American College of Radiology Imaging Network 6651–Gynecologic Oncology Group 183. Journal of clinical oncology 23, 9329-9337 (2005). 12. Kuang, F., Ren, J., Zhong, Q., Liyuan, F., Huan, Y. & Chen, Z. The value of apparent diffusion coefficient in the assessment of cervical cancer. European radiology 23, 1050-1058 (2013).
Figures
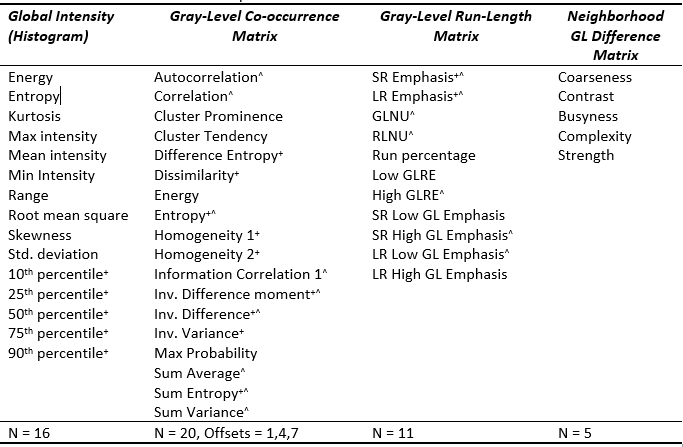
Figure 1 Texture features planned for use in this study. Inv.: Inverse; SR: Short run; LR: Long run; GL: Gray-level; Non-Uniformity; RL: Run-Length; RE: Run-Emphasis
+ - DWI texture features that have acceptable interobserver variability
^ - T2W texture features that have acceptable interobserver variability