4683
Intravoxel incoherent motion diffusion imaging for grading endometrial cancer1Department of diagnostic radiology, National Cancer Center/Cancer Hospital, Chinese Academy of Medical Science and Peking Union Medical College, Beijing, Beijing, China, 2GE Healthcare, China, Beijing, China
Synopsis
Accurate grading of endometrial cancer (EC) is invaluable owing to its relationship with the aggressiveness, prognosis, recurrence as well as its impact on treatment stratification. The differentiation of tumor correlates with the tumor density, the nuclear-to-cytoplasm ratio and microcirculation, which can be quantitatively assessed by using ADC and IVIM parameters (such as D, D* and f). The ADC, D and f values showed good or fair inverse correlation with histological grade. Therefore, IVIM DWI is a valuable supplement to predict histological grade of EC preoperatively which could contribute to treatment planning and prognosis evaluation.
Purpose
To investigate intravoxel incoherent motion (IVIM) imaging in assessing pathological grade of endometrial cancer preoperatively.Methods
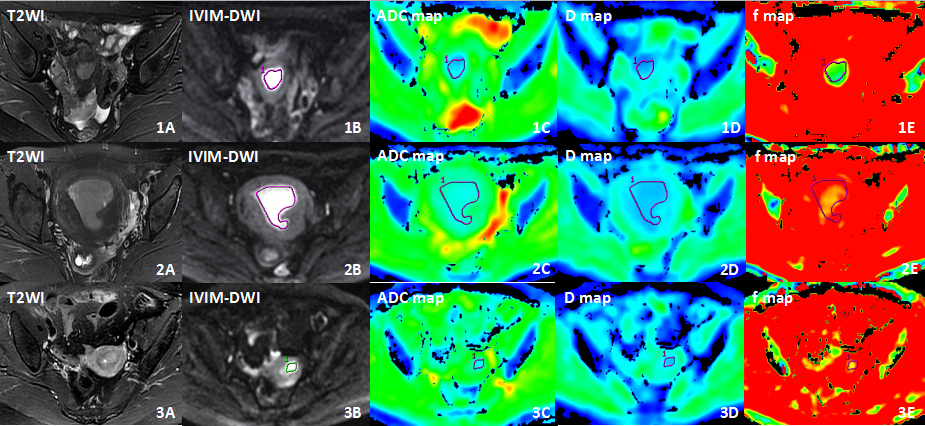
Forty-three consecutive patients with EC confirmed by pathology underwent IVIM DWI with 12 b values (0, 10, 25, 50, 75, 100, 150, 200, 400, 800, 1000, 1500, 2000 s/mm2;NEX=2, 2, 2, 2, 2, 1, 1, 1, 1, 1, 4, 6, 6, respectively) at 3.0T MR scanner (GE Discovery 750, USA) preoperatively. Apparent diffusion coefficient(ADC)was calculated using monoexponential analysis(b=0,800sec/mm2). ADC values and IVIM parameters (true diffusivity, D; perfusion-related diffusivity, D*; and perfusion fraction, f) were measured by two radiologists independently using the postprocessing software in GE AW workstation independently. A single representative region of interest (ROI) was manually drawn along the margin of the tumor on the IVIM DWI images of b1000, on the section containing the largest tumor cross-section area avoiding areas of necrosis and hemorrhage with reference to conventional MRI images T2WI and DCE MRI. All ROIs were directly co-localized on all parameter maps, then the software automatically generated the values of IVIM parameters and ADC(Figure1). Inter-observer reliability of these parameters was evaluated by using the intraclass correlation coefficient (ICC). Spearman correlation was performed to analyze the association of these parameters with the histological grades. The comparison of ADC values and the IVIM DWI parameters between three groups identified by three histological tumor grades[Grade1(G1), n=13; Grade2(G2), n=16; Grade3(G3), n=14] were performed by using the one-way analysis of variances (ANOVA) or Kruskall-Wallis test. And post hoc multiple comparison was performed by using the Bonferroni(P<0.017 was considered to indicate a statistically significant difference). ROC curve was employed to determine the diagnostic efficiency and the optimal cut-off values. P<0.05 was considered to indicate a statistically significant difference.Results
The inter-observer agreement was generally excellent for the IVIM-derived parameters and ADC. The interobserver agreement was highest for ADC (ICC,0.974;95% confidence interval [CI]:0.953-0.986) and lowest for f (ICC,0.921; 95%CI:0.859-0.956). The ADC, D and f values were negatively associated with tumor grades of EC (r=-0.604, -0.448 and -0.428; P=0.000, 0.002 and 0.004). But there was no significant correlation between the D* value and tumor histological grade(r=0.220, P=0.157). Significant difference of ADC values was found between G1 and G3 (P=0.000), between G2 and G3 of EC (P=0.009). The D and f values of EC were significantly lower in G3 than those in G1 (P=0.01)(Table 1). There was no significant difference of D* between those three groups (P=0.071). The largest area under the curve (AUC) was observed by using ADC to distinguish G3 from G1-2 (AUC=0.825); and with the cut-off of less than 0.796×10⁻³mm2/s, the sensitivity, specificity and accuracy were 71.4%, 89.7% and 83.7%, respectively.Discussion and conclusion
The higher the tumor grade, the cell membranes are prone to increase caused by cell proliferation. This study suggested that the diffusion parameters ADC and D values of high-grade EC were lower compared to the low-grade EC which was in accordance with the knowledge that cell membranes act as obstacles for water diffusion and the increased fraction of intracellular space[1, 2]. Moreover, the perfusion parameter f also exhibited the capacity of distinguishing the high-grade tumors (G3) from the low-grade tumors (G1 and G2). In conclusion, IVIM-derived parameters are promising in the prediction of the histological grade of EC preoperatively, which could be helpful in treatment planning and prognosis evaluation.Acknowledgements
No acknowledgement found.References
[1] Shen N, Zhao L, Jiang J, et al. Intravoxel incoherent motion diffusion-weighted imaging analysis of diffusion and microperfusion in grading gliomas and comparison with arterial spin labeling for evaluation of tumor perfusion. J Magn Reson Imaging. 2016, 44(3): 620-632.
[2] Woo S, Cho J Y, Kim S Y, et al. Histogram analysis of apparent diffusion coefficient map of diffusion-weighted MRI in endometrial cancer: a preliminary correlation study with histological grade. Acta Radiol. 2014, 55(10): 1270-1277.
Figures