4678
The Diagnostic Accuracy of MR Imaging for Acute Pyelonephritis1Medical Imaging, University of Arizona, Tucson, AZ, United States, 2Radiology, Memorial Sloan Kettering Cancer Center, New York, NY, United States
Synopsis
MRI may offer a valuable alternative imaging method to diagnosing acute pyelonephritis without exposing patients to ionizing radiation or iodinated CT contrast. Our retrospective study evaluates the accuracy of 4 characteristic MRI findings in diagnosing acute pyelonephritis: (1) T2 hyperintense perinephric edema, (2) loss of corticomedullary differentiation on T2 images, (3) striated nephrogram on contrast-enhanced images, and (4) parenchymal restricted diffusion. Analysis of 108 MRI exams demonstrated that each of the 4 MRI findings was a significant predictor of pyelonephritis. Furthermore, assessing all 4 findings together provided a greater improvement in diagnostic accuracy when compared to any individual finding alone.
Introduction
Pyelonephritis is a potentially organ and life-threatening illness that affects greater than 250,000 people per year in the United States 1,2. When complicated pyelonephritis is suspected, CT imaging is often the imaging modality of choice to establish the diagnosis 3. However, noncontrast CT is relatively insensitive for the detection of acute pyelonephritis, and iodinated CT contrast agents may have nephrotoxic effects on an already injured kidney 4. MRI offers an alternative imaging method to diagnose acute pyelonephritis, without exposure to ionizing radiation or iodinated contrast 5. The aim of this study is to evaluate the accuracy of four separate MR findings in the diagnosis of acute pyelonephritis, and to distinguish from a control group of patients without acute pyelonephritis.Materials and Methods
Our retrospective, IRB-approved study included patients who underwent contrast-enhanced abdominopelvic MRI from the emergency department due to abdominal pain from August 2012 to February 2015. Additional inclusion criteria included only patients with a diagnostic urine culture obtained in the ED at the time of presentation. Two cohorts were established: Cohort #1 consisted of patients who (a) had findings consistent with acute pyelonephritis on their MRI exam and (b) met the clinical diagnostic criteria for acute pyelonephritis as established by the Infectious Disease Society of America (urine culture showing > 10,000 CFU per mm3 and symptoms compatible with the diagnosis) 6. Cohort #2 consisted of a control group of patients who (a) had no significant or explanatory abnormality on their interpreted MRI, and (b) had a urinalysis/urine culture which was negative for active infection. Patients were also excluded if they had a history of background renal disease or prior infection.
Exams were performed on a 1.5T system (Magnetom Aera). Abdominal imaging included dynamic, pre and post-contrast 3D gradient echo imaging, single shot T2-weighted (ssT2) imaging with and without fat saturation (using a spectral adiabatic inversion pulse) and also a breathing averaged, echo-planar diffusion weighted sequence (b values 50, 800).
Both cohorts were mixed together in a single dataset that contained all patients in our study, randomized and anonymized. All MRIs were independently reviewed by two attending radiologists who were blinded to the clinical information for each patient. Each radiologist evaluated for the presence and severity of four MRI findings: (1) Hyperintense signal surrounding the kidneys on ssT2 images, (2) loss of corticomedullary differentiation on ssT2 images, (3) striated nephrogram with areas of decreased cortical enhancement on dynamic contrast-enhanced imaging, and (4) areas of restricted diffusion in the renal parenchyma. Each finding was assigned a score of 0-3 based on degree of conspicuity (0 = not present, 1 = mildly abnormal, 2 = moderately abnormal, 3 = severely abnormal).
Analyses were performed for individual readers, as well as after pooling the reader ratings. The area under the ROC curve (AUC) and the Wald’s 95% confidence limits were obtained. In multivariable model, interactions among variables were assessed and if significant were included in the model. All statistical models included Firth’s bias correction and Hosmer-Lemeshow goodness-of-fit assessment. Effects associated with p<0.05 were considered statistically significant.
Results
A total of 108 patients met the inclusion criteria for our study, 54 in cohort #1 and 54 in cohort #2. Each of the four MRI findings was found to be a significant predictor of pyelonephritis (p<0.0036). Of the four findings, the presence of parenchymal restricted diffusion appeared to be the most accurate indicator for acute pyelonephritis, however this did not meet statistical significance. Furthermore, assessing all 4 imaging findings together provided an even greater improvement in diagnostic accuracy when compared to any individual finding alone.
Table 1 summarizes the results from univariate and multivariable logistic regression models after pooling radiologists’ ratings in terms of the AUC and the 95% confidence limits (CL). Table 2 summarizes the AUCs and 95% CL for each individual reader and for the pooled ratings.
Discussion
Our study demonstrated that MRI is an accurate test for the detection of acute pyelonephritis, with excellent distinction from a cohort of normal patients without pyelonephritis. Utilizing a combination of dynamic, contrast-enhanced images, ssT2 images and DWI provided the best methodology for diagnosis of acute pyelonephritis.Conclusion
MRI may be a valuable tool for the diagnosis of acute pyelonephritis, with the potential to provide highly accurate diagnosis without the use of ionizing radiation or iodinated contrast agents.Acknowledgements
No acknowledgement found.References
1. Tenner SM, Yadven MW, Kimmel PL. Acute pyelonephritis. Postgrad Med. 1992;91(2):261-268. doi:10.1080/00325481.1992.11701211.
2. Czaja CA, Scholes D, Hooton TM, Stamm WE. Population-Based Epidemiologic Analysis of Acute Pyelonephritis. Clin Infect Dis. 2007;45(3):273-280. http://dx.doi.org/10.1086/519268.
3. (NGC) NGC. ACR Appropriateness Criteria® acute pyelonephritis. January 2012. https://www.guideline.gov/summaries/summary/37923.
4. Craig WD, Wagner BJ, Travis MD. Pyelonephritis: Radiologic-Pathologic Review. RadioGraphics. 2008;28(1):255-276. doi:10.1148/rg.281075171.
5. Lonergan GJ, Pennington DJ, Morrison JC, Haws RM, Grimley MS, Kao TC. Childhood pyelonephritis: comparison of gadolinium-enhanced MR imaging and renal cortical scintigraphy for diagnosis. Radiology. 1998;207(2):377-384. doi:10.1148/radiology.207.2.9577484.
6. Rubin RH, Shapiro ED, Andriole VT, Davis RJ, Stamm WE. Evaluation of new anti-infective drugs for the treatment of urinary tract infection. Infectious Diseases Society of America and the Food and Drug Administration. Clin Infect Dis An Off Publ Infect Dis Soc Am. 1992;15 Suppl 1:S216-227. http://www.ncbi.nlm.nih.gov/pubmed/1477233.
Figures
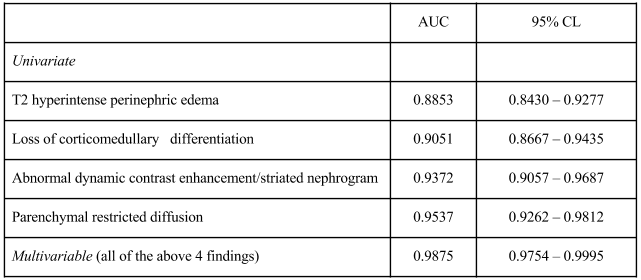

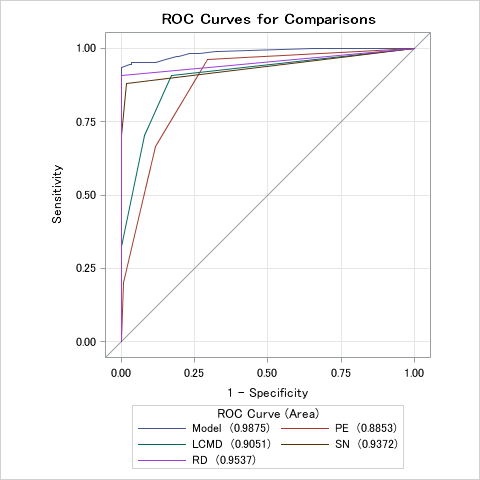
Figure 1:
Each of the 4 MRI findings (PE- Perinephric edema, T2; LCMD – Loss of corticomedullary differentiation, T2; SN – Striated nephrogram, dynamic contrast –enhancement; RD – Restricted diffusion) were significant and provided substantial accuracy in diagnosing pyelonephritis. However, combining all 4 measurements (Model) provided greater diagnostic accuracy than any individual MR finding.
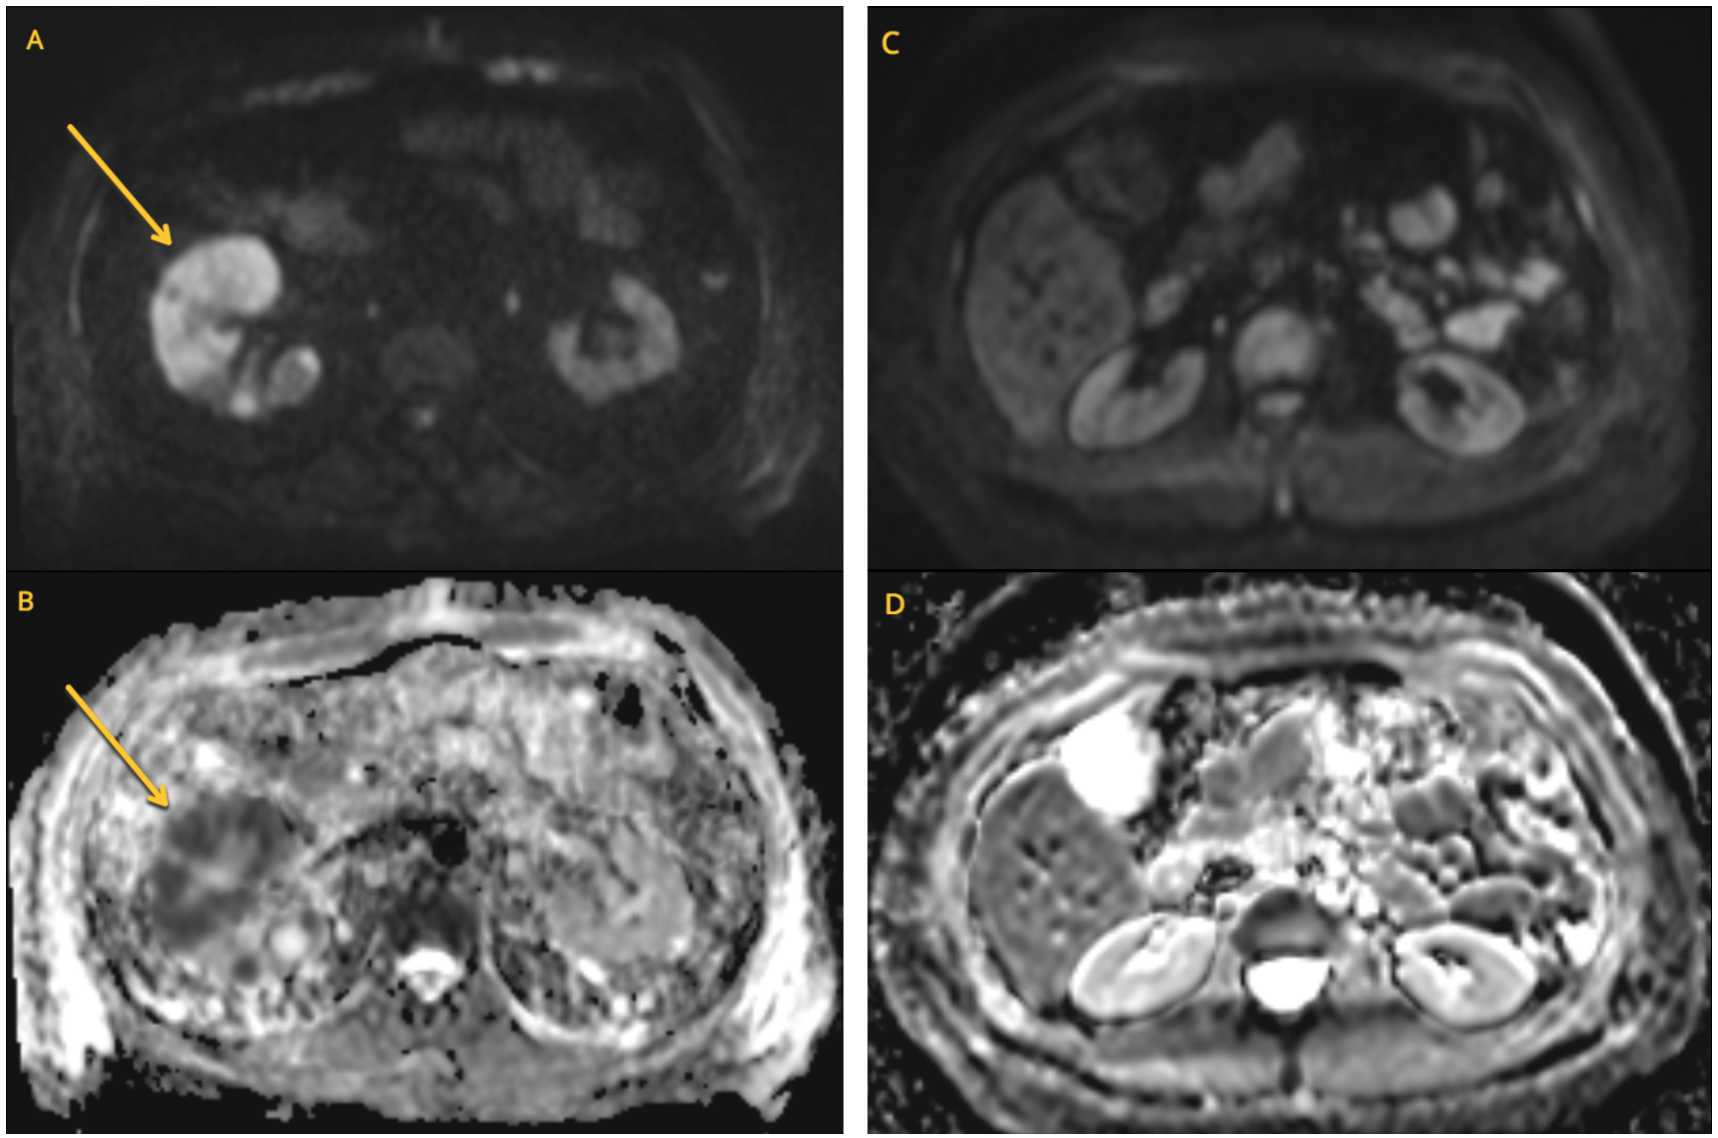
Figure 2:
Patient 1 (Figures A and B): Diffusion-weighted imaging (A) and the corresponding Apparent diffusion coefficient map (B) show an area of parenchymal restricted diffusion involving the anterior right kidney in a patient with clinically diagnosed right pyelonephritis.
Patient 2 (Figures C and D): Diffusion-weighted imaging (C) and the corresponding apparent diffusion coefficient map (D) of the bilateral kidneys is normal.