4677
Utility of 3D histogram analysis of pharmacokinetics parameters using DCE-MRI for differentiating renal clear cell carcinomas from renal harmatomas1Department of Radiology, he Affiliated Hospital of Inner Mongolia Medical University, Hohhot, China, 2GE Healthcare, China, Beijing, China
Synopsis
The aim of this study was to assess if the histogram analysis of DCE-MRIphamocokinetics parameters (Ktrans)can differentiate renal tumors: renal clear cell carcinomas (RCCs) and renal harmatoma with minimal fat. Based on an 3D entire-tumour measurement, the following histogram parameters of Ktrans were derived from histogram analysis, skewness, Energy, Entropy, Uniformity, quartile5, quartile50, Frequency size and kurtosis respectively. We concluded that frequency size was the most significant parameter for predicting renal clear cell carcinoma by analyzing these data,the other parameters had no diagnostic performance.
Purpose
The aim of this study was to assess if the histogram analysis [1-2] of Dynamic Contrast Enhanced magnetic resonance imaging (DCE-MRI) phamocokinetics parameters can differentiate renal tumors: renal clear cell carcinomas (RCCs) and renal harmatoma with minimal fat. Furthermore, to discuss the specific performance of the parameters and which parameters of histogram analysis have diagnostic value.Methods
Forty-nine patients with renal tumors were included in this study (including 39 renal clear cell carcinomas and 10 renal harmatomas with minimal fat). All the patients underwent abdomen MR examination (GE Healthcare, MR750, Milwaukee, USA) including DCE-MRI sequence prior to the treatment. Pharmokokinetics parameter of Ktrans was obtained after post-processing step using Omni kinetics software (GE Healthcare, China). Histogram analysis was performed by outlining 3D entire-tumor regions of interest (ROIs). Based on an entire-tumor measurement, the following histogram parameters of Ktrans were derived from histogram analysis: skewness, kurtosis, quartile energy, entropy, uniformity, quartile5, quartile50, and frequency size etc. The SPSS20.0 statistical software was used for data analysis in this study, P value less than 0.05 was considered statistically significant. The RHs and RCCs were compared using independent sample t test. Areas under ROC curve between two groups were assessed.Results
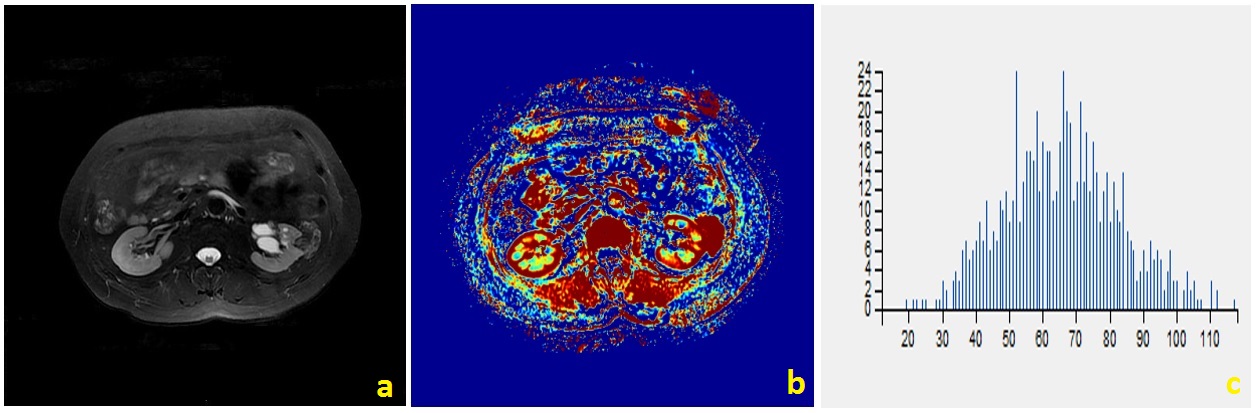
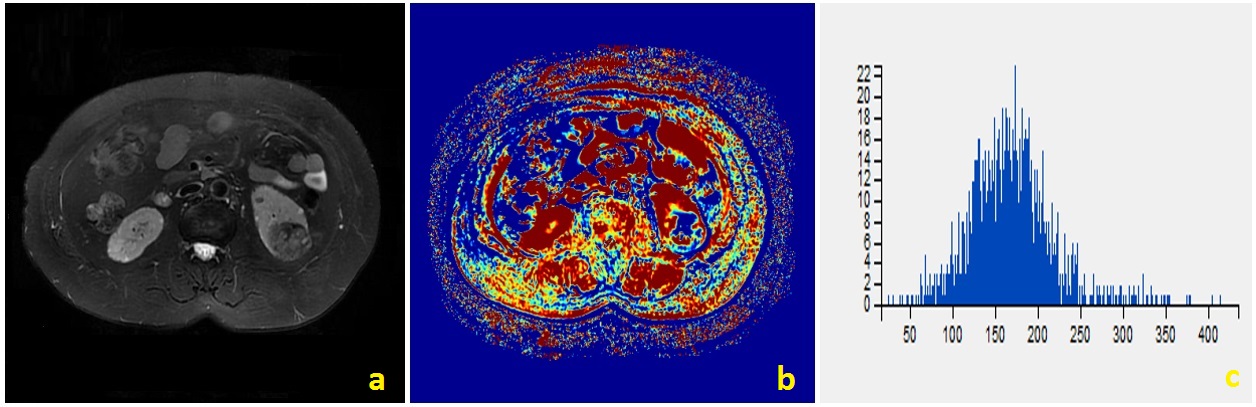
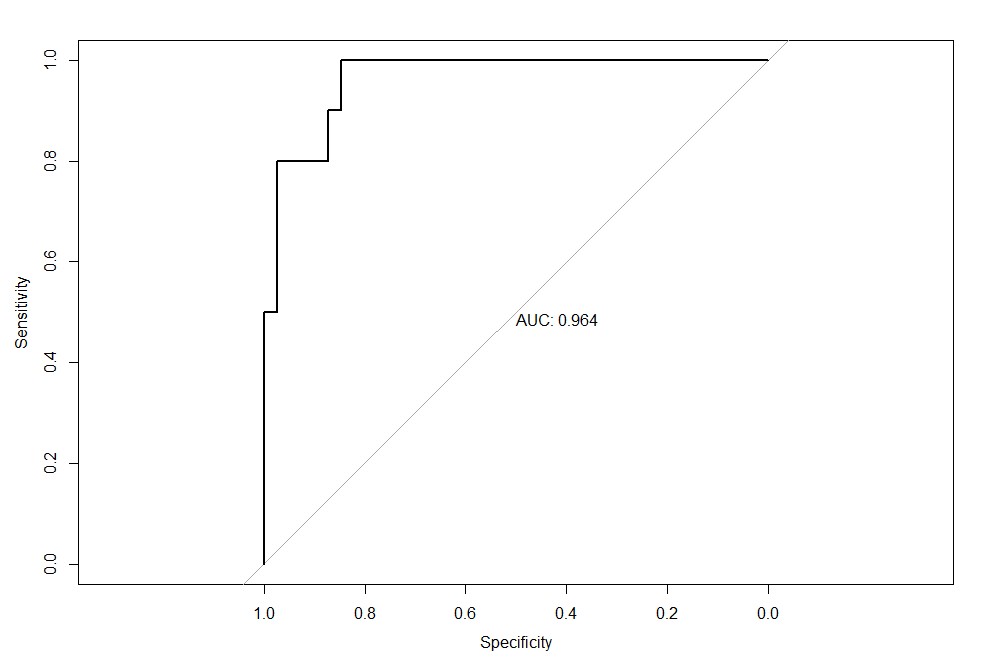
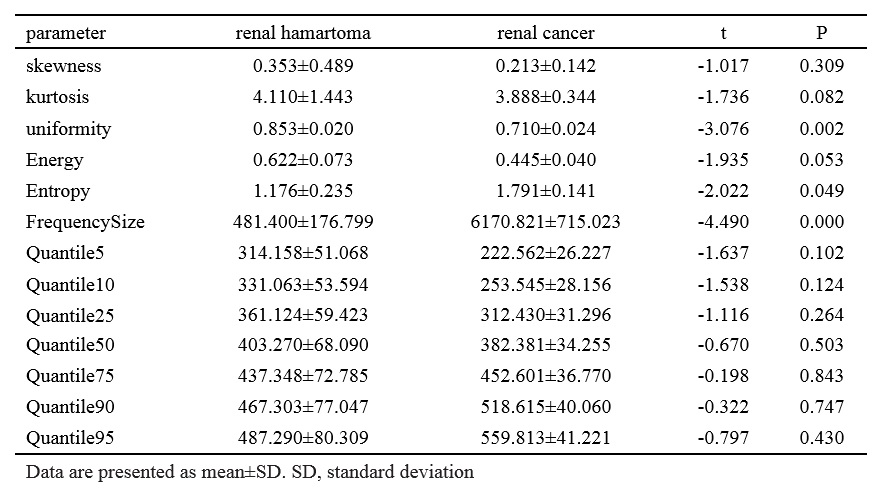
There were significant differences between RCCs and RHsinin Uniformity, Frequency Size of Ktrans(p<0.05) (Table.1). Representative cases of renal harmatomas and renal clear cell carcinomas are presented in Figure.1 and Figure.2, respectively. ROC analysis results indicated that when Frequency size=1732 was set as the threshold value, the best diagnostic performance in predicting malignant tumors was achieved(AUC, 0.964; sensitivity, 84.6%; specifcity,100%), followed by skewness, energy, entropy, uniformity, quartile5, quartile50, and kurtosis(Table.2). ROC curve of using frequency size to differentiate benign and malignant renal tumors is shown in Figure.3.Conclusion
Histogram analysis of DCE-MRI holds promise for differentiating benign and malignant renal tumors. Frequency size was the most significant parameter for predicting renal clear cell carcinoma.Discussion
Histogram analysis of DCE-MRI could effectively demonstrate the heterogeneity of renal tumors, and help differentiate benign and malignant tumors. DCE-MRI is currently used in routine clinical practice for differentiating renal tumors. However, the routine used DCE parameters ignores the heterogeneity of the tumors, which is an important characteristic of both benign and malignant tumors. In our study, we found that renal clear cell carcinoma has a significantly higher frequency size than renal harmatoma. The other parameters had no significantly differences. So far histogram analysis of DCE maps has been successfully used in various organs, the skewness、entropy、kurtosis values were positive in benign and malignant groups, and no significant difference was found between the two groups. Our study had the same result.Acknowledgements
No acknowledgement found.References
[1]. Suo ST, Chen XX, Fan Y, et al. Histogram analysis of apparent diffusion coefficient at 3.0 T inurinary bladder lesions: correlation with pathologic findings. Acad Radiol 2014; 21:1027–1034.
[2]. Ma X, Zhao X, Ouyang H, et al. Quantified ADC histogram analysis: a new method for differentiating mass-forming focal pancreatitis from pancreatic cancer. Acta Radiol 2014; 55:785–792.
Figures