4675
Acute changes in blood glucose levels affect the resting state functional connectivity in mice1NeuroSpin/CEA, Gif-sur-Yvette, France
Synopsis
Dopaminergic network can be modified by the blood glucose levels. The medetomidine, which is commonly used anesthesia in functional MRI, increases the blood glucose levels. In the present study, we compared the functional connectivity in fasted or non-fasted mice under isoflurane or medetomidine anesthesia. The blood glucose levels in non-fasted mice under medetomidine anesthesia significantly increased but isoflurane did not. The correlation coefficients in the dopamine network were significantly higher in fasted mice compared with non-fasted mice under medetomidine, but not under isoflurane. These results indicate that medetomidine-induced blood glucose increase altered the functional connectivity in the dopaminergic network.
Purpose
Acute changes of the blood glucose levels (BGL) alter the dopaminergic network 1,2. Previous study shows that the resting state functional connectivity (rs-FC) in the hypothalamus is facilitated by the decreased BGL in hungry subjects 3. However, so far, no study investigated the relationship between the BGL and the rs-FC using animal models. In the present study, we focused on medetomidine, which is a commonly used anesthetic in functional MRI and known to induce acute hyperglycemia 4. We compared the rs-FC with altered BGL in fasted and non-fasted mice under two anesthesia conditions: isoflurane and medetomidine.Methods
Animals
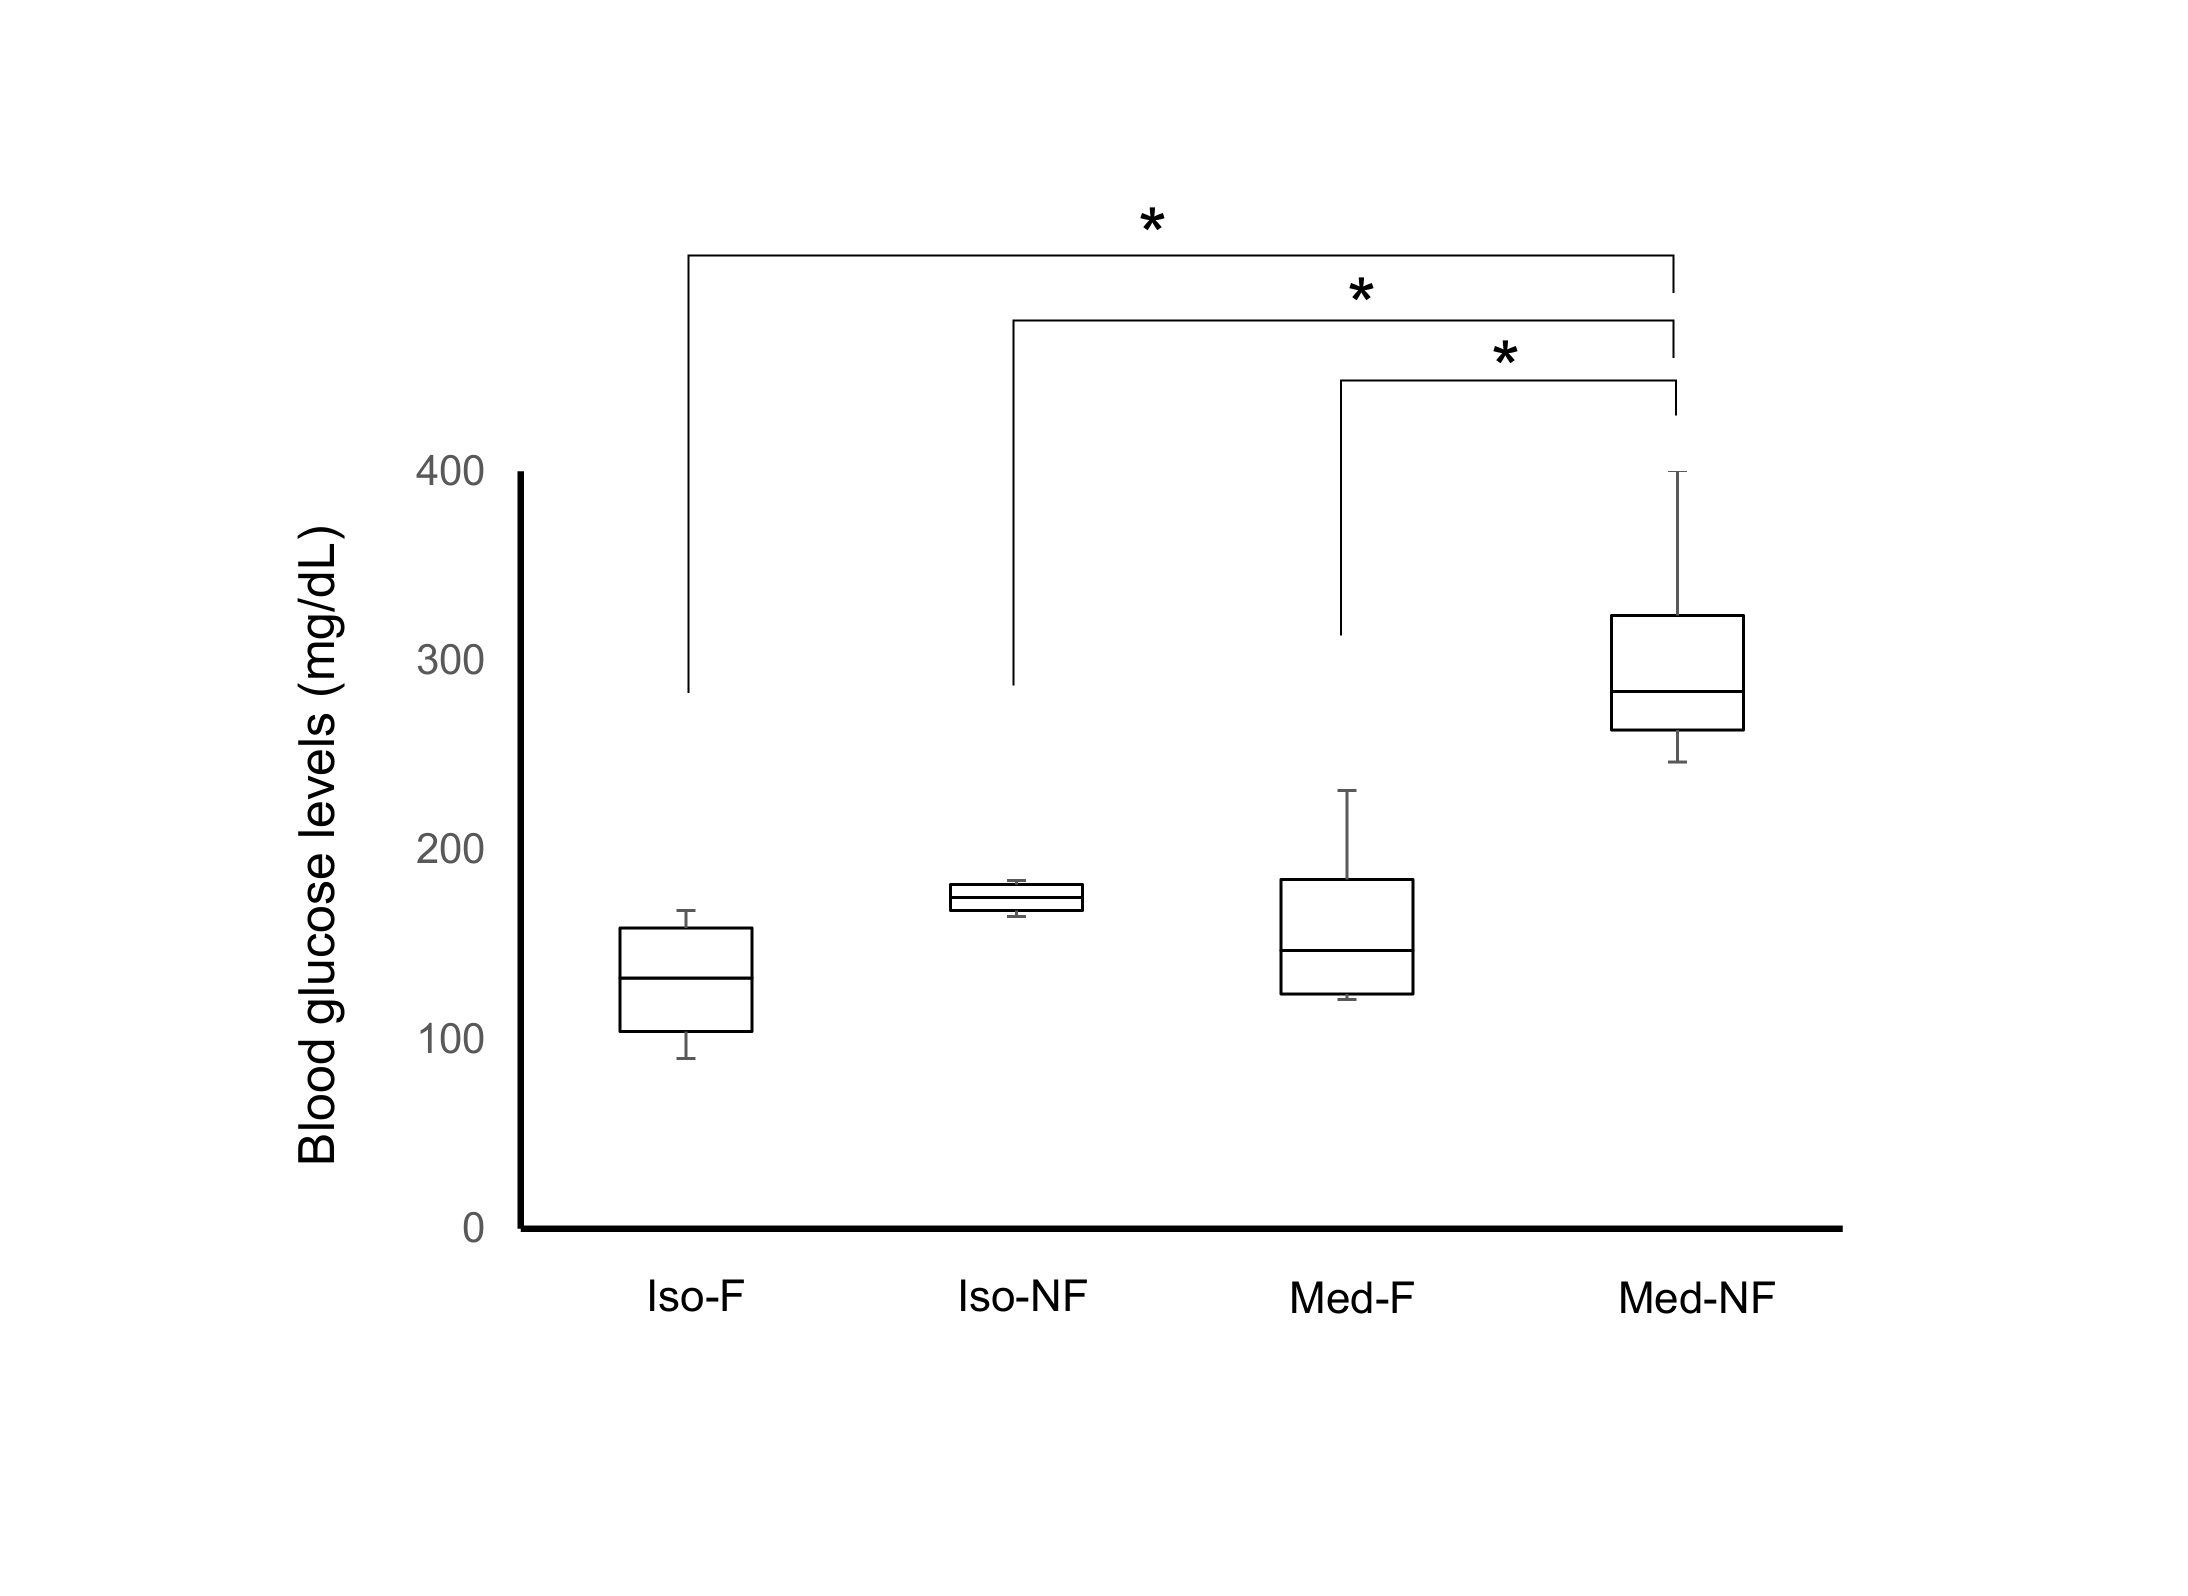
Male swiss mice (n = 38 for fMRI; n = 16 for BGL measurements) were allocated to four groups: fasted under medetomidine anesthesia (0.1 mg/kg/h, s.c.) (Med-F), non-fasted under medetomidine anesthesia (Med-NF), fasted under isoflurane anesthesia (1.0% in air) (Iso-F) and non-fasted under isoflurane anesthesia (Iso-NF). For fasting, mice did not have access the food for 12h before the experiment.
Rs-fMRI
All MRI experiments were conducted on a Bruker 11.7T scanner using a cryo-cooled mouse brain coil. fMRI images were acquired using a gradient-echo EPI sequence, TR/TE = 2,000/14 ms, spatial resolution = 100 x 100 x 500 µm3, 15 slices, for 6 min. The respiration rate and the temperature were maintained at 80 /min and 37 °C, respectively. Anatomical images were acquired for spatial correction using multi-slice rapid acquisition with relaxation enhancement (RARE) with identical FOV and resolution as for fMRI.
Image processing
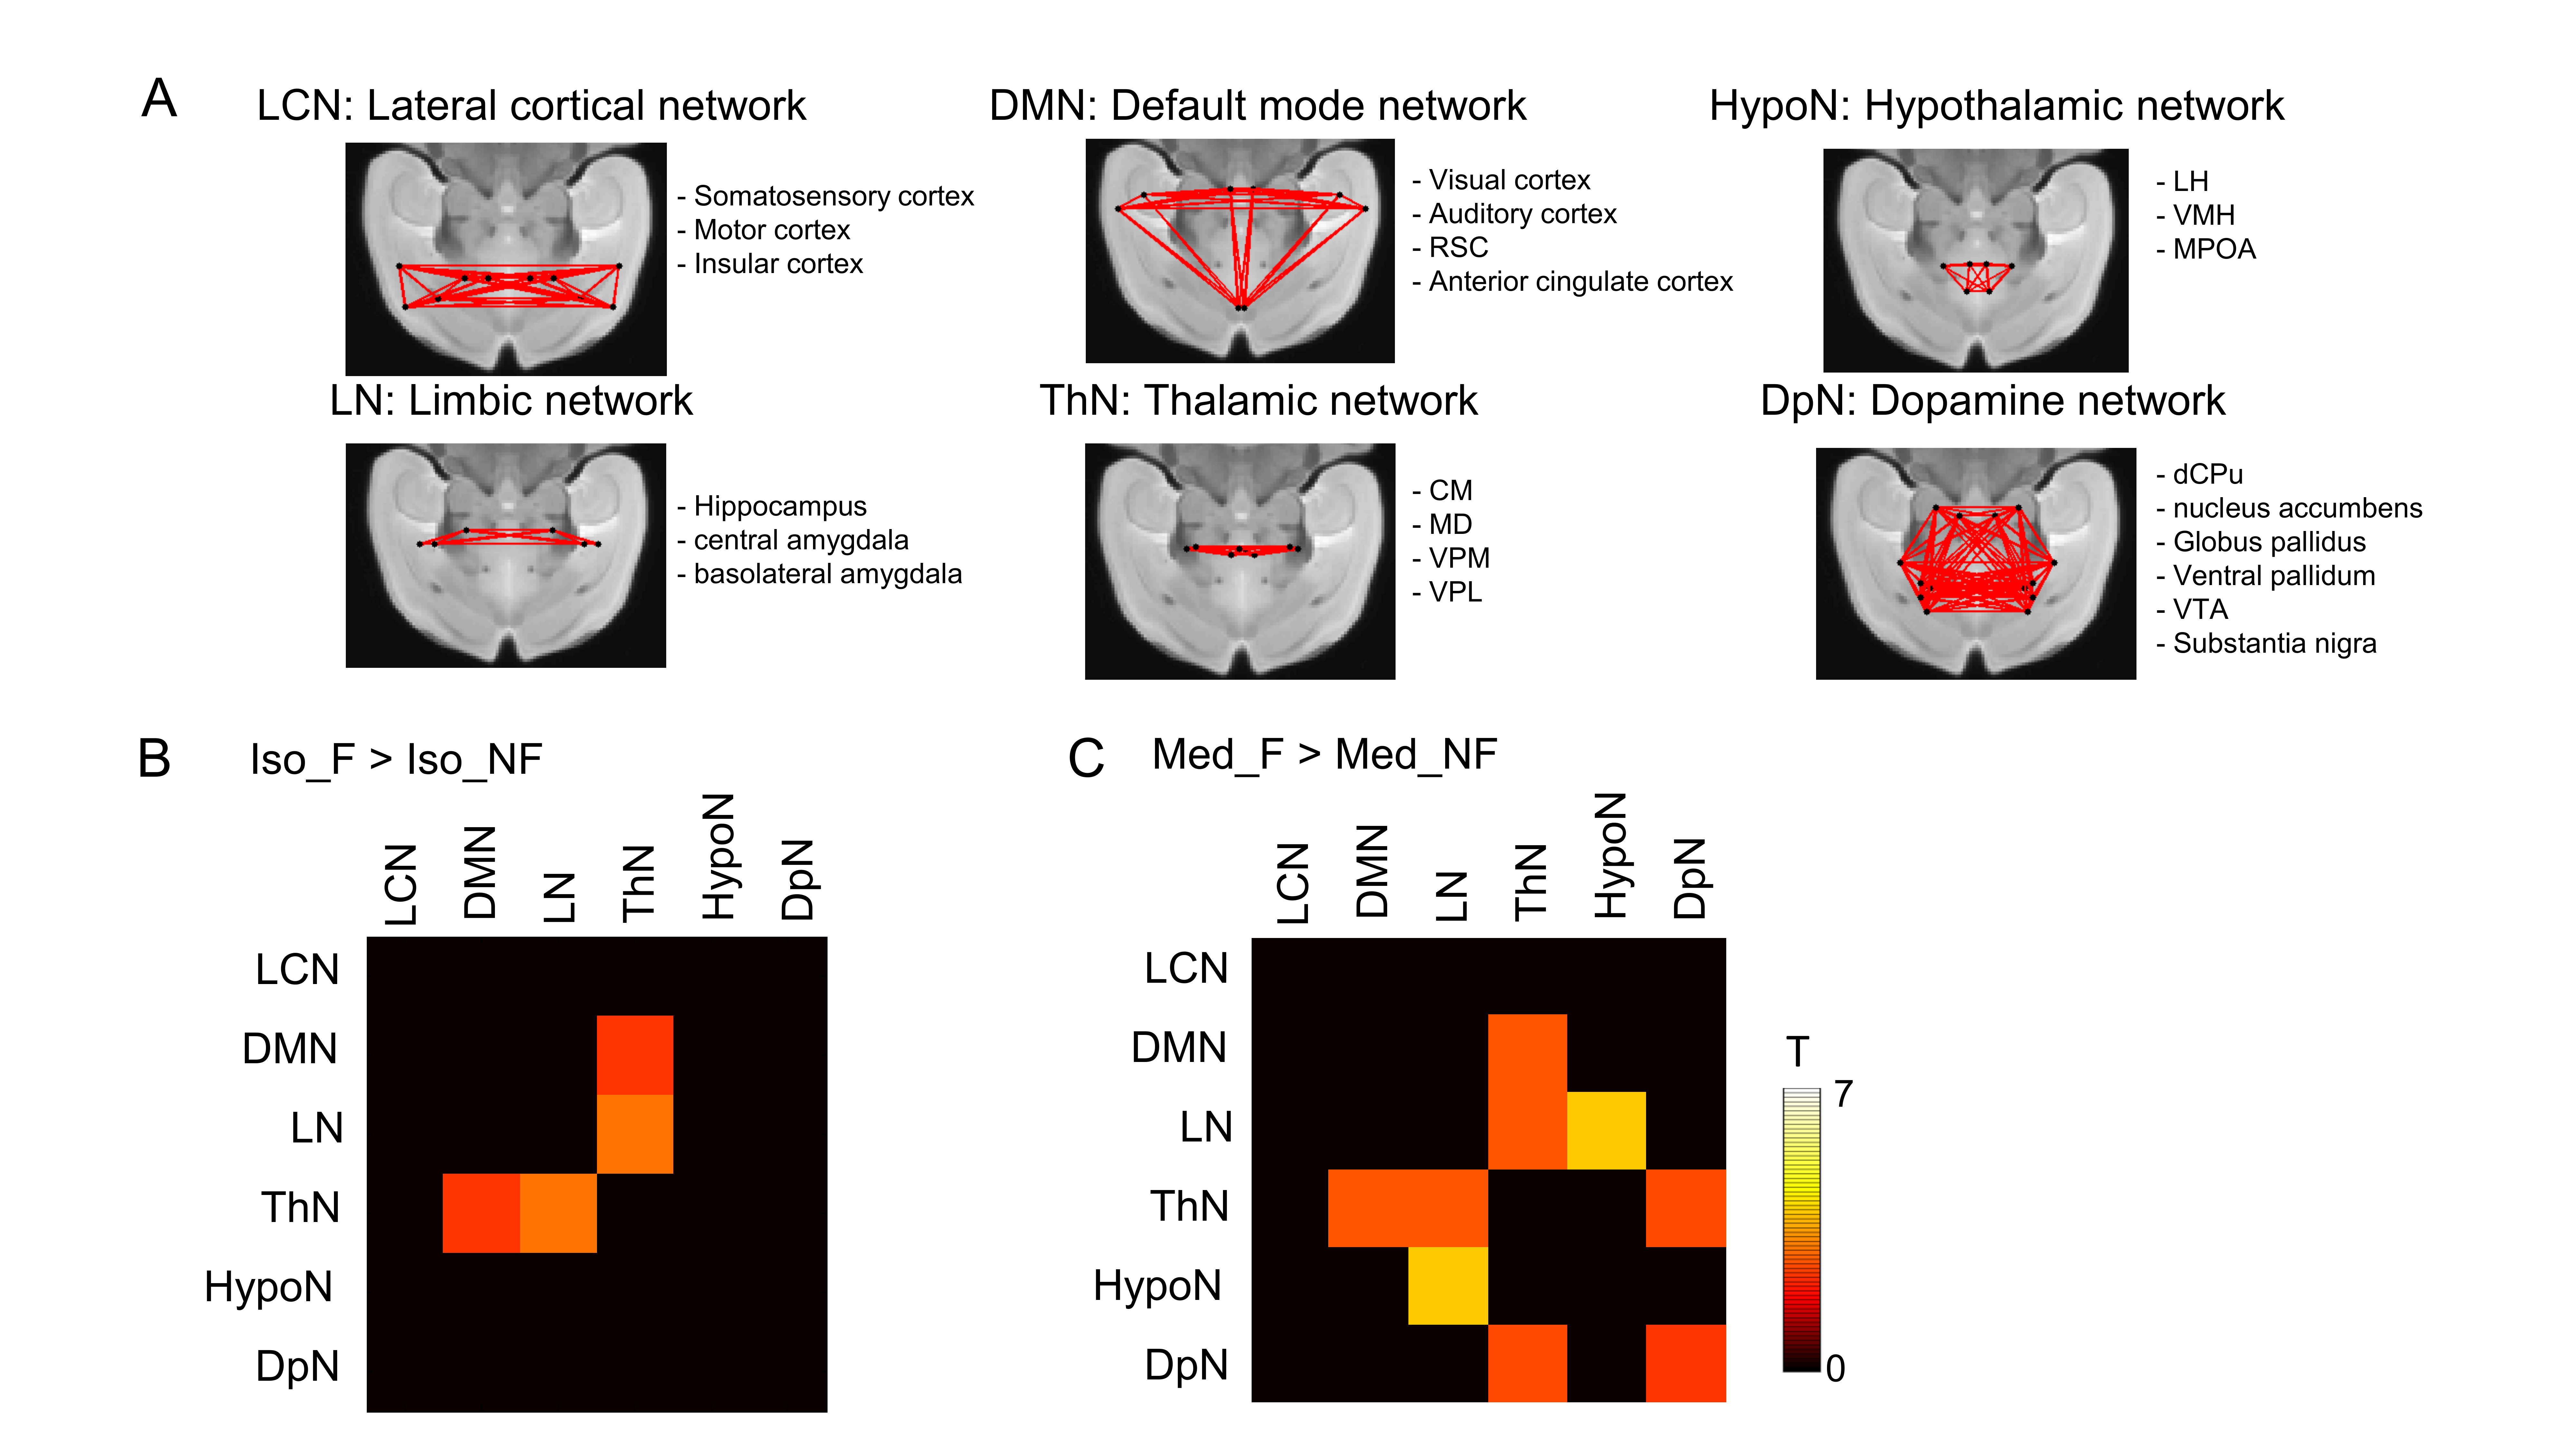
The images were processed with the slice timing correction, realignment and normalization in SPM8. Then the images were detrended and band-pass filtered (0.01-0.08 Hz). The time-courses of the white matter and cerebrospinal fluid were regressed out of the image sets. The time-courses in 52 regions of interest (ROIs) were extracted and then the cross-correlation matrix was calculated between any two ROI time-courses. For network FC analysis, 6 networks were defined based on biological evidences 5,6: the lateral cortical network (LCN), the default mode network (DMN), the limbic network (LN), the thalamic network (ThN), the hypothalamic network (HypoN) and the dopaminergic network (DpN). The averaged correlation coefficients from ROIs included in each network were calculated in each animal. Statistical significance between fasted and non-fasted groups were assessed under each anesthesia (p < 0.05, FDR-corrected).
Blood glucose measurement
In parallel with fMRI, BGL was measured using a blood glucose meter under identical anesthesia conditions.
Results
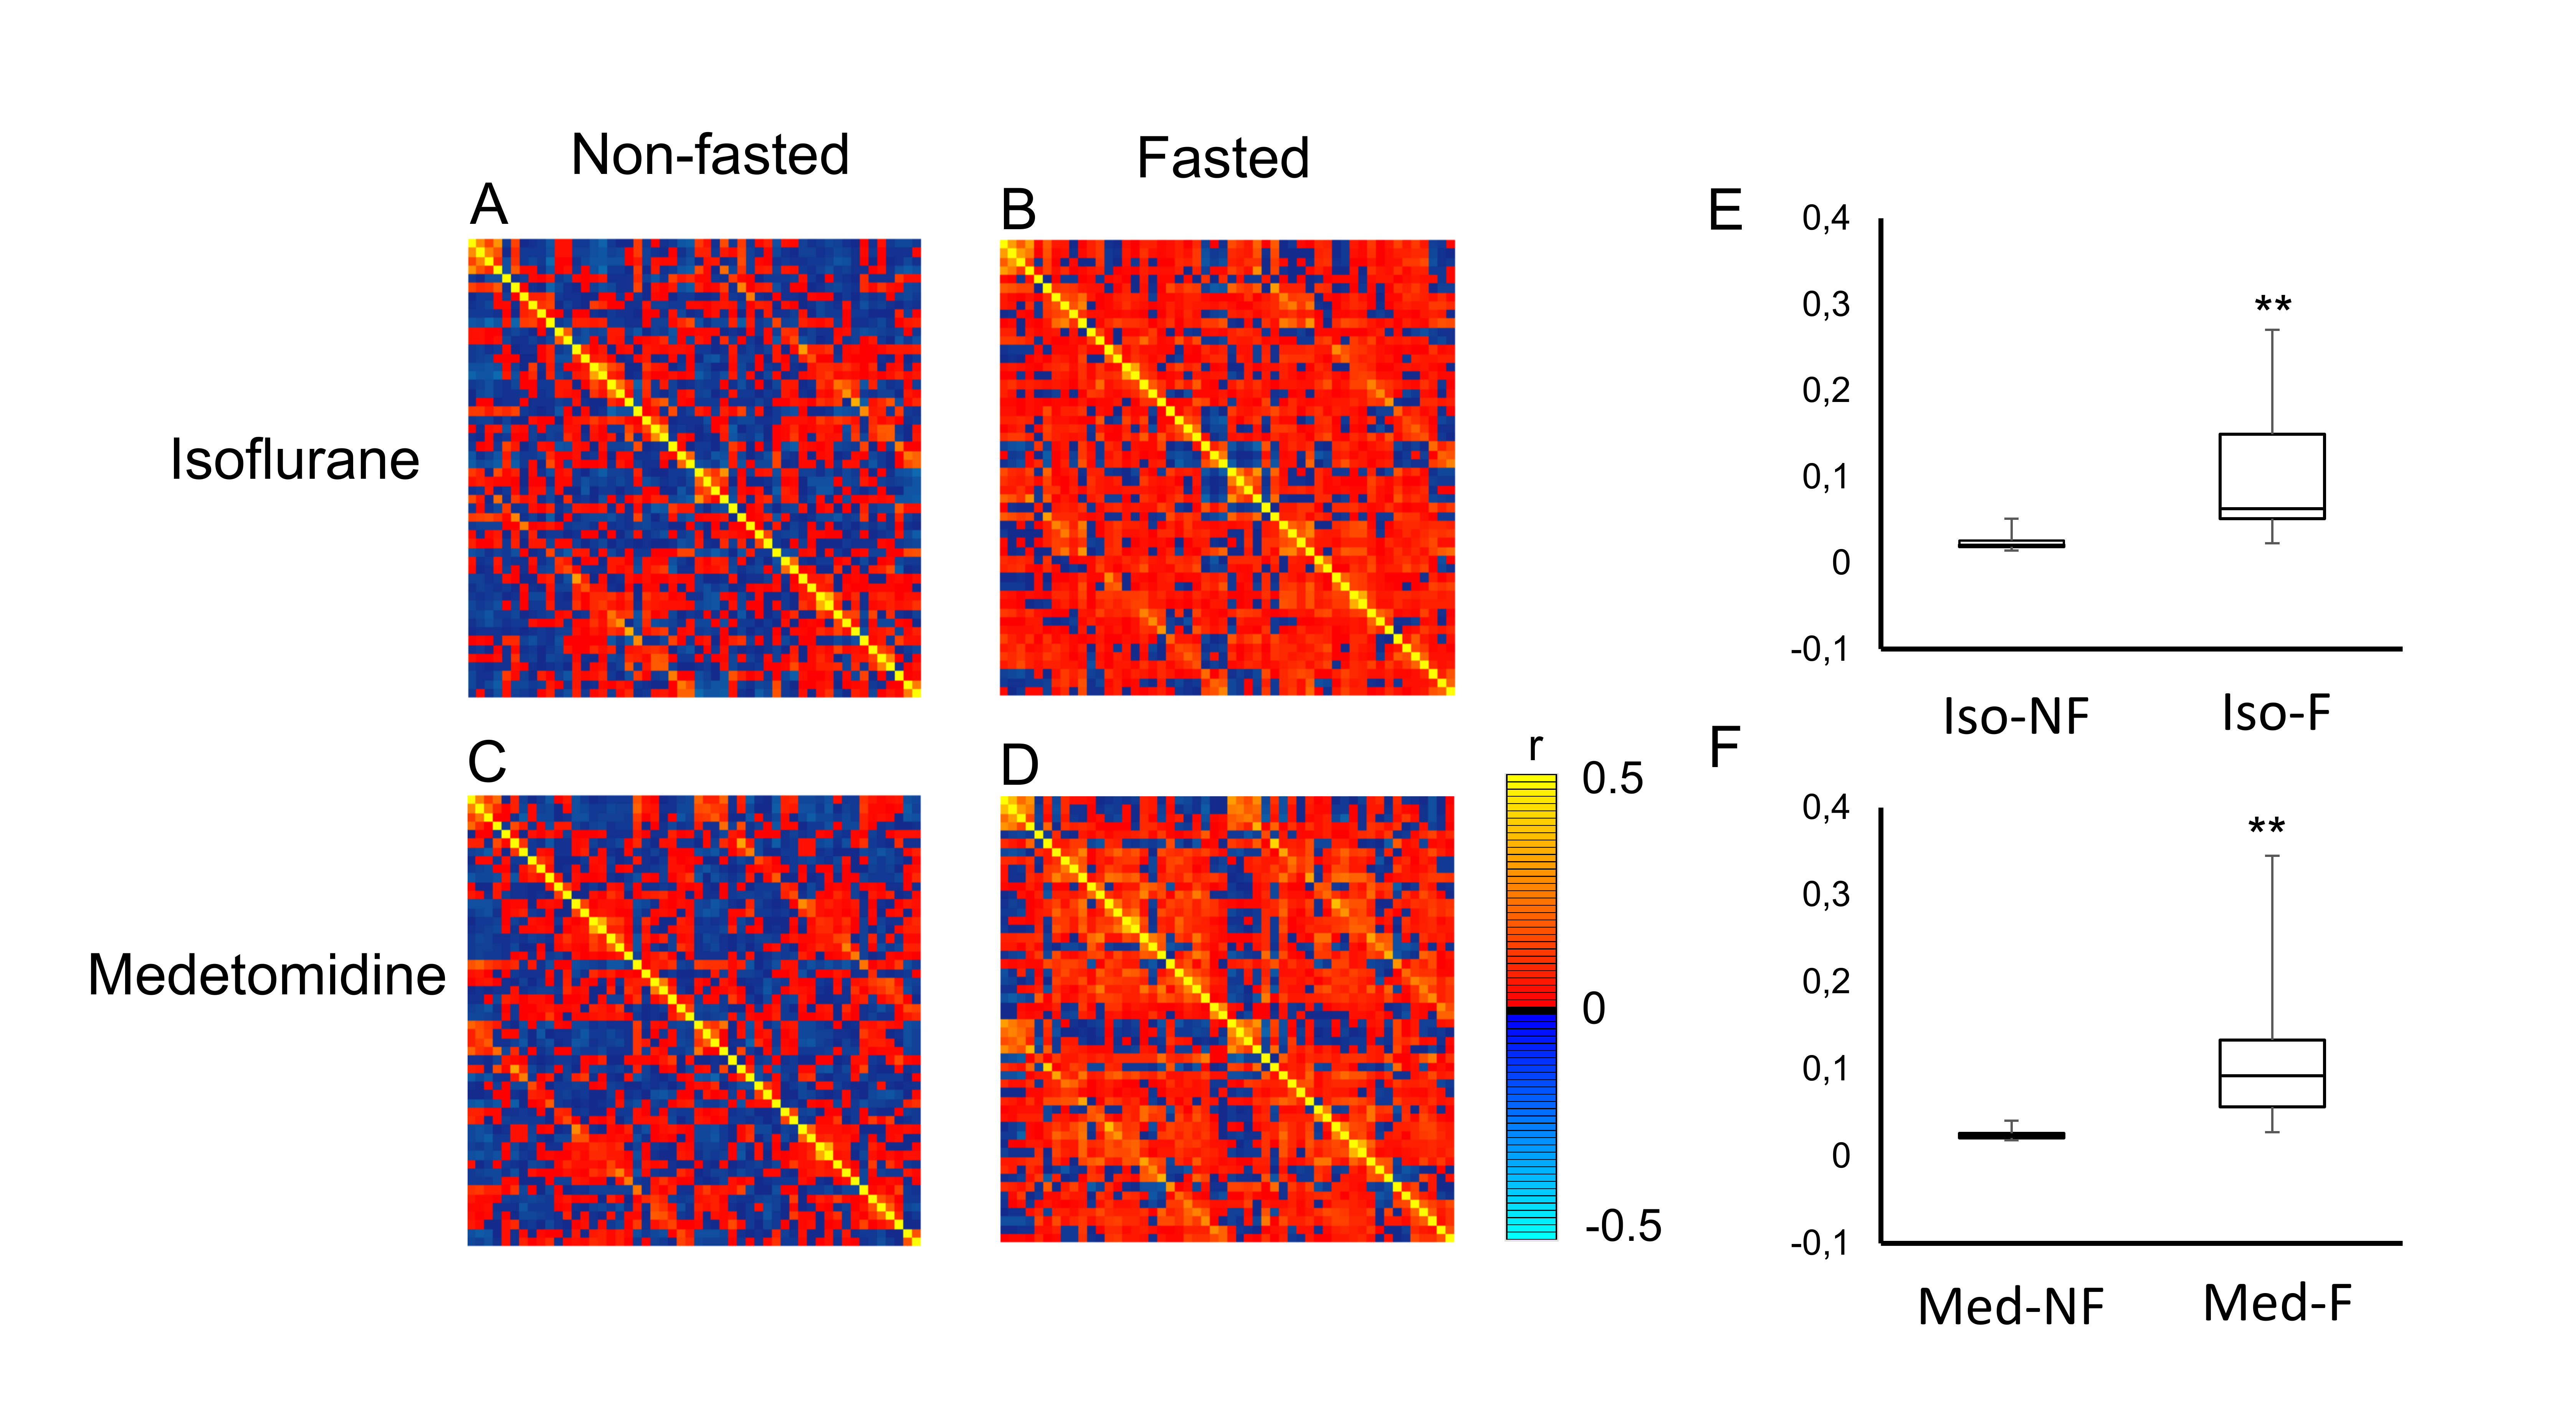
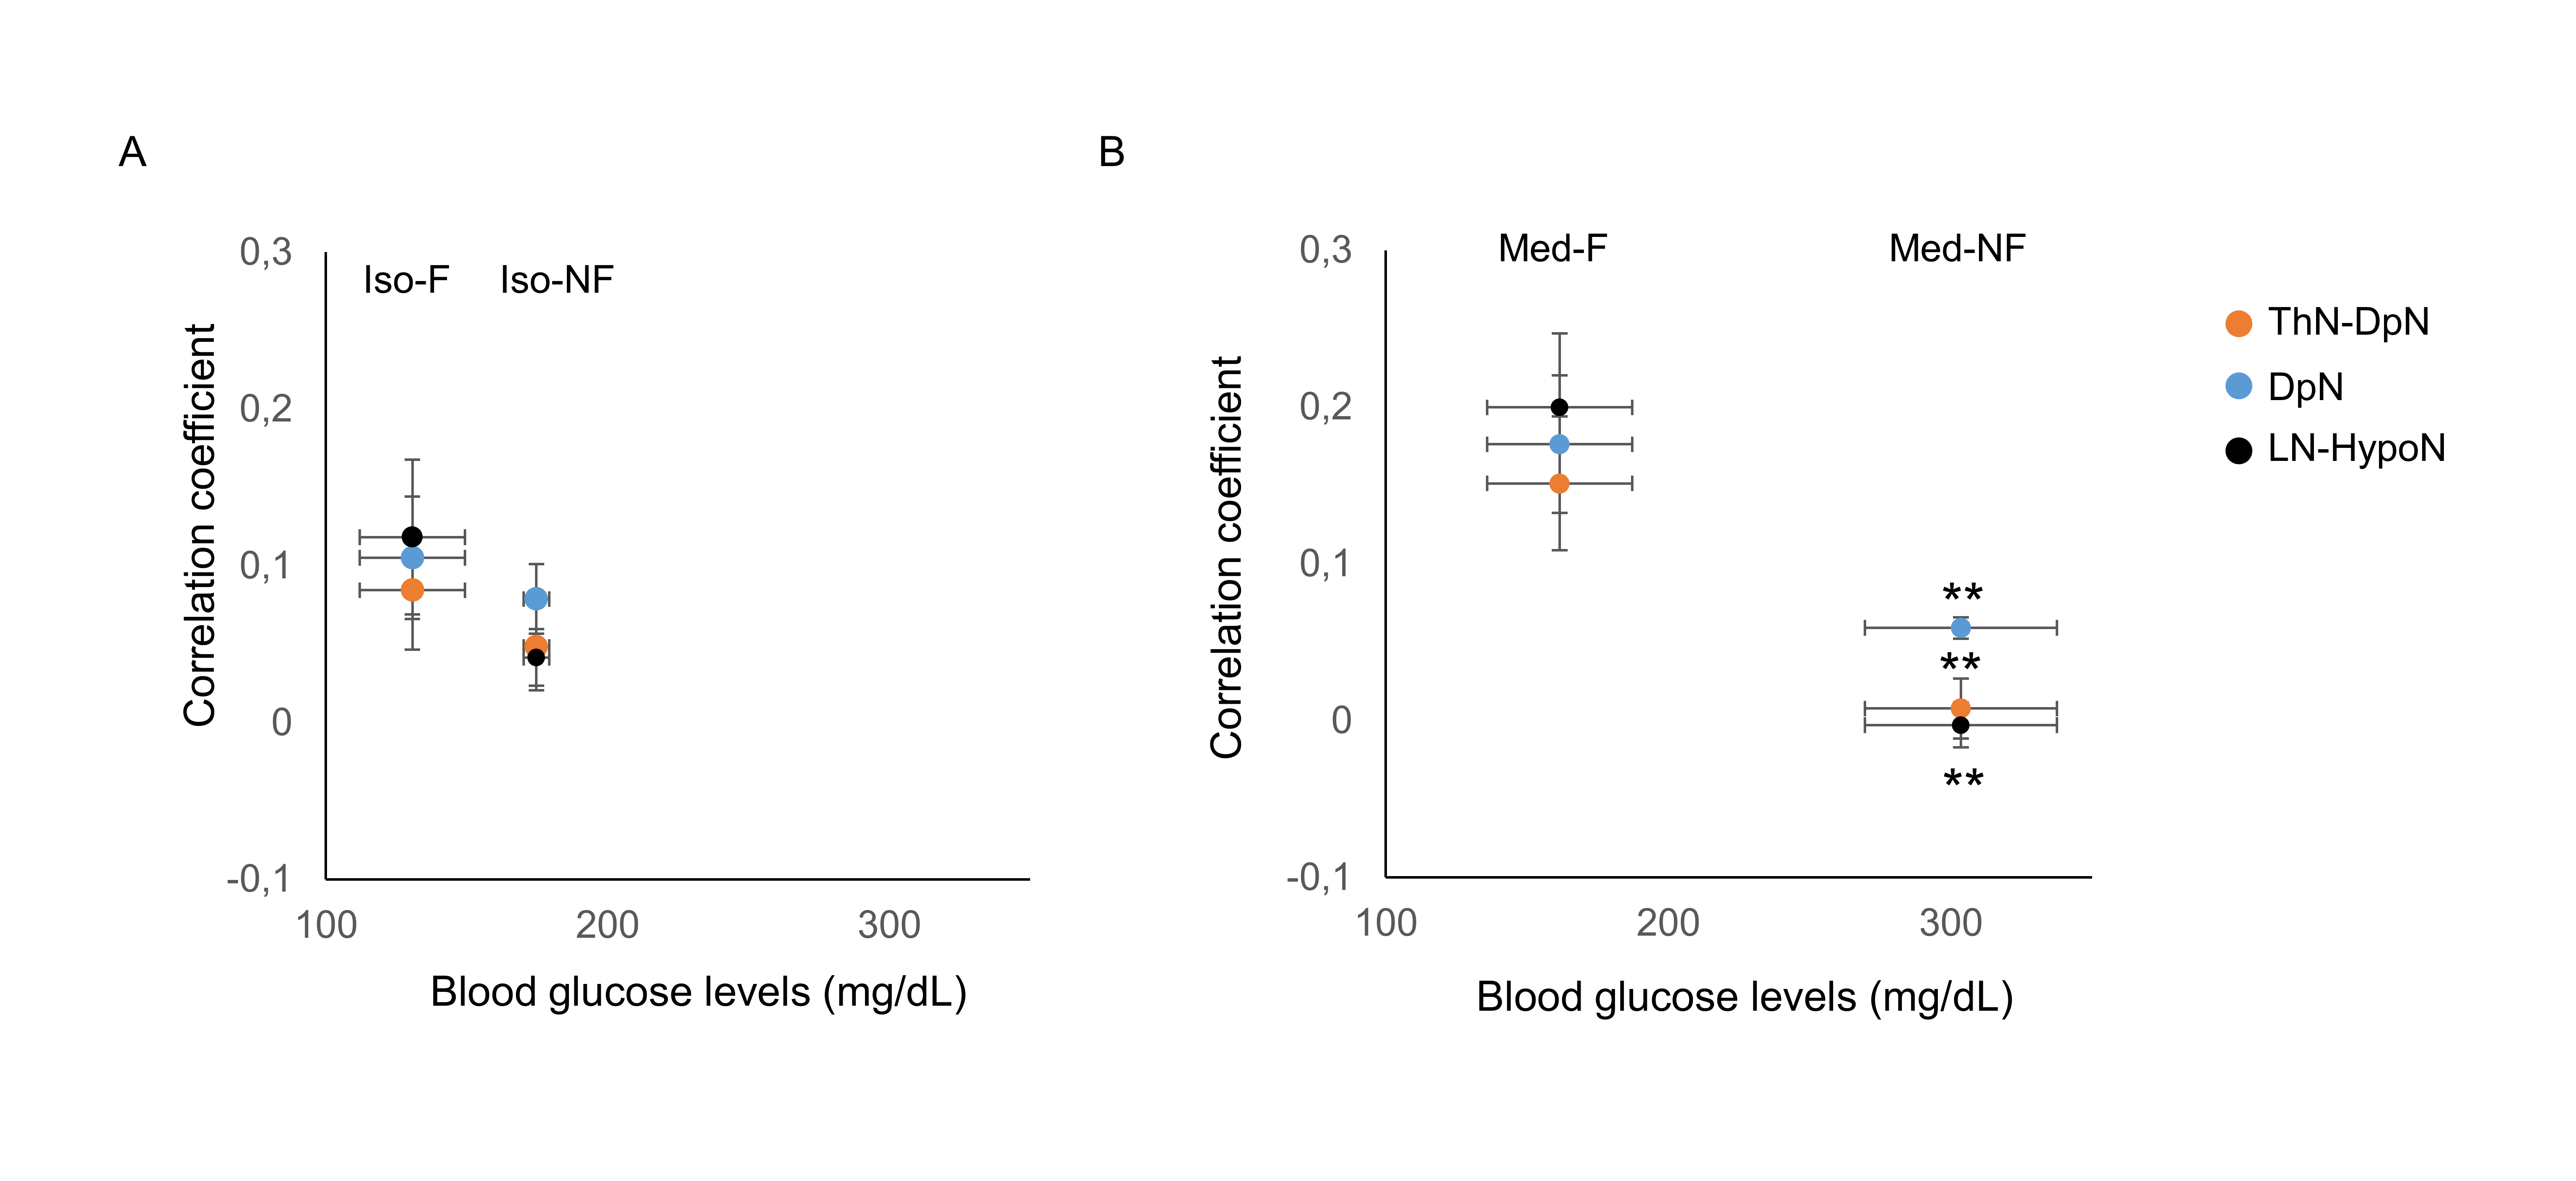
The BGL in Med-NF group significantly increased to the acute hyperglycemic level (Fig. 1). There was no significant difference among Med-F, Iso-F and Iso-NF. The averaged cross-correlation matrix shows that the correlation coefficients in most of the regions increased in fasted mice under both anesthetics (Figs 2A-2D). The averaged correlation coefficients in all ROIs in the fasted mice were significantly higher than those in the non-fasted group under both isoflurane and medetomidine (Figs. 2E and 2F). The comparison of averaged correlation coefficients between the fasted and the non-fasted groups for the 6 networks under each anesthesia is shown in Figure 3. The correlation coefficients in DMN-ThN and LN-ThN in fasted groups were significantly higher under both anesthesia. While the correlation coefficients in the LN-HypoN, ThN-DpN and DpN in the Med-F group were significantly higher than those in the Med-NF group. There was no significance between Iso-F and Iso-NF groups (Figs. 3B and 3C). The scatter plots between the correlation coefficients and BGLs in LN-HypoN, ThN-DpN and DpN are shown in Fig. 4. Although the averaged correlation coefficients decreased at higher BGL under isoflurane, there was no significant difference due to small changes in BGL (Fig. 4A). However, the correlation coefficients significantly decreased at high BGL under medetomidine (Fig. 4B).Discussion
The inverse relationship between BGL and rs-FC in LN-HypoN, DpN-ThN and DpN indicates that the BGL might alter the dopaminergic connections. In contrast, the rs-FC in DMN-ThN and LN-ThN in fasted mice significantly increased both under medetomidine and isoflurane. This implies the influence of other factors in the fasted state, e.g., gut hormones such as ghrelin. Although the BGLs were similar in the Iso-F and the Med-F groups, the averaged correlation coefficients in the Med-F group were higher than those in the Iso-F group. This could be due to the pharmacological effect of medetomidine suppressing the dopaminergic secretion through alpha2A-adrenoceptors 7.Conclusion
Medetomidine is useful for inducing acute hyperglycemia in mouse fMRI study. However, careful attention should be paid when using medetomidine anesthesia in fMRI studies because the rs-FC, including the dopaminergic-thalamic pathway, could be altered by the BGL change.Acknowledgements
References
1. Bello NT, Hajnal. Alterations in blood glucose levels under hyperinsulinemia affect accumbens dopamine. Physiol Behav. 2006;88(1-2):138-145.
2. Tsurugizawa T, Uematsu A, Nakamura E, et al. Mechanisms of neural response to gastrointestinal nutritive stimuli: the gut-brain axis. Gastroenterology. 2009;137(1):262-273.
3. Wright H, Li X, Fallon NB, et al. Differential effects of hunger and satiety on insular cortex and hypothalamic functional connectivity. Eur J Neurosci. 2016;43(9):1181-1189.
4. Ochiai Y, Iwano H, Sakamoto T, et al. Blood biochemical changes in mice after administration of a mixture of three anesthetic agents. J Vet Med Sci. 2016;78(6):951-956.
5. Bukhari Q, Schroeter A, Cole DM, et al. Cole and Markus Rudin. Resting State fMRI in Mice Reveals Anesthesia Specific Signatures of Brain Functional Networks and Their Interactions. Front Neural Circuits. 2017;11:5.
6. Charles R. Gerfen, D. James Surmeier. Modulation of striatal projection systems by dopamine. Annu Rev Neurosci. 2011;34:441-466.
7. Ihalainen JA, Tanila H. In vivo regulation of dopamine and noradrenaline release by alpha2A-adrenoceptors in the mouse nucleus accumbens. J Neurochem. 2004;91(1):49-56.
Figures