4672
Functional brain abnormalities in major depressive disorder: evidence from a Chinese multi-site resting-state functional MRI study1State Key Laboratory of Cognitive Neuroscience and Learning, Beijing Normal University, Beijing, China, 2Beijing Key Laboratory of Brain Imaging and Connectomics, Beijing Normal University, Beijing, China, 3IDG/McGovern Institute for Brain Research, Beijing Normal University, Beijing, China, 4National Clinical Research Center for Mental Disorders & Key Laboratory of Mental Health, Ministry of Health, Peking University the Sixth Hospital, Beijing, China, 5Mental Health Institute, Second Xiangya Hospital of Central South University, Changsha, China, 6Department of Psychology, Southwest University, Chongqing, China, 7Key Laboratory of Cognition and Personality, Ministry of Education, Southwest University, Chongqing, China, 8Department of Psychiatry, The First Affiliated Hospital of China Medical University, Shenyang, China, 9Huaxi MR Research Center (HMRRC), Department of Radiolog, West China Hospital, Sichuan University, Sichuan, China, 10Department of Radiology, The First Affiliated Hospital of China Medical University, Shenyang, China, 11Institute of Neuroscience, Chongqing Medical University, Chongqing, China, 12Chongqing Key Laboratory of Neurobiology, Chongqing, China, 13The First Affiliated Hospital of Chongqing Medical University, Department of Neurology, China
Synopsis
MDD is characterized by disturbances in mood and cognitive functions; however, the pathophysiological mechanism of MDD is incompletely understood. Using the largest resting-state fMRI MDD dataset in China with 1,434 participants, we revealed significant lower functional coordination in the orbitofrontal and primary sensorimotor and visual cortices and higher coordination in the lateral/medial frontoparietal cortices in MDD. These abnormalities were not affected by medication status but were partially influenced by episode number and onset age in patients. These findings provide solid evidence for functional brain disturbances and crucial insights into neuroimaging-based methods for early diagnosis and therapeutic optimization in MDD.
Introduction
Major depressive disorder (MDD) is one of the most prevalent worldwide mental disorders, and is characterized disturbances in mood and cognitive function.1, 2 However, the pathophysiological mechanism of MDD is incompletely understood.3, 4 Recently, advances in resting-state fMRI have provided an unprecedented opportunity for the non-invasive investigation of abnormalities in spontaneous functional coordination in patients with MDD.4-6 Many R-fMRI studies have documented widespread functional abnormalities in MDD.6-14 Clear and consistent conclusions regarding which brain locations exhibit the most significant functional abnormalities in MDD patients are still limited due to the substantial inconsistencies and poor replicability across studies. Moreover, imaging studies using multicenter big data have revealed the strong power of these data in exploring reliable brain abnormalities in MDD patients.15-18 However, studies aiming to locate the brain regions that most frequently display functional abnormalities in patients with MDD using unbiased, large-sample neuroimaging data are still lacking, yet they are crucial for guiding the early diagnosis and treatment optimization of patients with this disorder.Methods
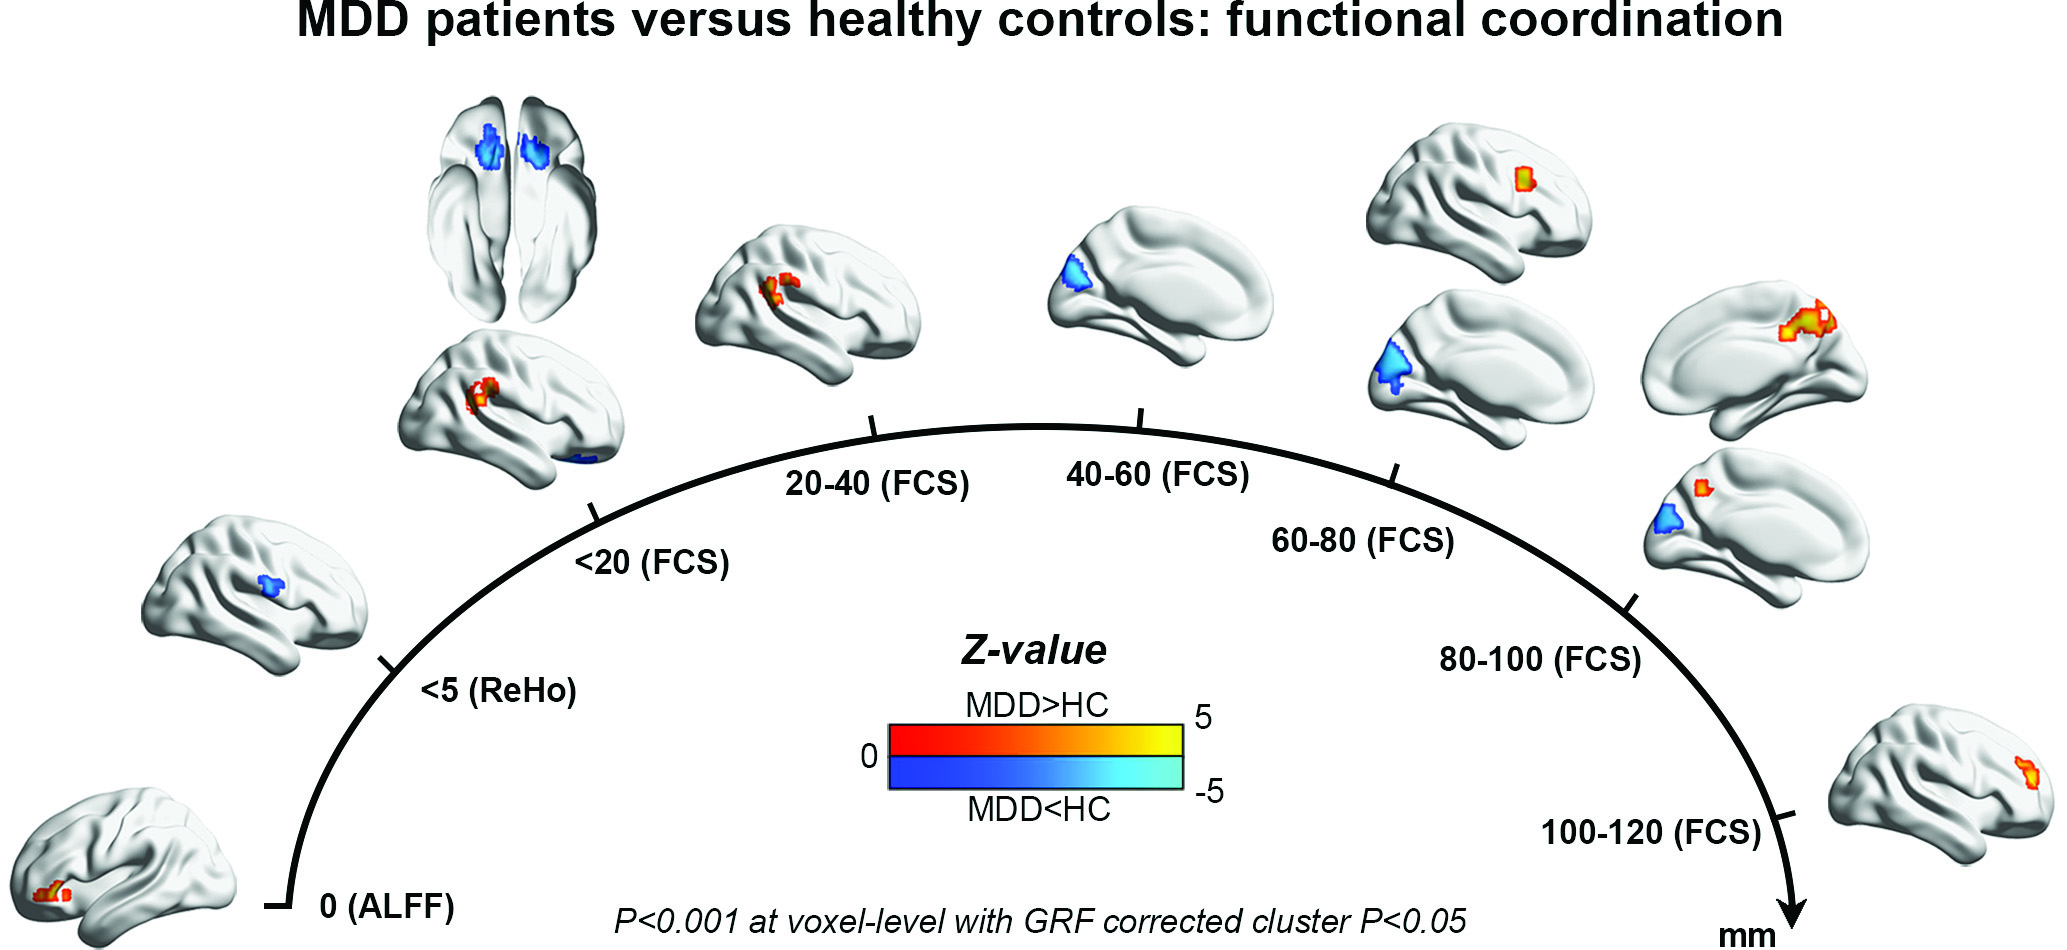
We collected the largest R-fMRI MDD dataset including 1,434 participants: 709 patients and 725 controls, from five centers in China. We established individual functional coordination maps in a voxel-wise manner from very local to long-range connections using amplitude of low-frequency fluctuations (ALFF),19 regional homogeneity (ReHo)20 and functional connectivity strength (FCS)21-23. Specifically, we divided whole-brain functional connectivity into 9 bins with Euclidean distances binned into 20-mm steps and calculated the FCS at each bin. For cross-validation purposes, two different multi-site statistical analysis methods (the stepwise regression analysis and the Liptak-Stouffer z-score method24) were used to identify the functional abnormalities in patients with MDD. The threshold for significance was set at a P<0.001 at the voxel level with Gaussian random-field correction at the cluster level. We further examined the effects of clinical variables (e.g., episode number, medication status and onset age) on the identification of abnormal functional locations.Results
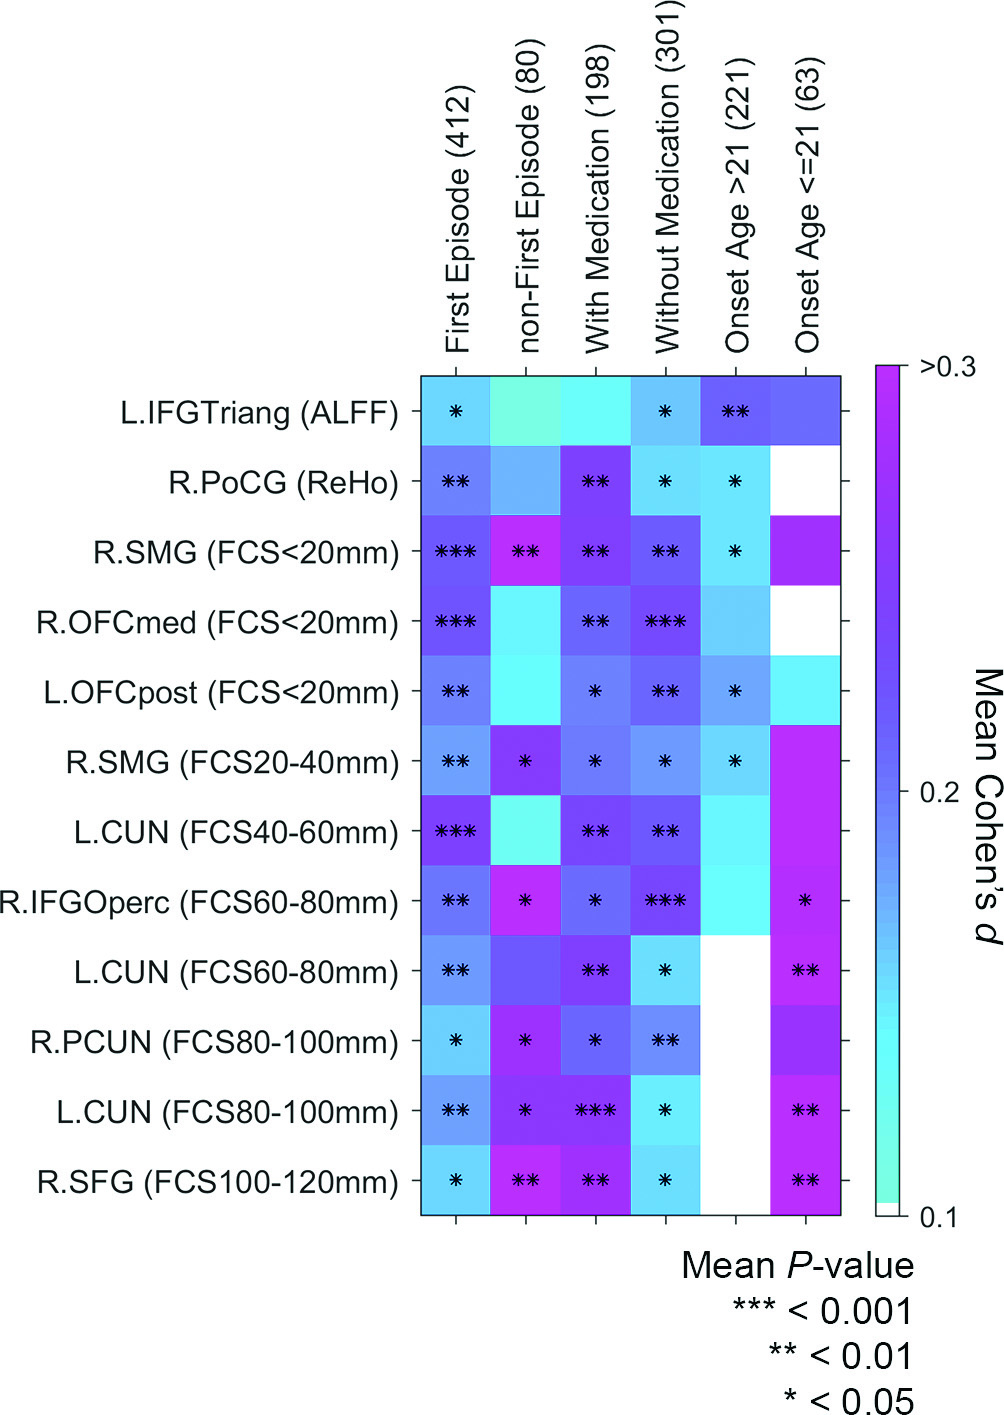
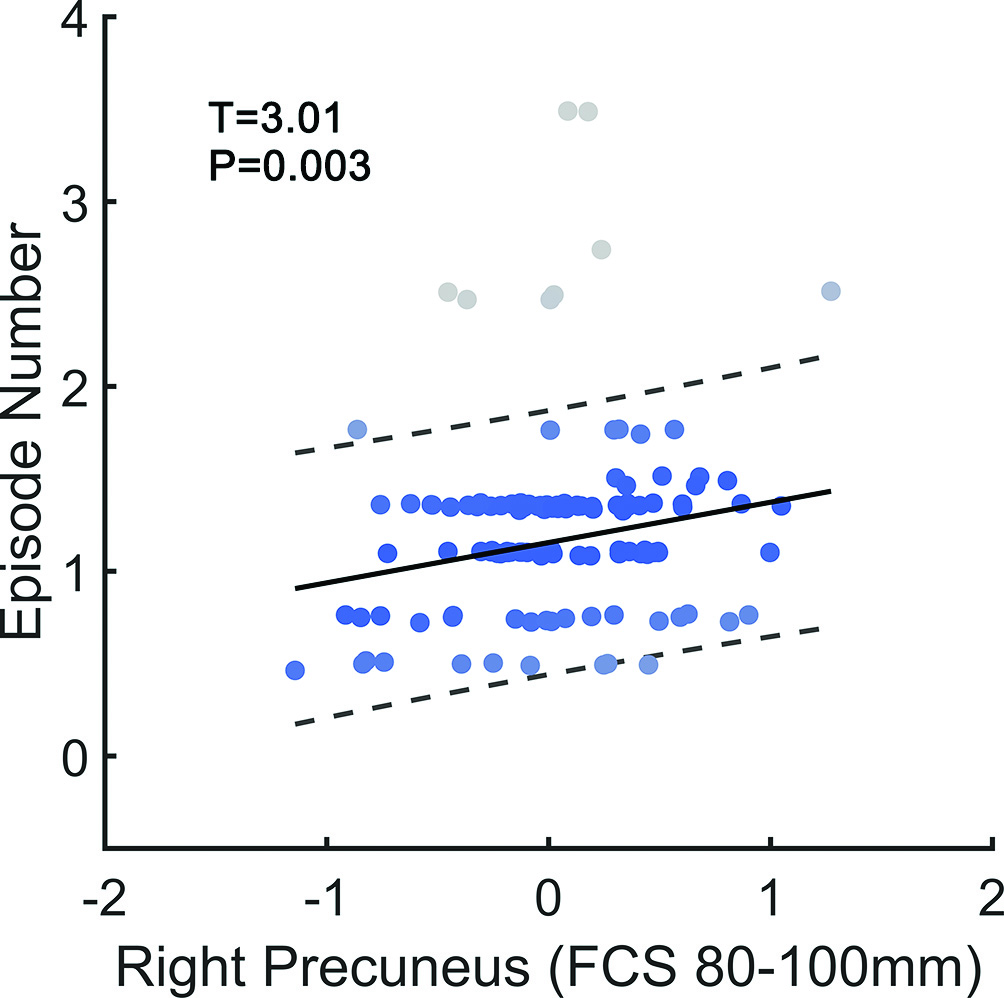
Patients with MDD had significantly lower functional activities in the right postcentral gyrus, the bilateral cuneus, and the bilateral orbitofrontal cortices than the HCs. Furthermore, patients with MDD exhibited significantly higher functional activities in the left triangular part of the inferior frontal gyrus, the right supramarginal gyrus, the right opercular part of the inferior frontal gyrus, the bilateral precuneus, and the right superior frontal gyrus than the HCs (Figure 1). The Liptak-Stouffer z-score method revealed highly consistent results with the stepwise regression analysis. All identified regions remained significant in the first-episode patients, and mostly in the recurrent patients, except for several regions with short-range functional coordination. After dividing the patients into medicated and non-medicated groups, the between-group differences for almost all the clusters remained significant in both groups (except for the left IFGtriang for patients receiving medication). MDD patients with an onset age after 21 years showed short-range abnormalities. In contrast, MDD patients with an onset age in adolescence (age ≤21 years) mainly exhibited long-range abnormalities (Figure 2). Moreover, we observed a significant, positive correlation between the long-range FCS of the right precuneus and the episode number in patients with MDD (Figure 3).Discussion
The medial OFC is associated with reward processing, including reward reinforcement, learning and memory, and is a crucial hub in the reward circuit connecting the medial temporal lobe and prefrontal cortex.25, 26 Previous studies have widely reported MDD-related abnormalities in this region in either structure or function.7, 8, 17 Our findings provide further evidence of abnormal memory systems encoding pleasant feelings and rewards that underlie the persistently depressed mood or loss of interest in activities in patients.
Significant functional decreases of the right opercular part of the PoCG and the cuneus were also observed in patients with MDD. Interestingly, the large-sample, worldwide brain structural study performed by the ENIGMA consortium observed cortical area shrinkage in the orbitofrontal and primary cortices.15 This finding might indicate potential disruptions in structure-function coupling in MDD patients.
Regions with increased functional activity in the lateral/medial frontoparietal cortices were deeply involved in non-reward, emotion-related processing.27-31 MDD-related changes in these regions have been reported in several previous studies.7, 10, 11, 17, 32 Together, the hypercoordination of these key brain areas contributes to the broad spectrum of emotion-related disturbances and cognitive deficits observed in subjects with depression.
Conclusion
Our results highlighted a few cross-validated, dysfunctional brain nodes in patients with MDD from a large-sample, multicenter dataset, which provides solid evidence for functional brain disturbances and crucial insights into neuroimaging-based methods for the early diagnosis and optimization of therapeutic interventions in this disorder.Acknowledgements
This work was supported by grants from the National Natural Science Foundation of China (Grant Nos. 81620108016, 81671767, 81401479, 91432115, 81630031, 31771231, 31271087, 81271499, 81571311 and 81571331), Changjiang Scholar Program of Chinese Ministry of Education (Award No. T2015027), Natural Science Foundation of Beijing Municipality (Grant No. Z151100003915082), Fundamental Research Funds for the Central Universities (Grant Nos. 2017XTCX04 and 2015KJJCA13), National High Tech Development Plan (863) (2015AA020513) and National Outstanding Young People Plan.References
1. Kessler RC, Angermeyer M, Anthony JC et al. Lifetime prevalence and age-of-onset distributions of mental disorders in the World Health Organization's World Mental Health Survey Initiative. World Psychiatry. 2007;6(3):168-176.
2. Murray CJ, Vos T, Lozano R et al. Disability-adjusted life years (DALYs) for 291 diseases and injuries in 21 regions, 1990-2010: a systematic analysis for the Global Burden of Disease Study 2010. Lancet. 2012;380(9859):2197-2223.
3. DeRubeis RJ, Siegle GJ, Hollon SD. Cognitive therapy versus medication for depression: treatment outcomes and neural mechanisms. Nat Rev Neurosci. 2008;9(10):788-796.
4. Gong Q, He Y. Depression, neuroimaging and connectomics: a selective overview. Biol Psychiatry. 2015;77(3):223-235.
5. Biswal B, Yetkin FZ, Haughton VM et al. Functional Connectivity in the Motor Cortex of Resting Human Brain Using Echo-Planar Mri. Magnet Reson Med. 1995;34(4):537-541.
6. Kaiser RH, Andrews-Hanna JR, Wager TD et al. Large-Scale Network Dysfunction in Major Depressive Disorder: A Meta-analysis of Resting-State Functional Connectivity. JAMA Psychiatry. 2015;72(6):603-611.
7. Zhang J, Wang J, Wu Q et al. Disrupted brain connectivity networks in drug-naive, first-episode major depressive disorder. Biol Psychiatry. 2011;70(4):334-342.
8. Wang L, Dai Z, Peng H et al. Overlapping and segregated resting-state functional connectivity in patients with major depressive disorder with and without childhood neglect. Hum Brain Mapp. 2014;35(4):1154-1166.
9. Kuhn S, Gallinat J. Resting-state brain activity in schizophrenia and major depression: a quantitative meta-analysis. Schizophr Bull. 2013;39(2):358-365.
10. Greicius MD, Flores BH, Menon V et al. Resting-state functional connectivity in major depression: abnormally increased contributions from subgenual cingulate cortex and thalamus. Biol Psychiatry. 2007;62(5):429-437.
11. Sheline YI, Price JL, Yan Z et al. Resting-state functional MRI in depression unmasks increased connectivity between networks via the dorsal nexus. Proc Natl Acad Sci U S A. 2010;107(24):11020-11025.
12. Wang L, Xia M, Li K et al. The effects of antidepressant treatment on resting-state functional brain networks in patients with major depressive disorder. Hum Brain Mapp. 2015;36(2):768-778.
13. Zhu X, Wang X, Xiao J et al. Evidence of a dissociation pattern in resting-state default mode network connectivity in first-episode, treatment-naive major depression patients. Biol Psychiatry. 2012;71(7):611-617.
14. Lui S, Wu Q, Qiu L et al. Resting-state functional connectivity in treatment-resistant depression. Am J Psychiatry. 2011;168(6):642-648.
15. Schmaal L, Hibar DP, Samann PG et al. Cortical abnormalities in adults and adolescents with major depression based on brain scans from 20 cohorts worldwide in the ENIGMA Major Depressive Disorder Working Group. Molecular psychiatry. 2017;22(6):900-909.
16. Schmaal L, Veltman DJ, van Erp TG et al. Subcortical brain alterations in major depressive disorder: findings from the ENIGMA Major Depressive Disorder working group. Molecular psychiatry. 2016;21(6):806-812.
17. Cheng W, Rolls ET, Qiu J et al. Medial reward and lateral non-reward orbitofrontal cortex circuits change in opposite directions in depression. Brain. 2016;139(Pt 12):3296-3309.
18. Drysdale AT, Grosenick L, Downar J et al. Resting-state connectivity biomarkers define neurophysiological subtypes of depression. Nat Med. 2017;23(1):28-38.
19. Zang YF, He Y, Zhu CZ et al. Altered baseline brain activity in children with ADHD revealed by resting-state functional MRI. Brain & development. 2007;29(2):83-91.
20. Zang Y, Jiang T, Lu Y et al. Regional homogeneity approach to fMRI data analysis. Neuroimage. 2004;22(1):394-400.
21. Buckner RL, Sepulcre J, Talukdar T et al. Cortical hubs revealed by intrinsic functional connectivity: mapping, assessment of stability, and relation to Alzheimer's disease. J Neurosci. 2009;29(6):1860-1873.
22. Liang X, Zou Q, He Y et al. Coupling of functional connectivity and regional cerebral blood flow reveals a physiological basis for network hubs of the human brain. Proc Natl Acad Sci U S A. 2013;110(5):1929-1934.
23. Liao XH, Xia MR, Xu T et al. Functional brain hubs and their test-retest reliability: a multiband resting-state functional MRI study. Neuroimage. 2013;83:969-982.
24. Liptak T. On the combination of independent tests. Magyar Tud Akad Mat Kutato Int Kozl. 1958;3:171-197.
25. Kringelbach ML, Rolls ET. The functional neuroanatomy of the human orbitofrontal cortex: evidence from neuroimaging and neuropsychology. Progress in neurobiology. 2004;72(5):341-372.
26. Rolls ET. A non-reward attractor theory of depression. Neurosci Biobehav Rev. 2016;68:47-58.
27. Johnston SJ, Boehm SG, Healy D et al. Neurofeedback: A promising tool for the self-regulation of emotion networks. Neuroimage. 2010;49(1):1066-1072.
28. Silani G, Lamm C, Ruff CC et al. Right supramarginal gyrus is crucial to overcome emotional egocentricity bias in social judgments. J Neurosci. 2013;33(39):15466-15476.
29. Hofer A, Siedentopf CM, Ischebeck A et al. Gender differences in regional cerebral activity during the perception of emotion: a functional MRI study. Neuroimage. 2006;32(2):854-862.
30. Cavanna AE, Trimble MR. The precuneus: a review of its functional anatomy and behavioural correlates. Brain. 2006;129(Pt 3):564-583.
31. Aron AR, Robbins TW, Poldrack RA. Inhibition and the right inferior frontal cortex. Trends Cogn Sci. 2004;8(4):170-177.
32. Biver F, Goldman S, Delvenne V et al. Frontal and parietal metabolic disturbances in unipolar depression. Biol Psychiatry. 1994;36(6):381-388.
33. Xia M, Wang J, He Y. BrainNet Viewer: a network visualization tool for human brain connectomics. PLoS One. 2013;8(7):e68910.
Figures